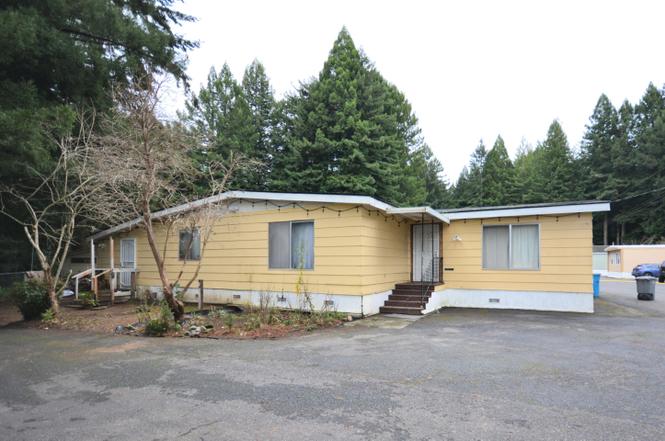
7660 Myrtle Ave Ave #70 · Indianola, CA
Flood risk 1/10 · Minimal
- FEMA flood zone
- X (unshaded)
- Chance of flooding over 30 yrs
- 0.0%
- Est. flood insurance / yr
- $507 – $1,088
Fire risk 3/10 · Minor
- Est. fire insurance / yr
- $659 – $1,223
Heat risk 1/10 · Minimal
- Hot days now (above 78°F)
- 7 days/yr
- Hot days in 30 yrs
- 17 days/yr
Wind risk 1/10 · Minimal
- Chance of severe wind over 30 yrs
- —
Air-quality risk 6/10 · Moderate
- Unhealthy air days now
- 10 days/yr
- Unhealthy air days in 30 yrs
- 10 days/yr
Risk factors via First Street. Map © Google.
Why this score? — see what drove the B- grade
The composite is a weighted blend of 9 inputs, each scored 0–100. Each bar is that input's sub-score; the figure is the points it added to the 100-point composite (weight × sub-score).
- Cash flow +30.0/30.0
- 1% rule +10.0/10.0
- DSCR +10.0/10.0
- ARV discount +7.5/15.0
- Schools +5.0/10.0
- Rent growth +2.5/5.0
- Condition / age +2.5/5.0
- Livability +2.2/5.0
- Appreciation +0.0/10.0
$69,999
🖨 Deal sheet (PDF) 📄 Offer letter ✓ Due diligence
Listing remarks
This home is ready for new owners. This home needs some cosmetic work but is ready for your family. This home sits on a corner with views of the valley. It is a very large home with an open concept. View today.
Key facts
- Views of the valley
- Open concept
- Built 1976
Tags
Property features AI
Exterior
- Utilities: Public water; Public sewer; Electricity connected (circuit breakers); Natural gas connected/available
- Home design: Residential single-family residence; Dual wide mobile home; Corner lot; Located in a mobile home park (Mobile Estates)
- Construction: Wood siding; Shingle roof
- Exterior features: Level lot; Paved road access; Private maintained road; Insulation (energy efficient)
Interior
- Kitchen: Range; Refrigerator
- Bedrooms: 7 total rooms (includes bedrooms and living spaces)
- Flooring: Carpet; Wood; Laminate
- Heating & cooling: Electric heating; Forced air heating; Natural gas heating; Ceiling fan cooling
- Interior features: Ceiling fans; Built-in features; Double-pane windows; Has view
- Laundry & utility: Washer hookup
Neighborhood map
What this means for you Summary
Snapshot
- This is a 4-bed/3.0-bath manufactured listed at $70k.
Deal economics
- At list price, monthly cash flow is $913 ($11k/yr) — positive.
- The deal already cash-flows at list — no discount required.
- Meets the 1% rule at list price ($2k rent vs $70k).
- Recommended offer: $62k (12.0% below list) — sets the bar for market timing.
Location & tenants
- Location reads 44/100 on livability (#1,322 in CA) — a working-class tenant base; expect higher turnover. Watch: health & safety C-, crime F, amenities F.
- Zoned schools: Freshwater Elementary (math 32% / reading 52%, grade F, #557 of 1,571 statewide, top 38%, 264 students, 40% FRL); Freshwater Charter Middle (math 34% / reading 54%, grade D, #130 of 498 statewide, top 27%, 43 students, 46% FRL, charter).
- Market conditions: 160 active listings in the ZIP; 188 units permitted in Humboldt County in 2024 (17 in 5+ unit buildings).
Forward outlook
- Local home prices are declining (-3.0%/yr); year-one equity from $484 of loan paydown is wiped out by about $2k of value loss. Plan a longer hold.
- Humboldt County population projected to shrink 4% by 2050 — rents likely to lag national; underwrite the cash flow, not the appreciation.
- At projected returns (-3.0% appreciation + 3.0% rent growth), your $20k cash investment doubles in ~3 years — after that, you're playing with house money.
Negotiation context
- It's been on market 164 days — a 12% lower offer ($62k) is reasonable based on typical stale-listing flexibility.
Questions for the listing agent
- It's been on market 164 days. Have you received any prior offers? Is the seller open to a 12% concession, seller financing, or rate buy-down credit?
- Built in 1976 — when were the roof, HVAC, electrical panel, plumbing, and water heater last replaced?
- Why hasn't it sold? Are there any deal-killer items the seller is aware of (foundation, flood, title, zoning, code violations)?
- Is there a deadline driving the sale (1031 exchange, divorce, estate, relocation)? That informs how much negotiation room exists.
- Schools are F-rated, which usually means shorter tenancies and higher turnover. Who's the typical renter profile here, and what's been the actual vacancy rate?
- Crime grade is F in this area — have there been break-ins, vandalism, or insurance claims at this property in the last 3 years? What carrier currently insures it and at what premium?
- What's the average days-on-market for RENTAL listings here right now (not sales)? A rising rental-DOM trend means longer vacancies and softer asking-rent achievability than the comps imply.
- What's the recent tenant-quality profile in this submarket — average credit score on applications, eviction rate, late-payment / NSF rate, and stable-employment percentage? A property-management company in the area should have these aggregated.
- How much new for-sale + rental construction is in the pipeline within 1–3 miles? Heavy new supply typically softens prices + rents 12–24 months out; constrained supply supports both.
Investment metrics
- 1% rule
- 2.53% ✓
- Cap rate
- 21.95%
- Cash-on-cash
- 55.93%
- DSCR
- 3.49
- GRM
- 3.3
CMA / ARV
No comps found within radius.
Projected returns pro-forma
-3.0% appreciation · 3.0% rent growth · sell at horizon
- IRR
- 54.3%
- Equity multiple
- 3.39×
- Total profit
- $46,862
- Equity at exit
- $10,437
- IRR
- 59.4%
- Equity multiple
- 6.91×
- Total profit
- $115,829
- Equity at exit
- $6,052
Cash invested: $19,600 (down + closing). Projections, not guarantees.
Landlord ↔ Tenant lean methodology
- Overall (STATE)
- 18 Strongly Tenant-Friendly
- State California
- 18 Strongly Tenant-Friendly · D+13
- County
- — inherits STATE
- City
- — inherits STATE
ZIP-level market 95503
- Active inventory
- 160
- Price-to-rent
- 3.3×
Monthly cashflow live
- Estimated rent
- $1,769 medium interval (Pro) →
- Mortgage (P&I)
- −$367
- Tax est. 1.5%
- −$87 /mo · $1,050/yr
- Insurance
- −$29
- HOA
- −$0
- Lot rent leased land?
- −$0
- Vacancy / Maint / Mgmt
- −$371
- Net cashflow
- $913
Break-even live
Sensitivity live
| Price | -10% $962 | -5% $938 | +0% $913 | +5% $889 | +10% $865 |
|---|---|---|---|---|---|
| Rent | -10% $774 | -5% $844 | +0% $913 | +5% $983 | +10% $1,053 |
| Rate | -1.0pp $949 | -0.5pp $931 | base $913 | +0.5pp $895 | +1.0pp $877 |
UW: 25.0% down · 7.5% · 30yr · 1.5% tax · 5.0% vac · 8.0% maint · 8.0% mgmt
Financing live
Cash to close
- Down payment
- $17,500
- Closing costs
- $2,100
- Reserves months
- —
- Total cash needed
- —
Loan-product check · same deal, 3 products live
Conventional
25% down · 7.5% · 30yr
- Down + closing
- —
- Monthly P&I
- —
- Monthly cashflow
- —
- DSCR
- —
- Eligible?
- —
Personal DTI + credit; lowest rate.
DSCR
20% down · 8.5% · 30yr
- Down + closing
- —
- Monthly P&I
- —
- Monthly cashflow
- —
- DSCR
- —
- Eligible?
- —
No personal income docs; deal must DSCR.
Hard money
10% down · 12.0% · 12mo
- Down + closing
- —
- Monthly P&I
- —
- Monthly cashflow
- —
- DSCR
- —
- Eligible?
- —
Short-term bridge; refi at stabilization.
Listing history 21 events
-
2026-06-21days on market $69,999 Active 164 DOM
-
2026-06-19days on market $69,999 Active 162 DOM
-
2026-06-18days on market $69,999 Active 161 DOM
-
2026-06-17days on market $69,999 Active 160 DOM
-
2026-06-16days on market $69,999 Active 159 DOM
-
2026-06-15days on market $69,999 Active 158 DOM
-
2026-06-14days on market $69,999 Active 156 DOM
-
2026-06-13days on market $69,999 Active 155 DOM
-
2026-06-10days on market $69,999 Active 153 DOM
-
2026-06-09days on market $69,999 Active 152 DOM
-
2026-06-08days on market $69,999 Active 151 DOM
-
2026-06-07days on market $69,999 Active 150 DOM
-
2026-06-03days on market $69,999 Active 146 DOM
-
2026-06-02days on market $69,999 Active 145 DOM
-
2026-06-01days on market $69,999 Active 144 DOM
-
2026-05-31days on market $69,999 Active 143 DOM
-
2026-05-30days on market $69,999 Active 142 DOM
-
2026-04-17price $69,999
-
2026-04-10price $78,000
-
2026-03-10price $90,000
-
2026-01-08$125,000 Active
ⓘ Source: listings_history table (triggers on properties + properties_extension) + one-shot
backfill from property_details.listing_events for pre-trigger history.
Climate risk First Street
- Flood 1/10 Low FEMA zone X (unshaded) · 0% chance over 30 yrs
- Wildfire 3/10 Moderate
- Heat 1/10 Low 7 d/yr ≥78°F today · 17 d/yr by 30 yrs out
- Wind 1/10 Low
- Air quality 6/10 Major 10 unhealthy d/yr today · 10 by 30 yrs out
Nearby sold comps map
Loading sold comps map…
Walkable amenities ~0.75 mi
Loading nearby amenities…
Taxation est. · year 1
- Rental income
- $21,223
- − Mortgage interest
- −$3,921
- − Property taxes
- −$1,050
- − Insurance
- −$350
- − Repairs & maintenance
- −$1,698
- − Management
- −$1,698
- − Depreciation
- −$2,036
- Taxable income
- $10,470
- Est. tax owed @ 24.0%
- −$2,513
- After-tax cash flow
- $8,449/yr
For passive investors: Depreciation is non-cash, so a rental often shows a tax loss while cash-flowing — sheltering income. Rental losses are passive: they offset passive income freely, and up to $25,000/yr can offset ordinary (W-2) income if you actively participate and your MAGI is under $100k (phasing out to $0 by $150k); unused losses carry forward. On sale, claimed depreciation is recaptured at up to 25%, and gains may owe capital-gains tax (a 1031 exchange can defer both). Figures are a year-1 estimate at your 24.0% rate — not tax advice; consult a CPA.
Schools (NCES district)
No district data.
Livability — Indianola
- Score
- 44/100
- State rank
- #1322
- US rank
- #26702
Category grades
Schools grade is shown separately in the Schools card above.
Census & demographics
- Census place
- Indianola, CA
- County
- Humboldt County · 88,652 people
- Metro
- Eureka-Arcata, CA
- Population (ZIP)
- 25,054
- Household income
- $71,855
- Rent vs Own
- Severe rent burden
- 780.0
Population outlook (Humboldt County) Hauer SSP2
- Today (2025)
- 135,550 people
- By 2030
- 134,798 · -0.6%
- By 2040
- 132,222 · -2.5%
- By 2050
- 130,850 · -3.5%
- By 2075
- 128,656 · -5.1%
- By 2100
- 120,238 · -11.3%
Race, ethnicity, and origin ACS 2023
- Neighborhood character
- Predominantly White (72%)
- Race & ethnicity
- White 72% Hispanic / Latino 14% Two or more races 11% Asian 4% Native American 2%
- Hispanic origin (detail)
- Mexican 10% Cuban 1%
- Common ancestry
- Italian 4% Portuguese 2% Slovak 2%
- Foreign-born
- 8% · Canada, Vietnam
- Languages at home
- 90% English-only · Spanish 5% Other Asian/Pacific 2% Vietnamese 1%
Political lean MEDSL · Humboldt
- 2024 margin
- Strong D (+28.4) · D 62.0% · R 33.6% · Other 4.5%
- 2008→2024 swing
- +0.2pp no change · 2008: 28.2pp · 2024: 28.4pp
- All cycles
- 2024: D+28.4 2020: D+33.4 2016: D+25.9 2012: D+26.2 2008: D+28.2
Not yet ingested
- Civics
- —
Market trends
- HPI YoY
- ▼ -268.60%
- Current HPI
- 235.5679
- Rent YoY
- —
- Metro
- Eureka-Arcata, CA
- State GDP YoY
- ▲ 3.21%
- F500 in state
- 116
Industry mix (Fortune 500 HQ in CA)
| Industry | F500 HQs | Revenue |
|---|---|---|
| Technology | 27 | $1,492B |
|
||
| Financial Services | 3 | $174B |
|
||
| Retail | 3 | $44B |
|
||
| Insurance | 3 | $26B |
|
||
| Media / Entertainment | 2 | $115B |
|
||
| Pharmaceuticals / Biotech | 2 | $62B |
|
||
Price history
-44.0% since first listed4 events — show timeline
- 2026-04-17 Price Changed $69,999 HAR
- 2026-04-10 Price Changed $78,000 HAR
- 2026-03-10 Price Changed $90,000 HAR
- 2026-01-08 Listed $125,000 HAR
Cash-flow waterfall
monthlySold comps — $/sqft
last 12 mo · ≤1 miLoading sold comps…