 🔨 Auction
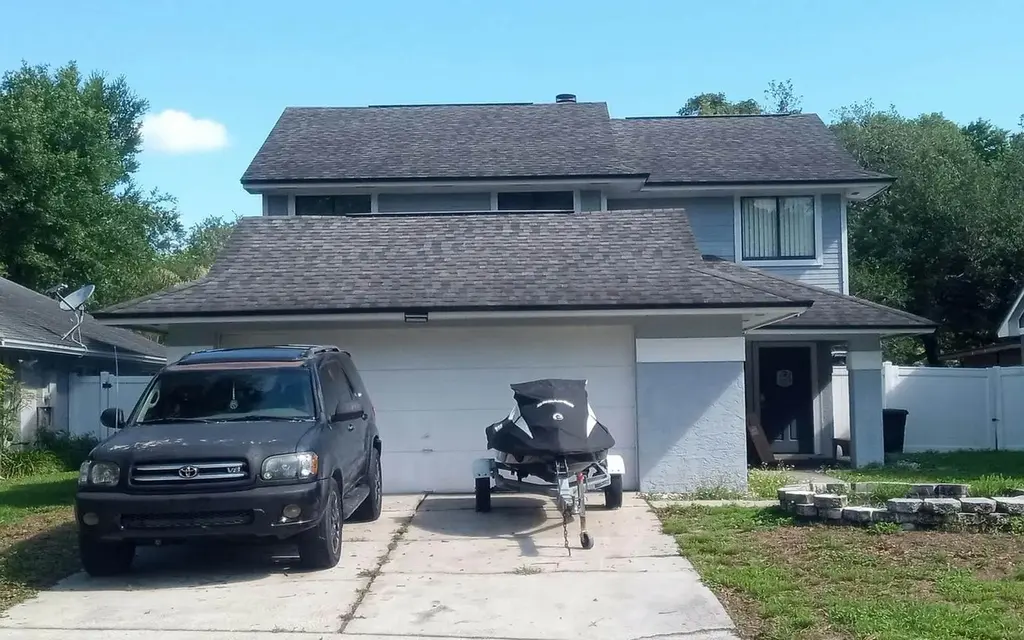
3692 Okeechobee Cir · Winter Springs, FL
Flood risk 1/10 · Minimal
- FEMA flood zone
- X (unshaded)
- Chance of flooding over 30 yrs
- 0.0%
- Est. flood insurance / yr
- $507 – $1,088
Fire risk 1/10 · Minimal
- Est. fire insurance / yr
- $947 – $1,759
Heat risk 9/10 · Severe
- Hot days now (above 108°F)
- 7 days/yr
- Hot days in 30 yrs
- 22 days/yr
Wind risk 9/10 · Severe
- Chance of severe wind over 30 yrs
- 99.0%
Air-quality risk 2/10 · Minimal
- Unhealthy air days now
- 1 days/yr
- Unhealthy air days in 30 yrs
- 2 days/yr
Risk factors via First Street. Map © Google.
Why this score? — see what drove the F grade
The composite is a weighted blend of 9 inputs, each scored 0–100. Each bar is that input's sub-score; the figure is the points it added to the 100-point composite (weight × sub-score).
- ARV discount +7.5/15.0
- Cash flow +5.5/30.0
- Schools +5.1/10.0
- Livability +3.8/5.0
- Rent growth +3.0/5.0
- Condition / age +2.5/5.0
- 1% rule +1.0/10.0
- DSCR +0.0/10.0
- Appreciation +0.0/10.0
$5,000
🖨 Deal sheet 📄 Offer letter ✓ Due diligence
Listing remarks
Foreclosure Auction Ends June 2, 2026 at 11:00 AM EST. Explore this charming 3-bedroom, 2-bath residence set in a peaceful and well-located Casselberry community. The list price is the opening bid for the online auction. Sold As-is. Explore more details and submit your bid through Federa.
Key facts
- 2 garage spots
- Listed 6 days
Property features AI
Exterior
- Parking: 2-car garage
- Home design: Residential property
- Exterior features: Lot approximately 0.17 acres; Planned Development (PD) zoning; Directions: Red Bug Lake Rd to N on Dodd, L on St Lucie, R on Okeechobee to property
Interior
- Bathrooms: 2 full bathrooms
- Interior features: One-story layout
Neighborhood map
What this means for you Summary
Snapshot
- This is a 3-bed/2.0-bath single-family listed at $5k.
Deal economics
- At list price, monthly cash flow is $-895 ($-11k/yr) — negative.
- The deal already cash-flows at list — no discount required.
- Meets the 1% rule at list price ($3k rent vs $5k).
Location & tenants
- Location reads 75/100 on livability (#261 in FL, #4,187 nationally) — a middle-class / working-renter tenant base. Strengths: crime A+, housing A+, health & safety A+; Watch: amenities F, commute F.
- Seminole (suburban): math 57% / reading 61% proficiency, ranked #13 of 73 in FL (top 18%) — acceptable for families but not a draw, mixed tenant base, ~2y average lease.
- Market conditions: Rents rising (+2.1%/yr); 186 active listings in the ZIP; 13 comparable units currently listed for rent nearby; rentals at typical pace (median 21d on market — plan ~3-4 weeks tenant-placement turnaround); 1,979 units permitted in Seminole County in 2024 (1,191 in 5+ unit buildings).
- This rent runs 44% of the median local income ($69k/yr) — at the standard rent-burdened threshold; future hikes will face affordability resistance.
Forward outlook
- Local home prices are declining (-3.0%/yr); year-one equity from $3k of loan paydown is wiped out by about $13k of value loss. Plan a longer hold.
- Seminole County population projected at +24% by 2050 — long-run rental-demand tailwind backs the buy-and-hold thesis.
Negotiation context
- Only 6 days on market — expect competitive offers; lowballing is unlikely to land.
- 10 sale attempts since 20y ago with the ask held roughly flat each time — persistent listings suggest the price (not the market) is what's stuck; bring a comps-based counter.
Risks & watch-outs
- Watch-outs: property tax is 125.7% of price.
- Climate carrying-cost: severe wind risk, 99% chance of damaging wind over 30y; extreme-heat days projected 7→22/yr by 2055 (HVAC capex compounding) — expect insurance premiums to compound above CPI over the hold.
Questions for the listing agent
- What do current leases actually rent for vs. the listed asking? Can we see a recent rent roll and the last 12 months of T-12 income?
- Property tax is high relative to price — has the assessment been appealed recently, and will the sale trigger a re-assessment?
- Is there a deadline driving the sale (1031 exchange, divorce, estate, relocation)? That informs how much negotiation room exists.
- Schools are A-rated — typically a magnet for longer-tenancy family renters. What's the average tenant stay here, and is there a school-zone premium baked into asking?
- The area grade is low — what's the realistic commute time and amenity access for the typical tenant pool here? Any planned neighborhood developments (good or bad) we should know about?
- What's the average days-on-market for RENTAL listings here right now (not sales)? A rising rental-DOM trend means longer vacancies and softer asking-rent achievability than the comps imply.
- What's the recent tenant-quality profile in this submarket — average credit score on applications, eviction rate, late-payment / NSF rate, and stable-employment percentage? A property-management company in the area should have these aggregated.
- How much new for-sale + rental construction is in the pipeline within 1–3 miles? Heavy new supply typically softens prices + rents 12–24 months out; constrained supply supports both.
Investment metrics
- 1% rule
- 0.60% ✗
- Cap rate
- 3.73%
- Cash-on-cash
- -9.15%
- DSCR
- 0.59
- GRM
- 13.8
CMA / ARV
- ARV (on-the-fly)
- $419,100
- Comps found
- 12
Show comp detail 12 sales within ~0.75 mi
| Address | Dist | Beds/Ba | Sqft | Sold | Price | $/sf | Match |
|---|---|---|---|---|---|---|---|
| 887 Reedy Cv | 0.13mi | 3/2.5 | 1,591 (-4%) | 8mo | $385,000 | $242 | 79 |
| 3799 Sutters Mill Cir | 0.45mi | 4/2.0 (+1) | 1,683 (+2%) | 4mo | $394,000 | $234 | 68 |
| 427 Hornbill Pl | 0.27mi | 4/2.5 (+1) | 1,778 (+8%) | 2mo | $490,000 | $276 | 65 |
| 3605 S Saint Lucie Dr | 0.14mi | 2/2.0 (-1) | 1,431 (-13%) | 10mo | $326,400 | $228 | 58 |
| 1057 Nodding Pines Way | 0.60mi | 3/2.0 | 1,775 (+8%) | 4mo | $450,000 | $254 | 56 |
| 904 Wesson Dr | 0.73mi | 3/2.0 | 1,609 (-2%) | 8mo | $430,000 | $267 | 55 |
| 640 Tuskawilla Point Ln | 0.61mi | 3/2.0 | 1,794 (+9%) | 4mo | $505,000 | $281 | 54 |
| 3742 Sutters Mill Cir | 0.64mi | 3/2.0 | 1,528 (-7%) | 6mo | $465,000 | $304 | 53 |
| 1073 Nodding Pines Way | 0.67mi | 2/2.0 (-1) | 1,784 (+8%) | 0mo | $370,000 | $207 | 50 |
| 212 Hound Run Pl | 0.69mi | 3/2.0 | 1,796 (+9%) | 9mo | $375,000 | $209 | 46 |
| 841 Wesson Ct | 0.60mi | 4/2.0 (+1) | 1,797 (+9%) | 10mo | $440,000 | $245 | 44 |
| 1017 Chesterfield Cir | 0.67mi | 3/3.0 | 1,882 (+14%) | 2mo | $535,000 | $284 | 40 |
Match score weights: distance 35% · size 25% · config 20% · recency 20%. Top-matched comps best support the ARV.
Projected returns pro-forma
-3.0% appreciation · 2.09% rent growth · sell at horizon
- IRR
- -33.6%
- Equity multiple
- -0.08×
- Total profit
- $-127,149
- Equity at exit
- $62,489
- IRR
- -47.2%
- Equity multiple
- -0.65×
- Total profit
- $-193,192
- Equity at exit
- $36,236
Cash invested: $117,348 (down + closing). Projections, not guarantees.
Landlord ↔ Tenant lean methodology
- Overall (STATE)
- 87 Strongly Landlord-Friendly
- State Florida
- 87 Strongly Landlord-Friendly · R+3
- County
- — inherits STATE
- City
- — inherits STATE
ZIP-level market 32707
- Rents YoY
- 2.1%
- Active inventory
- 186
- Price-to-rent
- 0.2×
Monthly cashflow live
- Estimated rent
- $2,534 high interval (Pro) →
- Mortgage (P&I)
- −$2,198
- Tax est. 1.5%
- −$524 /mo · $6,286/yr
- Insurance
- −$175
- HOA
- −$0
- Vacancy / Maint / Mgmt
- −$532
- Net cashflow
- $-895
Break-even live
UW: 25.0% down · 7.5% · 30yr · 1.5% tax · 5.0% vac · 8.0% maint · 8.0% mgmt
Financing live
Cash to close
- Down payment
- $104,775
- Closing costs
- $12,573
- Reserves months
- —
- Total cash needed
- —
Loan-product check · same deal, 3 products live
Conventional
25% down · 7.5% · 30yr
- Down + closing
- —
- Monthly P&I
- —
- Monthly cashflow
- —
- DSCR
- —
- Eligible?
- —
Personal DTI + credit; lowest rate.
DSCR
20% down · 8.5% · 30yr
- Down + closing
- —
- Monthly P&I
- —
- Monthly cashflow
- —
- DSCR
- —
- Eligible?
- —
No personal income docs; deal must DSCR.
Hard money
10% down · 12.0% · 12mo
- Down + closing
- —
- Monthly P&I
- —
- Monthly cashflow
- —
- DSCR
- —
- Eligible?
- —
Short-term bridge; refi at stabilization.
Rent comps 13 comps
| Address | Beds | Baths | Sqft | Rent | $/sqft | DOM | Units | Dist |
|---|---|---|---|---|---|---|---|---|
| 3747 Okeechobee Cir Casselberry, FL | 3.0 | 2.5 | 1591 | $2,600 | $1.63 | 24d | 1 | 0.09mi |
| 541 Moccasin Ct Casselberry, FL | 2.0 | 2.0 | 1208 | $2,095 | $1.73 | 24d | 1 | 0.36mi |
| 780 Ortona Ct Winter Springs, FL | 4.0 | 2.0 | 1966 | $2,700 | $1.37 | 5d | 1 | 0.38mi |
| 990 English Town Ln Winter Springs, FL | 1.0–3.0 | 1.0–2.0 | 990 | $2,559 | $2.58 | 2d | 15 | 0.45mi |
| 1020 Chatham Pines Cir Winter Springs, FL | 1.0–3.0 | 1.0–2.0 | 865 | $2,121 | $2.45 | 2d | 12 | 0.58mi |
| 1542 Sugarwood Cir Winter Park, FL | 4.0 | 3.0 | 2130 | $3,900 | $1.83 | 24d | 1 | 0.93mi |
| 1239 La Mesa Ave Winter Springs, FL | 3.0 | 2.0 | 1255 | $2,079 | $1.66 | 3d | 1 | 1.28mi |
| 1448 La Paloma Cir Winter Springs, FL | 3.0 | 2.0 | 1407 | $2,120 | $1.51 | 20d | 1 | 1.30mi |
| 1445 Bird Rd Winter Springs, FL | 3.0 | 2.0 | 1500 | $2,500 | $1.67 | 24d | 1 | 1.38mi |
| 1843 Shadyhill Ter Winter Park, FL | 4.0 | 2.5 | 1891 | $3,300 | $1.75 | 24d | 1 | 1.38mi |
| 986 Rollingwood Loop Casselberry, FL | 2.0 | 1.0–2.0 | 669 | $1,880 | $2.81 | 24d | 15 | 1.42mi |
| 2982 Embassy Ct Casselberry, FL | 2.0 | 2.5 | 1238 | $1,895 | $1.53 | 18d | 1 | 1.45mi |
| 2982 Embassy Ct Casselberry, FL | 2.0 | 2.5 | 1238 | $1,895 | $1.53 | 2d | 1 | 1.45mi |
Listing history 34 events
-
2026-06-01days on market $5,000 Active 6 DOM
-
2026-05-31days on market $5,000 Active 5 DOM
-
2026-05-26$5,000 Active
-
2025-06-25status Pending
-
2025-06-20historical
-
2025-04-14status Active
-
2025-03-27status Pending
-
2025-02-18price $389,000
-
2025-01-01$399,000 Active
-
2024-12-11historical
-
2024-11-19price $394,000
-
2024-10-23price $395,000
-
2024-09-10price $399,000
-
2024-09-05price $410,000
-
2024-07-22price $415,000
-
2024-06-23price $495,000
-
2024-06-07$499,990 Active
-
2006-09-20soldstatus $258,000
-
2006-09-14soldstatus $258,000
-
2006-07-13$258,900
-
2006-07-13historical
-
2006-06-08$267,900
-
2006-06-08historical
-
2006-05-06$274,900
-
2006-05-06historical
-
2006-04-22$269,900
-
2006-04-22historical
-
2006-02-11$269,900
-
2006-02-11$279,900
-
2006-02-11historical
-
2002-06-04soldstatus $131,500
-
1997-09-02soldstatus $99,900
-
1996-03-07soldstatus $95,000
-
1991-11-01soldstatus $92,500
ⓘ Source: listings_history table (triggers on properties + properties_extension) + one-shot
backfill from property_details.listing_events for pre-trigger history.
Climate risk First Street
- Flood 1/10 Low FEMA zone X (unshaded) · 0% chance over 30 yrs
- Wildfire 1/10 Low
- Heat 9/10 Extreme 7 d/yr ≥108°F today · 22 d/yr by 30 yrs out
- Wind 9/10 Extreme 99% chance of damaging wind over 30 yrs
- Air quality 2/10 Low 1 unhealthy d/yr today · 2 by 30 yrs out
Nearby sold comps map
Loading sold comps map…
Walkable amenities ~0.75 mi
Loading nearby amenities…
Taxation est. · year 1
- Rental income
- $30,406
- − Mortgage interest
- −$23,476
- − Property taxes
- −$6,286
- − Insurance
- −$2,096
- − Repairs & maintenance
- −$2,432
- − Management
- −$2,432
- − Depreciation
- −$12,192
- Taxable loss
- −$18,509
- Est. tax savings @ 24.0%
- +$4,442
- After-tax cash flow
- $-6,293/yr
For passive investors: Depreciation is non-cash, so a rental often shows a tax loss while cash-flowing — sheltering income. Rental losses are passive: they offset passive income freely, and up to $25,000/yr can offset ordinary (W-2) income if you actively participate and your MAGI is under $100k (phasing out to $0 by $150k); unused losses carry forward. On sale, claimed depreciation is recaptured at up to 25%, and gains may owe capital-gains tax (a 1031 exchange can defer both). Figures are a year-1 estimate at your 24.0% rate — not tax advice; consult a CPA.
Schools (NCES district)
- District
- Seminole
- NCES district ID
- 1201710
- Math proficiency
- 57% ▼ -7.00%
- Reading proficiency
- 61% ▼ -1.00%
- Median HH income
- $58,478
- Composite
- 51.05/100
- National rank
- #1769
- State rank
- #13 of 73 in FL
Livability — Winter Springs
- Score
- 75/100
- State rank
- #261
- US rank
- #4187
Category grades
Schools grade is shown separately in the Schools card above.
Census & demographics
- County
- Seminole County · 436,154 people
- City population
- 48,965
- Metro
- Orlando-Kissimmee-Sanford, FL
- Population (ZIP)
- 39,493
- Household income
- $69,113
- Rent vs Own
- Severe rent burden
- 1482.0
Population outlook (Seminole County) Hauer SSP2
- Today (2025)
- 515,494 people
- By 2030
- 545,713 · +5.9%
- By 2040
- 598,068 · +16.0%
- By 2050
- 640,663 · +24.3%
- By 2075
- 724,461 · +40.5%
- By 2100
- 755,530 · +46.6%
Race, ethnicity, and origin ACS 2023
- Neighborhood character
- Diverse neighborhood (Simpson 0.61)
- Race & ethnicity
- White 56% Hispanic / Latino 27% Two or more races 14% Black 10% Asian 4%
- Hispanic origin (detail)
- Mexican 3% Puerto Rican 12% Cuban 4% Dominican 2%
- Common ancestry
- Hispanic 3% Romanian 2% Lithuanian 2%
- Foreign-born
- 15% · Canada, Jamaica, China
- Languages at home
- 76% English-only · Spanish 18% French/Haitian/Cajun 2% Other Indo-European 1%
Political lean MEDSL · Seminole
- 2024 margin
- Toss-up / Even · D 47.6% · R 51.1% · Other 1.3%
- 2008→2024 swing
- -0.8pp no change · 2008: -2.8pp · 2024: -3.5pp
- All cycles
- 2024: R+3.5 2020: D+2.8 2016: R+1.6 2012: R+6.5 2008: R+2.8
Not yet ingested
- Civics
- —
Market trends
- HPI YoY
- ▼ -251.90%
- Current HPI
- 342.1006
- Rent YoY
- ▲ 2.09%
- Metro
- Orlando-Kissimmee-Sanford, FL
- State GDP YoY
- ▲ 3.28%
- F500 in state
- 36
Industry mix (Fortune 500 HQ in FL)
| Industry | F500 HQs | Revenue |
|---|---|---|
| Industrial Technology | 2 | $29B |
|
||
| Insurance | 2 | $17B |
|
||
| Retail | 1 | $60B |
|
||
| Technology Distribution | 1 | $58B |
|
||
| Homebuilding | 1 | $35B |
|
||
| Technology Manufacturing | 1 | $35B |
|
||
Price history
-94.6% since first listed32 events — show timeline
- 2026-05-26 Listed $5,000 NFMLS
- 2025-06-25 Pending — Stellar MLS as Distributed by MLS Grid
- 2025-06-20 Listing Removed — Stellar MLS as Distributed by MLS Grid
- 2025-04-14 Relisted — Stellar MLS as Distributed by MLS Grid
- 2025-03-27 Pending — Stellar MLS as Distributed by MLS Grid
- 2025-02-18 Price Changed $389,000 Stellar MLS as Distributed by MLS Grid
- 2025-01-01 Listed $399,000 Stellar MLS as Distributed by MLS Grid
- 2024-12-11 Listing Removed — Stellar MLS as Distributed by MLS Grid
- 2024-11-19 Price Changed $394,000 Stellar MLS as Distributed by MLS Grid
- 2024-10-23 Price Changed $395,000 Stellar MLS as Distributed by MLS Grid
- 2024-09-10 Price Changed $399,000 Stellar MLS as Distributed by MLS Grid
- 2024-09-05 Price Changed $410,000 Stellar MLS as Distributed by MLS Grid
- 2024-07-22 Price Changed $415,000 Stellar MLS as Distributed by MLS Grid
- 2024-06-23 Price Changed $495,000 Stellar MLS as Distributed by MLS Grid
- 2024-06-07 Listed $499,990 Stellar MLS as Distributed by MLS Grid
- 2006-09-20 Sold (Public Records) $258,000 Public Records
- 2006-09-14 Sold (MLS) $258,000 Stellar MLS as Distributed by MLS Grid
- 2006-07-13 Listing Removed — Stellar MLS as Distributed by MLS Grid
- 2006-07-13 Listed $258,900 Stellar MLS as Distributed by MLS Grid
- 2006-06-08 Listing Removed — Stellar MLS as Distributed by MLS Grid
- 2006-06-08 Listed $267,900 Stellar MLS as Distributed by MLS Grid
- 2006-05-06 Listing Removed — Stellar MLS as Distributed by MLS Grid
- 2006-05-06 Listed $274,900 Stellar MLS as Distributed by MLS Grid
- 2006-04-22 Listing Removed — Stellar MLS as Distributed by MLS Grid
- 2006-04-22 Listed $269,900 Stellar MLS as Distributed by MLS Grid
- 2006-02-11 Listing Removed — Stellar MLS as Distributed by MLS Grid
- 2006-02-11 Listed $279,900 Stellar MLS as Distributed by MLS Grid
- 2006-02-11 Listed $269,900 Stellar MLS as Distributed by MLS Grid
- 2002-06-04 Sold (Public Records) $131,500 Public Records
- 1997-09-02 Sold (Public Records) $99,900 Public Records
- 1996-03-07 Sold (Public Records) $95,000 Public Records
- 1991-11-01 Sold (Public Records) $92,500 Public Records
Property tax history
+10.5%/yrLatest (2025): $4,135 · -1.4% YoY. Source: county tax records.
Cash-flow waterfall
monthlySold comps — $/sqft
last 12 mo · ≤1 miLoading sold comps…