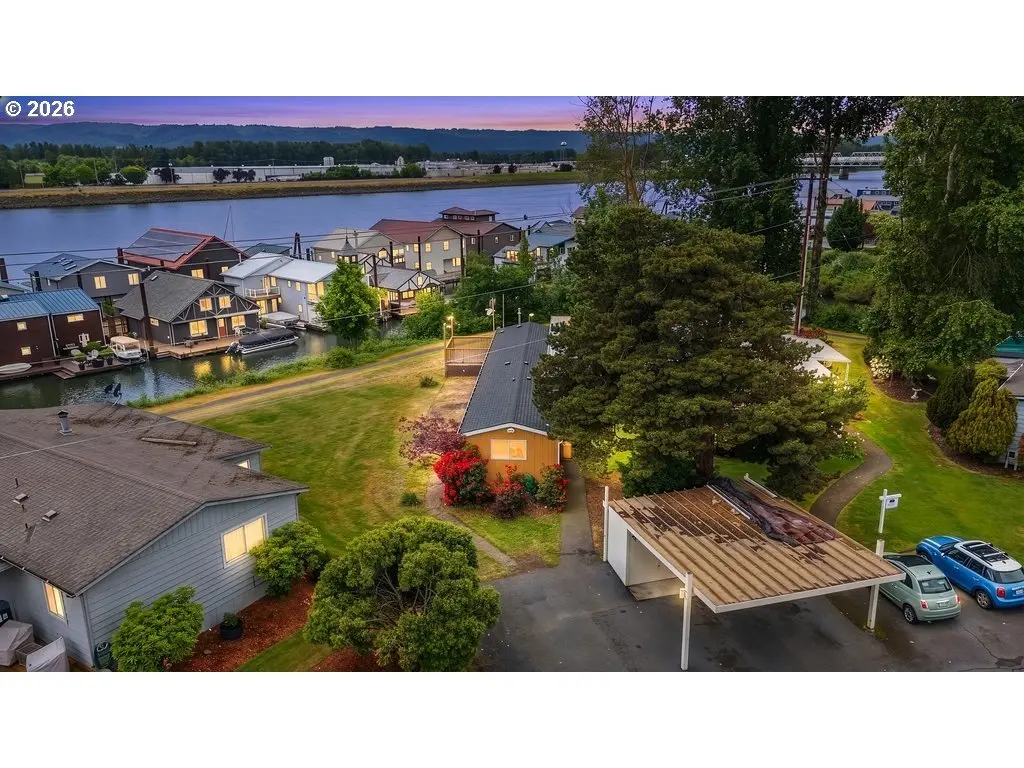
12261 N Westshore Dr · Portland, OR
Flood risk 8/10 · Major
- FEMA flood zone
- X (unshaded)
- Chance of flooding over 30 yrs
- 0.77%
- Est. flood insurance / yr
- $507 – $1,088
Fire risk 1/10 · Minimal
- Est. fire insurance / yr
- $498 – $926
Heat risk 3/10 · Minor
- Hot days now (above 92°F)
- 7 days/yr
- Hot days in 30 yrs
- 14 days/yr
Wind risk 1/10 · Minimal
- Chance of severe wind over 30 yrs
- —
Air-quality risk 10/10 · Severe
- Unhealthy air days now
- 19 days/yr
- Unhealthy air days in 30 yrs
- 20 days/yr
Risk factors via First Street. Map © Google.
Why this score? — see what drove the C- grade
The composite is a weighted blend of 9 inputs, each scored 0–100. Each bar is that input's sub-score; the figure is the points it added to the 100-point composite (weight × sub-score).
- Cash flow +15.0/30.0
- ARV discount +15.0/15.0
- 1% rule +5.0/10.0
- DSCR +5.0/10.0
- Schools +4.7/10.0
- Livability +3.9/5.0
- Rent growth +2.7/5.0
- Condition / age +2.5/5.0
- Appreciation +0.0/10.0
$38,000
🖨 Deal sheet 📄 Offer letter ✓ Due diligence
Listing remarks MLS
1983 SILVERCREST SIN-WDE/WATERFRONT DEFINITEY THE NICEST IN THE PARK. DISTINCTIVE UPGADES INCLUDE WOOD TRIM,LIGHTING,FORMICA.MIRRORED CLOSETS, COVERED DECK IMPECABLE LANDSCAPE **CALL DAVE BAKER@(503) 283-4854
Key facts
- Large deck
- Waterfront views
- Access to 3 pools
Tags
Property features AI
Finance
- Other: Property is a resale; Main living area approximately 924
- Financial info: Monthly lot rent: $1,469; Land lease expires May 13, 2028
- HOA & community: Community amenities include gym, pool, party room, managed grounds, and on-site management; Located in the Hayden Island park community; Land lease in place (monthly lot rent)
Exterior
- Parking: Carport (1 space)
- Utilities: Public water; Public sewer; Propane fuel
- Home design: Manufactured home in a park; Residential property; Single-story (main living on main level); Built in 1983; View of river and trees
- Construction: Shingle roof; T-111 siding; Crawl space foundation; Built in 1983
- Exterior features: Deck; Level lot; Riverfront view with trees/woods
Interior
- Kitchen: Free-standing refrigerator; Stainless steel appliances; Tile (kitchen area)
- Bedrooms: Primary bedroom on the main level; Second bedroom on the main level
- Flooring: Vinyl; Carpet; Tile
- Bathrooms: One full bathroom (main level)
- Heating & cooling: Forced air heating (propane); Central air conditioning; Propane hot water
- Interior features: Ceiling fans; Vinyl flooring; Wall-to-wall carpet; Double-pane windows; Crawl space basement
Neighborhood map
What this means for you Summary
Snapshot
- This is a 2-bed/2.0-bath manufactured listed at $38k.
Deal economics
- At list price, monthly cash flow is $2k ($22k/yr) — positive.
- The deal already cash-flows at list — no discount required.
- Meets the 1% rule at list price ($3k rent vs $38k).
- Cap rate 67.3% vs local median 2.2% in Portland — top-decile yield for the area; either an underpriced asset or a hidden risk that comps aren't pricing in. Stress-test before assuming the spread holds.
Location & tenants
- Location reads 77/100 on livability (#72 in OR, #3,256 nationally) — a middle-class / working-renter tenant base. Strengths: amenities A+, commute A+, health & safety A+; Watch: crime F, cost of living F.
- Portland SD 1J (urban): math 46% / reading 58% proficiency, ranked #23 of 183 in OR (top 13%) — acceptable for families but not a draw, mixed tenant base, ~2y average lease.
- Zoned schools: Faubion Elementary School (610 students, 73% FRL); Jefferson High School (606 students, 64% FRL) — zoned schools average 69% FRL vs 37% district-wide (32 pts higher); higher-poverty schools than district average — tighter screening recommended.
- Market conditions: Rents flat; 298 active listings in the ZIP; 20 comparable units currently listed for rent nearby; rentals leasing fast (median 2d on market — plan ~1-2 weeks tenant-placement turnaround); solid renter incomes; 2,041 units permitted in Multnomah County in 2024 (905 in 5+ unit buildings).
- This rent runs 33% of the median local income ($100k/yr) — at the standard rent-burdened threshold; future hikes will face affordability resistance.
Forward outlook
- Local home prices are declining (-3.0%/yr); year-one equity from $263 of loan paydown is wiped out by about $1k of value loss. Plan a longer hold.
- Multnomah County population projected at +33% by 2050 — long-run rental-demand tailwind backs the buy-and-hold thesis.
- At projected returns (-3.0% appreciation + 0.9% rent growth), your $11k cash investment doubles in ~1 year — after that, you're playing with house money.
Negotiation context
- Only 14 days on market — expect competitive offers; lowballing is unlikely to land.
- 2 sale attempts since 27y ago; this cycle's ask has dropped $7k (16%) from the opening price — seller is motivated, your offer sets the floor, not the list.
- Current owner paid $17k; list at $38k implies a 124% gain — meaningful room to come down on a strong offer.
Risks & watch-outs
- Watch-outs: flood insurance adds $66/mo.
- Climate carrying-cost: severe flood risk — expect insurance premiums to compound above CPI over the hold.
Questions for the listing agent
- What's the actual annual flood-insurance premium (NFIP or private), and is the property in a SFHA with mandatory coverage?
- Is there a deadline driving the sale (1031 exchange, divorce, estate, relocation)? That informs how much negotiation room exists.
- Crime grade is F in this area — have there been break-ins, vandalism, or insurance claims at this property in the last 3 years? What carrier currently insures it and at what premium?
- What's the average days-on-market for RENTAL listings here right now (not sales)? A rising rental-DOM trend means longer vacancies and softer asking-rent achievability than the comps imply.
- What's the recent tenant-quality profile in this submarket — average credit score on applications, eviction rate, late-payment / NSF rate, and stable-employment percentage? A property-management company in the area should have these aggregated.
- How much new for-sale + rental construction is in the pipeline within 1–3 miles? Heavy new supply typically softens prices + rents 12–24 months out; constrained supply supports both.
Investment metrics
- 1% rule
- 7.26% ✓
- Cap rate
- 67.29%
- Cash-on-cash
- 217.85%
- DSCR
- 10.69
- GRM
- 1.1
CMA / ARV
- ARV (on-the-fly)
- $47,124
- Comps found
- 2
Show comp detail 2 sales within ~0.75 mi
| Address | Dist | Beds/Ba | Sqft | Sold | Price | $/sf | Match |
|---|---|---|---|---|---|---|---|
| 12261 N Westshore Dr | 0.00mi | 2/1.0 | 924 (0%) | 0mo | $33,000 | $36 | 96 |
| 12405 N South Shore Ave | 0.08mi | 2/2.0 | 924 (0%) | 15mo | $46,999 | $51 | 84 |
Match score weights: distance 35% · size 25% · config 20% · recency 20%. Top-matched comps best support the ARV.
Projected returns pro-forma
-3.0% appreciation · 0.89% rent growth · sell at horizon
- IRR
- —
- Equity multiple
- 11.05×
- Total profit
- $106,969
- Equity at exit
- $5,666
- IRR
- —
- Equity multiple
- 22.04×
- Total profit
- $223,835
- Equity at exit
- $3,286
Cash invested: $10,640 (down + closing). Projections, not guarantees.
Landlord ↔ Tenant lean methodology
- Overall (CITY)
- 0 Strongly Tenant-Friendly
- State Oregon
- 28 Tenant-Leaning · D+6
- County
- — inherits STATE
- City Portland
- 0 Strongly Tenant-Friendly · D+39
ZIP-level market 97217
- Rents YoY
- 0.9%
- Active inventory
- 298
- Price-to-rent
- 1.1×
Monthly cashflow live
- Estimated rent
- $2,761 high interval (Pro) →
- Mortgage (P&I)
- −$199
- Tax from tax record
- −$34 /mo · $410/yr
- Insurance
- −$16
- Flood insurance flood zone
- −$66 /mo · $798/yr
- HOA
- −$0
- Vacancy / Maint / Mgmt
- −$580
- Net cashflow
- $1,865
Break-even live
UW: 25.0% down · 7.5% · 30yr · 1.5% tax · 5.0% vac · 8.0% maint · 8.0% mgmt
Financing live
Cash to close
- Down payment
- $9,500
- Closing costs
- $1,140
- Reserves months
- —
- Total cash needed
- —
Loan-product check · same deal, 3 products live
Conventional
25% down · 7.5% · 30yr
- Down + closing
- —
- Monthly P&I
- —
- Monthly cashflow
- —
- DSCR
- —
- Eligible?
- —
Personal DTI + credit; lowest rate.
DSCR
20% down · 8.5% · 30yr
- Down + closing
- —
- Monthly P&I
- —
- Monthly cashflow
- —
- DSCR
- —
- Eligible?
- —
No personal income docs; deal must DSCR.
Hard money
10% down · 12.0% · 12mo
- Down + closing
- —
- Monthly P&I
- —
- Monthly cashflow
- —
- DSCR
- —
- Eligible?
- —
Short-term bridge; refi at stabilization.
Rent comps 20 comps
| Address | Beds | Baths | Sqft | Rent | $/sqft | DOM | Units | Dist |
|---|---|---|---|---|---|---|---|---|
| 1245 N Anchor Way Portland, OR | 2.0 | 1.0–2.0 | 856 | $2,250 | $2.63 | 1d | 16 | 0.82mi |
| 1055 N Anchor Way Portland, OR | 1.0–2.0 | 1.0–2.0 | 1056 | $3,150 | $2.98 | 1d | 34 | 0.92mi |
| 1111 W Columbia Way Vancouver, WA | 2.0 | 1.0–2.5 | 857 | $4,800 | $5.60 | 1d | 28 | 0.95mi |
| 111 Parkway Pl Vancouver, WA | 1.0–2.0 | 1.0–2.0 | 983 | $4,995 | $5.08 | 1d | 3 | 0.98mi |
| 1110 W Columbia Way Vancouver, WA | 2.0 | 1.0–2.0 | 783 | $3,849 | $4.91 | 1d | 13 | 0.98mi |
| 1000 W Columbia Way Vancouver, WA | 1.0–2.0 | 1.0–2.0 | 767 | $3,282 | $4.28 | 1d | 11 | 1.02mi |
| 440 W Columbia Way Vancouver, WA | 2.0 | 1.0–2.0 | 863 | $4,400 | $5.10 | 1d | 150 | 1.04mi |
| 500 W Columbia Way Vancouver, WA | 2.0 | 1.0–2.0 | 849 | $3,995 | $4.71 | 1d | 6 | 1.04mi |
| 995 N Marine Dr Portland, OR | 2.0 | 1.0–2.0 | 924 | $2,036 | $2.20 | 2d | 11 | 1.04mi |
| 183 N Hayden Bay Dr Portland, OR | 1.0 | 1.0 | 858 | $1,800 | $2.10 | 43d | 1 | 1.07mi |
| 123 N Hayden Bay Dr Portland, OR | 2.0 | 1.0 | 889 | $2,249 | $2.53 | 43d | 1 | 1.11mi |
| 636 W 6th St Vancouver, WA | 1.0–2.0 | 1.0 | 723 | $2,349 | $3.25 | 1d | 8 | 1.14mi |
| 411 Columbia St Vancouver, WA | 2.0 | 1.0–2.0 | 818 | $3,377 | $4.13 | 1d | 14 | 1.19mi |
| 555 W 8th St Vancouver, WA | 1.0–2.0 | 1.0 | 695 | $1,630 | $2.35 | 1d | 11 | 1.20mi |
| 608 Washington St Vancouver, WA | 2.0 | 1.0–2.0 | 903 | $3,236 | $3.58 | 1d | 11 | 1.29mi |
| 300 W 8th St Vancouver, WA | 1.0–2.0 | 1.0–2.0 | 915 | $2,932 | $3.20 | 1d | 1 | 1.31mi |
| 110 N Tomahawk Island Dr Portland, OR | 1.0–2.0 | 1.0–2.0 | 994 | $2,674 | $2.69 | 1d | 27 | 1.32mi |
| 701 Columbia St #107 Vancouver, WA | 2.0 | 2.0 | 871 | $1,995 | $2.29 | 23d | 1 | 1.32mi |
| 209 W Evergreen Blvd Vancouver, WA | 2.0 | 1.0 | 1048 | $2,765 | $2.64 | 4d | 1 | 1.39mi |
| 1414 Markle Ave Unit 101 Vancouver, WA | 1.0 | 1.0 | 588 | $1,369 | $2.33 | 23d | 1 | 1.42mi |
Listing history 6 events
-
2026-06-02status $38,000 Pending 14 DOM
-
2026-06-01days on market $38,000 Active 14 DOM
-
2026-05-31days on market $38,000 Active 13 DOM
-
2026-05-18$45,000 Active
-
1999-09-13soldstatus $17,000 208-char remark
Show marketing remark (208 chars)
1983 SILVERCREST SIN-WDE/WATERFRONT DEFINITEY THE NICEST IN THE PARK. DISTINCTIVE UPGADES INCLUDE WOOD TRIM,LIGHTING,FORMICA.MIRRORED CLOSETS, COVERED DECK IMPECABLE LANDSCAPE **CALL DAVE BAKER@(503) 283-4854
-
1999-06-16$17,000 208-char remark
Show marketing remark (208 chars)
1983 SILVERCREST SIN-WDE/WATERFRONT DEFINITEY THE NICEST IN THE PARK. DISTINCTIVE UPGADES INCLUDE WOOD TRIM,LIGHTING,FORMICA.MIRRORED CLOSETS, COVERED DECK IMPECABLE LANDSCAPE **CALL DAVE BAKER@(503) 283-4854
ⓘ Source: listings_history table (triggers on properties + properties_extension) + one-shot
backfill from property_details.listing_events for pre-trigger history.
Tax reassessment forecast OR · Resets to sale price
- Current annual tax
- $410 · $34/mo
- Projected year-2 tax
- $410 · $34/mo
- Expected delta
- $0/yr ($0/mo · 0.0%)
ⓘ Screening estimate from a state-policy table — verify with the county assessor before closing.
Climate risk First Street
- Flood 8/10 Severe FEMA zone X (unshaded) · 77% chance over 30 yrs
- Wildfire 1/10 Low
- Heat 3/10 Moderate 7 d/yr ≥92°F today · 14 d/yr by 30 yrs out
- Wind 1/10 Low
- Air quality 10/10 Extreme 19 unhealthy d/yr today · 20 by 30 yrs out
Nearby sold comps map
Loading sold comps map…
Walkable amenities ~0.75 mi
Loading nearby amenities…
Taxation est. · year 1
- Rental income
- $33,127
- − Mortgage interest
- −$2,129
- − Property taxes
- −$410
- − Insurance
- −$987
- − Repairs & maintenance
- −$2,650
- − Management
- −$2,650
- − Depreciation
- −$1,105
- Taxable income
- $23,196
- Est. tax owed @ 24.0%
- −$5,567
- After-tax cash flow
- $16,815/yr
For passive investors: Depreciation is non-cash, so a rental often shows a tax loss while cash-flowing — sheltering income. Rental losses are passive: they offset passive income freely, and up to $25,000/yr can offset ordinary (W-2) income if you actively participate and your MAGI is under $100k (phasing out to $0 by $150k); unused losses carry forward. On sale, claimed depreciation is recaptured at up to 25%, and gains may owe capital-gains tax (a 1031 exchange can defer both). Figures are a year-1 estimate at your 24.0% rate — not tax advice; consult a CPA.
Schools (NCES district)
- District
- Portland SD 1J
- NCES district ID
- 4110040
- Math proficiency
- 46% ▼ -2.00%
- Reading proficiency
- 58% ▼ -3.00%
- Median HH income
- $57,851
- Composite
- 47.1/100
- National rank
- #5112
- State rank
- #23 of 183 in OR
Livability — Portland
- Score
- 77/100
- State rank
- #72
- US rank
- #3256
Category grades
Schools grade is shown separately in the Schools card above.
Census & demographics
- Census place
- Portland, OR
- County
- Multnomah County · 786,692 people
- City population
- 774,334
- Metro
- Portland-Vancouver-Hillsboro, OR-WA
- Population (ZIP)
- 35,169
- Household income
- $100,361
- Rent vs Own
- Severe rent burden
- 1532.0
Population outlook (Multnomah County) Hauer SSP2
- Today (2025)
- 930,825 people
- By 2030
- 996,904 · +7.1%
- By 2040
- 1,121,379 · +20.5%
- By 2050
- 1,242,124 · +33.4%
- By 2075
- 1,464,431 · +57.3%
- By 2100
- 1,576,181 · +69.3%
Race, ethnicity, and origin ACS 2023
- Neighborhood character
- Predominantly White (71%)
- Race & ethnicity
- White 71% Two or more races 12% Hispanic / Latino 9% Black 7% Asian 3%
- Hispanic origin (detail)
- Mexican 5%
- Common ancestry
- Italian 5% Slovak 4% Portuguese 3%
- Foreign-born
- 8% · Canada, China, Vietnam
- Languages at home
- 90% English-only · Spanish 4% Other Indo-European 1% Chinese 1%
Political lean MEDSL · Multnomah
- 2024 margin
- Solid D (+62.1) · D 79.3% · R 17.2% · Other 3.5%
- 2008→2024 swing
- +6.0pp toward D · 2008: 56.1pp · 2024: 62.1pp
- All cycles
- 2024: D+62.1 2020: D+61.3 2016: D+58.3 2012: D+54.9 2008: D+56.1
Not yet ingested
- Civics
- —
Market trends
- HPI YoY
- ▼ -747.13%
- Current HPI
- 370.7526
- Rent YoY
- ▲ 0.89%
- Metro
- Portland-Vancouver-Hillsboro, OR-WA
- State GDP YoY
- ▲ 2.05%
- F500 in state
- 2
Industry mix (Fortune 500 HQ in OR)
| Industry | F500 HQs | Revenue |
|---|---|---|
| Consumer Goods | 1 | $51B |
|
||
Price history
+164.7% since first listed3 events — show timeline
- 2026-05-18 Listed $45,000 RMLS
- 1999-09-13 Sold (MLS) $17,000 RMLS
- 1999-06-16 Listed $17,000 RMLS
Property tax history
+2.4%/yrLatest (2016): $410 · +14.8% YoY. Source: county tax records.
Cash-flow waterfall
monthlySold comps — $/sqft
last 12 mo · ≤1 miLoading sold comps…