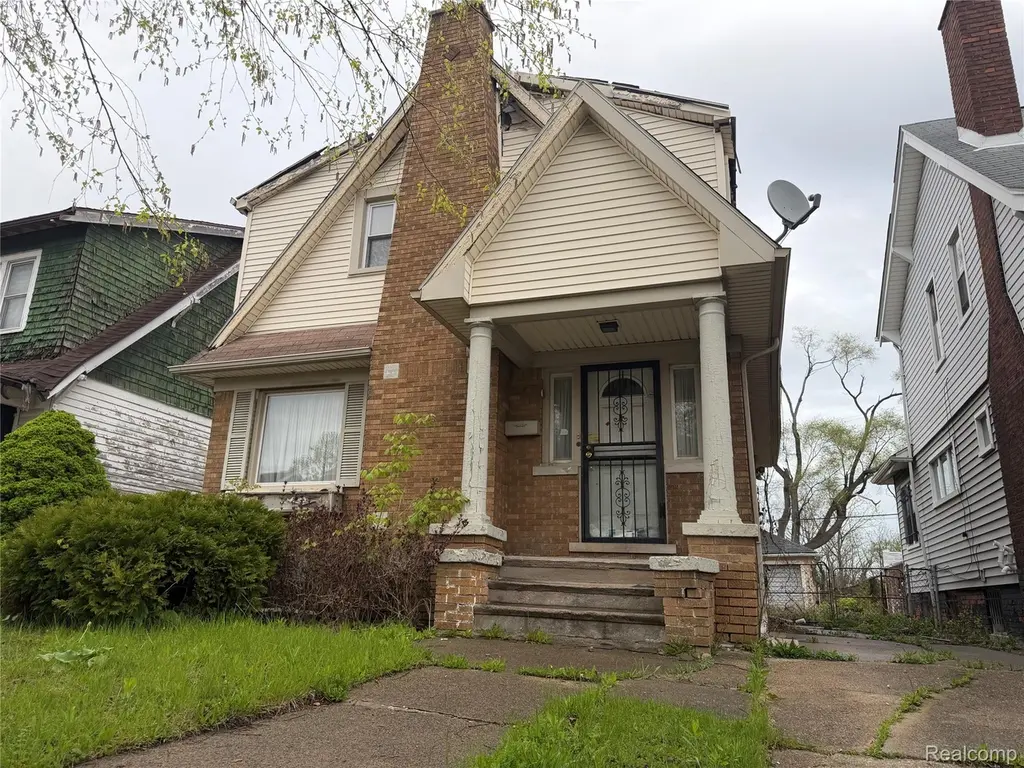
2916 Dickerson St · Detroit, MI
Flood risk 1/10 · Minimal
- FEMA flood zone
- X (unshaded)
- Chance of flooding over 30 yrs
- 0.0%
- Est. flood insurance / yr
- $473 – $860
Fire risk 1/10 · Minimal
- Est. fire insurance / yr
- $784 – $1,456
Heat risk 3/10 · Minor
- Hot days now (above 96°F)
- 7 days/yr
- Hot days in 30 yrs
- 15 days/yr
Wind risk 2/10 · Minimal
- Chance of severe wind over 30 yrs
- —
Air-quality risk 3/10 · Minor
- Unhealthy air days now
- 2 days/yr
- Unhealthy air days in 30 yrs
- 5 days/yr
Risk factors via First Street. Map © Google.
Why this score? — see what drove the D grade
The composite is a weighted blend of 9 inputs, each scored 0–100. Each bar is that input's sub-score; the figure is the points it added to the 100-point composite (weight × sub-score).
- Cash flow +15.0/30.0
- ARV discount +7.5/15.0
- 1% rule +5.0/10.0
- DSCR +5.0/10.0
- Livability +3.7/5.0
- Rent growth +2.5/5.0
- Condition / age +2.5/5.0
- Schools +1.3/10.0
- Appreciation +0.0/10.0
$16,000
🖨 Deal sheet (PDF) 📄 Offer letter ✓ Due diligence
Listing remarks MLS
2916 Dickerson Detroit MI 48215 Located near the desirable Jefferson Chalmers neighborhood, this 3-bedroom brick single-family home offers a solid layout and strong upside potential in an established residential pocket of Detroit. The property features classic brick construction, a fenced backyard, and a 1.5-car garage, making it an excellent candidate for a full renovation project. Significant fire damage has caused the need for a full roof replacement required (down to plywood and roof beams), Interior requires complete rehab, this is a true value-add opportunity ideal for: Investors, Contractors, Developers, Builders and Rehab specialists. With the right vision, this property can be restored and repositioned to capture value in a growing area.
Key facts
- Brick construction
- Fenced backyard
- Growing area
Tags
Property features AI
Exterior
- Parking: Detached garage; Approximately 1.5 garage spaces
- Utilities: Public water; Public sewer
- Home design: Single family residence; Two-story home; Ground-level entry with steps; Brick and vinyl siding exterior
- Construction: Block foundation
- Exterior features: Back yard fencing; Paved road access
Interior
- Bathrooms: 1 full bathroom; 1 half bathroom
- Heating & cooling: Central air conditioning; Forced air heating; Natural gas heating
- Interior features: Unfinished basement
Neighborhood map
What this means for you Summary
Snapshot
- This is a 3-bed/1.5-bath single-family listed at $16k.
Deal economics
- At list price, monthly cash flow is $954 ($11k/yr) — positive.
- The deal already cash-flows at list — no discount required.
- Meets the 1% rule at list price ($1k rent vs $16k).
- Recommended offer: $16k (1.5% below list) — sets the bar for market timing.
- Cap rate 77.9% vs local median 10.2% in Detroit — top-decile yield for the area; either an underpriced asset or a hidden risk that comps aren't pricing in. Stress-test before assuming the spread holds.
Location & tenants
- Location reads 73/100 on livability (#218 in MI) — a middle-class / working-renter tenant base. Strengths: amenities A+, commute A+, cost of living A+; Watch: schools F, crime F, employment F.
- Detroit Public Schools Community District (urban): math 10% / reading 24% proficiency, ranked #499 of 540 in MI (top 92%) — low school quality limits family demand, transient renter base, plan for 1-2y turnover; 90% free/reduced lunch — lower-income household profile, screen leases tightly.
- Market conditions: 137 active listings in the ZIP; 13 comparable units currently listed for rent nearby; rentals at typical pace (median 25d on market — plan ~3-4 weeks tenant-placement turnaround); 2,639 units permitted in Wayne County in 2024 (1,216 in 5+ unit buildings).
Forward outlook
- Local home prices are declining (-3.0%/yr); year-one equity from $111 of loan paydown is wiped out by about $480 of value loss. Plan a longer hold.
- Wayne County population projected at -17% by 2050 — secular population decline; favor cash flow + early exit over multi-decade hold.
- At projected returns (-3.0% appreciation + 3.0% rent growth), your $4k cash investment doubles in ~1 year — after that, you're playing with house money.
Negotiation context
- It's been on market 15 days — a 2% lower offer ($16k) is reasonable based on typical stale-listing flexibility.
- 9 sale attempts since 5y ago; this cycle's ask has dropped $1k (6%) from the opening price — seller is motivated, your offer sets the floor, not the list.
Risks & watch-outs
- Watch-outs: built in 1925 — expect roof / HVAC / electrical / plumbing capex.
Questions for the listing agent
- Built in 1925 — when were the roof, HVAC, electrical panel, plumbing, and water heater last replaced?
- Is there a deadline driving the sale (1031 exchange, divorce, estate, relocation)? That informs how much negotiation room exists.
- Schools are F-rated, which usually means shorter tenancies and higher turnover. Who's the typical renter profile here, and what's been the actual vacancy rate?
- Crime grade is F in this area — have there been break-ins, vandalism, or insurance claims at this property in the last 3 years? What carrier currently insures it and at what premium?
- The area grade is low — what's the realistic commute time and amenity access for the typical tenant pool here? Any planned neighborhood developments (good or bad) we should know about?
- What's the average days-on-market for RENTAL listings here right now (not sales)? A rising rental-DOM trend means longer vacancies and softer asking-rent achievability than the comps imply.
- What's the recent tenant-quality profile in this submarket — average credit score on applications, eviction rate, late-payment / NSF rate, and stable-employment percentage? A property-management company in the area should have these aggregated.
- How much new for-sale + rental construction is in the pipeline within 1–3 miles? Heavy new supply typically softens prices + rents 12–24 months out; constrained supply supports both.
Investment metrics
- 1% rule
- 8.42% ✓
- Cap rate
- 77.87%
- Cash-on-cash
- 255.62%
- DSCR
- 12.37
- GRM
- 1.0
CMA / ARV
- ARV (median comp)
- $62,536
- List price
- $16,000
- Delta
- -72.82%
- Verdict
- UNDERPRICED
- Comps
- 20 within 1.0 mi
Show comp detail 4 sales within ~0.75 mi
| Address | Dist | Beds/Ba | Sqft | Sold | Price | $/sf | Match |
|---|---|---|---|---|---|---|---|
| 2525 Eastlawn St | 0.31mi | 3/2.0 | 1,554 (+2%) | 19mo | $86,500 | $56 | 65 |
| 2145 Newport St | 0.43mi | 3/1.0 | 1,449 (-5%) | 11mo | $68,000 | $47 | 60 |
| 1315 Newport St | 0.58mi | 4/1.0 (+1) | 1,364 (-11%) | 0mo | $10,000 | $7 | 48 |
| 4312 Gray St | 0.57mi | 3/1.5 | 1,336 (-13%) | 24mo | $57,000 | $43 | 33 |
Match score weights: distance 35% · size 25% · config 20% · recency 20%. Top-matched comps best support the ARV.
Projected returns pro-forma
-3.0% appreciation · 3.0% rent growth · sell at horizon
- IRR
- —
- Equity multiple
- 13.99×
- Total profit
- $58,209
- Equity at exit
- $2,386
- IRR
- —
- Equity multiple
- 29.80×
- Total profit
- $129,036
- Equity at exit
- $1,383
Cash invested: $4,480 (down + closing). Projections, not guarantees.
Landlord ↔ Tenant lean methodology
- Overall (STATE)
- 62 Landlord-Friendly
- State Michigan
- 62 Landlord-Friendly · EVEN
- County
- — inherits STATE
- City
- — inherits STATE
ZIP-level market 48215
- Home prices YoY
- -24.1%
- Active inventory
- 137
- Price-to-rent
- 1.0×
Monthly cashflow live
- Estimated rent
- $1,348 high interval (Pro) →
- Mortgage (P&I)
- −$84
- Tax est. 1.5%
- −$20 /mo · $240/yr
- Insurance
- −$7
- HOA
- −$0
- Vacancy / Maint / Mgmt
- −$283
- Net cashflow
- $954
Break-even live
Sensitivity live
| Price | -10% $965 | -5% $960 | +0% $954 | +5% $949 | +10% $943 |
|---|---|---|---|---|---|
| Rent | -10% $848 | -5% $901 | +0% $954 | +5% $1,008 | +10% $1,061 |
| Rate | -1.0pp $962 | -0.5pp $958 | base $954 | +0.5pp $950 | +1.0pp $946 |
UW: 25.0% down · 7.5% · 30yr · 1.5% tax · 5.0% vac · 8.0% maint · 8.0% mgmt
Financing live
Cash to close
- Down payment
- $4,000
- Closing costs
- $480
- Reserves months
- —
- Total cash needed
- —
Loan-product check · same deal, 3 products live
Conventional
25% down · 7.5% · 30yr
- Down + closing
- —
- Monthly P&I
- —
- Monthly cashflow
- —
- DSCR
- —
- Eligible?
- —
Personal DTI + credit; lowest rate.
DSCR
20% down · 8.5% · 30yr
- Down + closing
- —
- Monthly P&I
- —
- Monthly cashflow
- —
- DSCR
- —
- Eligible?
- —
No personal income docs; deal must DSCR.
Hard money
10% down · 12.0% · 12mo
- Down + closing
- —
- Monthly P&I
- —
- Monthly cashflow
- —
- DSCR
- —
- Eligible?
- —
Short-term bridge; refi at stabilization.
Rent comps 13 comps
| Address | Beds | Baths | Sqft | Rent | $/sqft | DOM | Units | Dist |
|---|---|---|---|---|---|---|---|---|
| 1334 Maryland St Grosse Pointe Park, MI | 2.0 | 1.0 | 1786 | $1,200 | $0.67 | 18d | 1 | 0.87mi |
| 4251 Wayburn St Detroit, MI | 3.0 | 1.5 | 1326 | $1,650 | $1.24 | 44d | 1 | 0.95mi |
| 875 Philip St Detroit, MI | 3.0 | 1.0 | 1353 | $1,400 | $1.03 | 44d | 1 | 1.01mi |
| 1236 Beaconsfield Ave Unit 1 Grosse Pointe Park, MI | 2.0 | 1.0 | 1100 | $1,600 | $1.45 | 24d | 1 | 1.04mi |
| 1312 Somerset Ave Grosse Pointe Park, MI | 2.0 | 1.0 | 1200 | $1,400 | $1.17 | 17d | 1 | 1.13mi |
| 3937 Beniteau St Unit 1 Detroit, MI | 2.0 | 1.0 | 1250 | $900 | $0.72 | 44d | 1 | 1.14mi |
| 734 Ashland St Detroit, MI | 3.0 | 1.0 | 1110 | $1,300 | $1.17 | 24d | 1 | 1.20mi |
| 734 Ashland St Detroit, MI | 3.0 | 1.0 | 1110 | $1,300 | $1.17 | 22d | 1 | 1.20mi |
| 3625 Chatsworth St Detroit, MI | 3.0 | 1.5 | 1182 | $1,295 | $1.10 | 24d | 1 | 1.23mi |
| 3651 Buckingham Ave Detroit, MI | 3.0 | 1.0 | 1320 | $1,300 | $0.98 | 18d | 1 | 1.34mi |
| 13010 Avondale St Detroit, MI | 1.0–2.0 | 1.0–2.0 | 1003 | $1,725 | $1.72 | 2d | 1 | 1.37mi |
| 861 Beaconsfield Ave Grosse Pointe Park, MI | 2.0 | 1.0 | 1300 | $1,500 | $1.15 | 13d | 1 | 1.40mi |
| 3495 Garland St Detroit, MI | 2.0 | 1.0 | 1100 | $900 | $0.82 | 44d | 1 | 1.49mi |
Listing history 31 events
-
2026-06-18days on market $16,000 Active 15 DOM
-
2026-06-17days on market $16,000 Active 14 DOM
-
2026-06-16days on market $16,000 Active 13 DOM
-
2026-06-15days on market $16,000 Active 12 DOM
-
2026-06-13days on market $16,000 Active 10 DOM
-
2026-06-13days on market $16,000 Active 9 DOM
-
2026-06-09pricedays on market $16,000 Active 6 DOM
Show marketing remark (756 chars)
2916 Dickerson Detroit MI 48215 Located near the desirable Jefferson Chalmers neighborhood, this 3-bedroom brick single-family home offers a solid layout and strong upside potential in an established residential pocket of Detroit. The property features classic brick construction, a fenced backyard, and a 1.5-car garage, making it an excellent candidate for a full renovation project. Significant fire damage has caused the need for a full roof replacement required (down to plywood and roof beams), Interior requires complete rehab, this is a true value-add opportunity ideal for: Investors, Contractors, Developers, Builders and Rehab specialists. With the right vision, this property can be restored and repositioned to capture value in a growing area.
-
2026-06-08days on market $17,000 Active 5 DOM
-
2026-06-07days on market $17,000 Active 4 DOM
-
2026-06-04days on market $17,000 Active 1 DOM
-
2026-05-31days on market $17,000 Active 32 DOM
-
2026-05-13price $18,000 756-char remark
-
2026-05-13price $18,000 756-char remark
-
2026-05-05price $20,000 756-char remark
-
2026-05-05price $20,000 756-char remark
-
2026-04-29$22,000 Active 756-char remark
-
2026-04-29$22,000 Active 756-char remark
-
2022-10-01historical
-
2022-10-01historical
-
2022-06-25$35,000 Active
-
2022-06-20$35,000 Active
-
2022-06-18historical
-
2022-06-18historical
-
2022-04-15status Active
-
2022-04-12historical
-
2021-12-02price $40,000
-
2021-12-02price $40,000
-
2021-11-10price $50,000
-
2021-11-09price $50,000
-
2021-10-15$55,000 Active
-
2021-10-15$55,000 Active
ⓘ Source: listings_history table (triggers on properties + properties_extension) + one-shot
backfill from property_details.listing_events for pre-trigger history.
Climate risk First Street
- Flood 1/10 Low FEMA zone X (unshaded) · 0% chance over 30 yrs
- Wildfire 1/10 Low
- Heat 3/10 Moderate 7 d/yr ≥96°F today · 15 d/yr by 30 yrs out
- Wind 2/10 Low
- Air quality 3/10 Moderate 2 unhealthy d/yr today · 5 by 30 yrs out
Nearby sold comps map
Loading sold comps map…
Walkable amenities ~0.75 mi
Loading nearby amenities…
Taxation est. · year 1
- Rental income
- $16,176
- − Mortgage interest
- −$896
- − Property taxes
- −$240
- − Insurance
- −$80
- − Repairs & maintenance
- −$1,294
- − Management
- −$1,294
- − Depreciation
- −$465
- Taxable income
- $11,906
- Est. tax owed @ 24.0%
- −$2,857
- After-tax cash flow
- $8,594/yr
For passive investors: Depreciation is non-cash, so a rental often shows a tax loss while cash-flowing — sheltering income. Rental losses are passive: they offset passive income freely, and up to $25,000/yr can offset ordinary (W-2) income if you actively participate and your MAGI is under $100k (phasing out to $0 by $150k); unused losses carry forward. On sale, claimed depreciation is recaptured at up to 25%, and gains may owe capital-gains tax (a 1031 exchange can defer both). Figures are a year-1 estimate at your 24.0% rate — not tax advice; consult a CPA.
Schools (NCES district)
- District
- Detroit Public Schools Community District
- NCES district ID
- 2601103
- Math proficiency
- 10% ▼ -2.00%
- Reading proficiency
- 24% ▲ 6.00%
- Median HH income
- $25,815
- Composite
- 13.06/100
- National rank
- #9564
- State rank
- #499 of 540 in MI
Livability — Detroit
- Score
- 73/100
- State rank
- #218
- US rank
- #5427
Category grades
Schools grade is shown separately in the Schools card above.
Census & demographics
- Census place
- Detroit, MI
- City population
- 572,865
- Population (ZIP)
- 10,238
Population outlook (Wayne County) Hauer SSP2
- Today (2025)
- 1,675,273 people
- By 2030
- 1,620,300 · -3.3%
- By 2040
- 1,502,341 · -10.3%
- By 2050
- 1,384,039 · -17.4%
- By 2075
- 1,124,592 · -32.9%
- By 2100
- 881,193 · -47.4%
Race, ethnicity, and origin ACS 2023
- Neighborhood character
- Predominantly Black (87%)
- Race & ethnicity
- Black 87% White 9% Two or more races 2% Hispanic / Latino 2%
- Common ancestry
- Romanian 1% Slovak 1% Lithuanian 1%
- Foreign-born
- 1% · Canada
- Languages at home
- 99% English-only · Spanish 1%
Political lean MEDSL · Wayne
- 2024 margin
- Strong D (+29.0) · D 62.7% · R 33.7% · Other 3.6%
- 2008→2024 swing
- -20.5pp toward R · 2008: 49.5pp · 2024: 29.0pp
- All cycles
- 2024: D+29.0 2020: D+38.1 2016: D+37.3 2012: D+46.9 2008: D+49.5
Not yet ingested
- Civics
- —
Market trends
- HPI YoY
- ▼ -60.84%
- Current HPI
- 191.0405
- Rent YoY
- —
- Metro
- —
- State GDP YoY
- ▲ 1.37%
- F500 in state
- 28
Industry mix (Fortune 500 HQ in MI)
| Industry | F500 HQs | Revenue |
|---|---|---|
| Automotive Parts | 3 | $48B |
|
||
| Automotive | 2 | $372B |
|
||
| Chemicals | 1 | $45B |
|
||
| Automotive Retail | 1 | $29B |
|
||
| Healthcare / Medical Devices | 1 | $23B |
|
||
| Automotive Technology | 1 | $20B |
|
||
Price history
-70.9% since first listed28 events — show timeline
- 2026-06-09 Price Changed $16,000 MiRealSource-MiMLS
- 2026-06-08 Price Changed $16,000 REALCOMP
- 2026-06-03 Listed $17,000 REALCOMP
- 2026-06-03 Listed $17,000 MiRealSource-MiMLS
- 2026-06-01 Listing Removed — MiRealSource-MiMLS
- 2026-06-01 Listing Removed — REALCOMP
- 2026-05-27 Price Changed $17,000 MiRealSource-MiMLS
- 2026-05-27 Price Changed $17,000 REALCOMP
- 2026-05-13 Price Changed $18,000 MiRealSource-MiMLS
- 2026-05-13 Price Changed $18,000 REALCOMP
- 2026-05-05 Price Changed $20,000 MiRealSource-MiMLS
- 2026-05-05 Price Changed $20,000 REALCOMP
- 2026-04-29 Listed $22,000 MiRealSource-MiMLS
- 2026-04-29 Listed $22,000 REALCOMP
- 2022-10-01 Listing Removed — MiRealSource-MiMLS
- 2022-10-01 Listing Removed — REALCOMP
- 2022-06-25 Listed $35,000 REALCOMP
- 2022-06-20 Listed $35,000 MiRealSource-MiMLS
- 2022-06-18 Listing Removed — REALCOMP
- 2022-06-18 Listing Removed — MiRealSource-MiMLS
- 2022-04-15 Relisted — REALCOMP
- 2022-04-12 Listing Removed — REALCOMP
- 2021-12-02 Price Changed $40,000 MiRealSource-MiMLS
- 2021-12-02 Price Changed $40,000 REALCOMP
- 2021-11-10 Price Changed $50,000 MiRealSource-MiMLS
- 2021-11-09 Price Changed $50,000 REALCOMP
- 2021-10-15 Listed $55,000 MiRealSource-MiMLS
- 2021-10-15 Listed $55,000 REALCOMP
Property tax history
+6.5%/yrLatest (2025): $945 · +2.3% YoY. Source: county tax records.
Cash-flow waterfall
monthlySold comps — $/sqft
last 12 mo · ≤1 miLoading sold comps…