9507 Fern Hollow Way · Montgomery Village, MD
Flood risk 1/10 · Minimal
- FEMA flood zone
- X (unshaded)
- Chance of flooding over 30 yrs
- 0.0%
- Est. flood insurance / yr
- $473 – $860
Fire risk 1/10 · Minimal
- Est. fire insurance / yr
- $755 – $1,403
Heat risk 6/10 · Moderate
- Hot days now (above 102°F)
- 7 days/yr
- Hot days in 30 yrs
- 16 days/yr
Wind risk 4/10 · Minor
- Chance of severe wind over 30 yrs
- 12.0%
Air-quality risk 2/10 · Minimal
- Unhealthy air days now
- 2 days/yr
- Unhealthy air days in 30 yrs
- 2 days/yr
Risk factors via First Street. Map © Google.
Why this score? — see what drove the D grade
The composite is a weighted blend of 9 inputs, each scored 0–100. Each bar is that input's sub-score; the figure is the points it added to the 100-point composite (weight × sub-score).
- ARV discount +9.9/15.0
- Cash flow +9.1/30.0
- Appreciation +4.5/10.0
- Rent growth +3.6/5.0
- Schools +3.6/10.0
- Livability +3.1/5.0
- 1% rule +2.5/10.0
- DSCR +2.5/10.0
- Condition / age +2.5/5.0
$415,000
🖨 Deal sheet (PDF) 📄 Offer letter ✓ Due diligence
Listing remarks
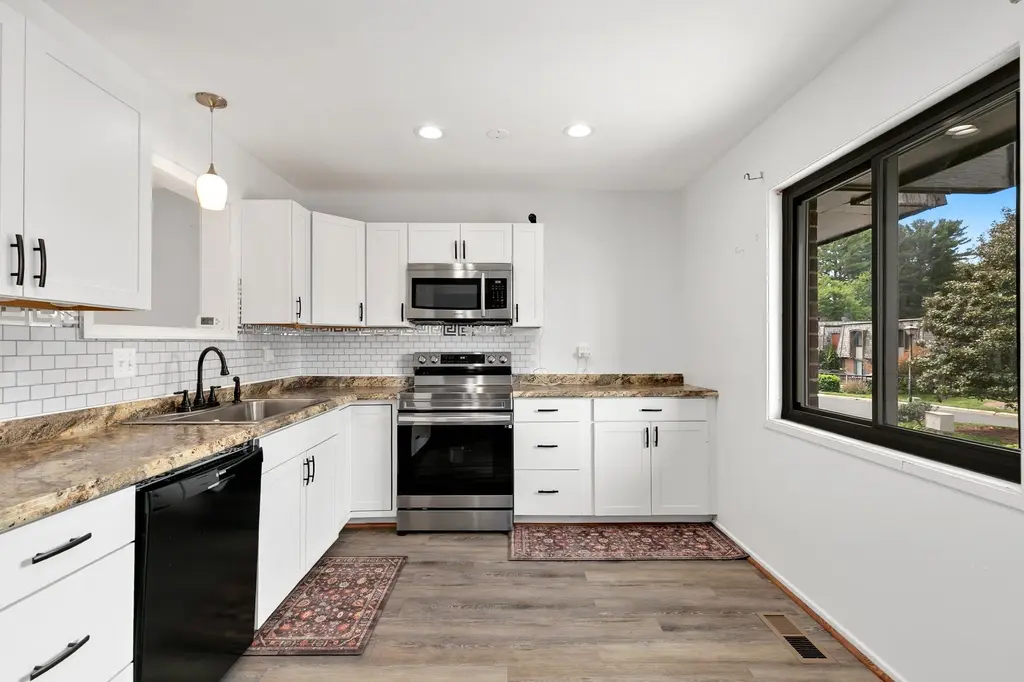
Spacious and full of flexible living space, this 3-bedroom, 2.5-bath garage townhome in amenity-rich Montgomery Village offers great indoor-outdoor flow and room to spread out. NEW HVAC 2026! The entry level features a welcoming foyer with coat/storage closet, garage access, and a separate bonus room with laundry—perfect for a guest space, home office, gym, playroom, or movie nights. The main living level features a sunny updated eat-in kitchen with pantry and balcony access, a convenient half bath, separate dining room, and a spacious living room filled with natural light. Sliding doors off the dining room lead to a composite wood deck with stairs down to the fenced patio and landsca
Key facts
- Fenced patio
- Landscaped backyard
- Bonus room
Tags
Property features AI
Finance
- HOA & community: Monthly HOA fee of $152; HOA covers common area maintenance, pool(s), recreation facility, road maintenance, snow removal and trash; Community amenities include basketball courts, bike trail, common grounds, community center, jog/walk path, picnic area, outdoor pool, tennis courts, playgrounds and other amenities
Exterior
- Parking: Attached front-entry garage (1 car); Driveway with two spaces; One additional off-street space; Concrete driveway; Total of 4 garage and parking spaces
- Utilities: Public water; Public sewer; Electric power
- Home design: Interior townhouse/rowhouse; Fee simple ownership; Effective year of major renovation: 2020
- Construction: Frame construction; Other foundation details; Above-grade and below-grade structures
- Exterior features: Rear split-rail fencing; Community outdoor pool; Pets allowed with no restrictions
Interior
- Kitchen: Dishwasher; Disposal; Microwave; Stove; Refrigerator
- Bedrooms: Three bedrooms on the upper level
- Flooring: Engineered wood flooring
- Bathrooms: Two full bathrooms on the upper level; One half bathroom on the main level
- Heating & cooling: Central heating; Central air conditioning; Electric heating and cooling; Electric hot water
- Interior features: Breakfast area and eat-in kitchen with table space; Pantry; Basement (other type)
- Laundry & utility: Washer and dryer; Laundry located in the basement
Neighborhood map
What this means for you Summary
Snapshot
- This is a 3-bed/2.5-bath townhouse listed at $415k.
Deal economics
- At list price, monthly cash flow is $-318 ($-4k/yr) — negative.
- To cash-flow at today's rent, offer at most $359k (13.6% below list).
- To meet the 1% rule (rent ≥ 1% of price), the offer needs to be $311k (25.0% below list).
- Recommended offer: $311k (25.0% below list) — sets the bar for 1% rule.
- Cap rate 5.4% vs local median 4.2% in Montgomery Village — meaningfully above typical; check what's discounted (condition, days-on-market, listing class) to confirm the premium yield is real.
Location & tenants
- Location reads 62/100 on livability (#318 in MD) — a middle-class / working-renter tenant base. Strengths: employment A+, housing A+; Watch: crime D-, amenities F, commute F.
- Montgomery County Public Schools (suburban): math 27% / reading 45% proficiency, ranked #3 of 24 in MD (top 12%) — families likely to look elsewhere, expect single-tenant / working-renter base with shorter leases.
- Zoned schools: Whetstone Elementary (math 12% / reading 11%, grade F, #567 of 860 statewide, top 67%, 715 students, 75% FRL); Montgomery Village Middle (math 3% / reading 25%, grade F, #196 of 225 statewide, top 88%, 773 students, 80% FRL); Watkins Mill High (math 20% / reading 51%, grade F, #144 of 222 statewide, top 65%, 1,715 students, 74% FRL) — zoned schools average 77% FRL vs 26% district-wide (50 pts higher); higher-poverty schools than district average — tighter screening recommended.
- Zoned-school proficiency averages 20% at this address vs 36% district-wide (-16 pts) — the specific schools serving this property underperform the Montgomery County Public Schools average; the district grade overstates school quality for this exact location.
- Market conditions: Rents rising fast (+4.3%/yr); 125 active listings in the ZIP; 40 comparable units currently listed for rent nearby; rentals lingering (median 45d on market — plan ~5-8 weeks vacancy on turnover, expect pricing pressure); 52% of comp listings sitting > 30 days — soft ceiling on asking rent; solid renter incomes; 3,880 units permitted in Montgomery County in 2024 (2,054 in 5+ unit buildings).
- This rent runs 38% of the median local income ($99k/yr) — at the standard rent-burdened threshold; future hikes will face affordability resistance.
Forward outlook
- Local home prices are declining (-1.0%/yr); year-one equity from $3k of loan paydown is wiped out by about $4k of value loss. Plan a longer hold.
- Montgomery County population projected at +27% by 2050 — long-run rental-demand tailwind backs the buy-and-hold thesis.
Negotiation context
- It's been on market 38 days — a 3% lower offer ($403k) is reasonable based on typical stale-listing flexibility.
- 3 sale attempts since 20y ago with the ask held roughly flat each time — persistent listings suggest the price (not the market) is what's stuck; bring a comps-based counter.
- Current owner paid $153k; list at $415k implies a 171% gain — meaningful room to come down on a strong offer.
Risks & watch-outs
- Climate carrying-cost: extreme-heat days projected 7→16/yr by 2055 (HVAC capex compounding) — expect insurance premiums to compound above CPI over the hold.
Questions for the listing agent
- What do current leases actually rent for vs. the listed asking? Can we see a recent rent roll and the last 12 months of T-12 income?
- It's been on market 38 days. Have you received any prior offers? Is the seller open to a 25% concession, seller financing, or rate buy-down credit?
- Built in 1974 — when were the roof, HVAC, electrical panel, plumbing, and water heater last replaced?
- What does the HOA fee cover, when was the last increase, and are there any pending special assessments or reserve-fund shortfalls?
- Is there a deadline driving the sale (1031 exchange, divorce, estate, relocation)? That informs how much negotiation room exists.
- Schools are F-rated, which usually means shorter tenancies and higher turnover. Who's the typical renter profile here, and what's been the actual vacancy rate?
- Crime grade is D in this area — have there been break-ins, vandalism, or insurance claims at this property in the last 3 years? What carrier currently insures it and at what premium?
- The area grade is low — what's the realistic commute time and amenity access for the typical tenant pool here? Any planned neighborhood developments (good or bad) we should know about?
- What's the average days-on-market for RENTAL listings here right now (not sales)? A rising rental-DOM trend means longer vacancies and softer asking-rent achievability than the comps imply.
- What's the recent tenant-quality profile in this submarket — average credit score on applications, eviction rate, late-payment / NSF rate, and stable-employment percentage? A property-management company in the area should have these aggregated.
- How much new for-sale + rental construction is in the pipeline within 1–3 miles? Heavy new supply typically softens prices + rents 12–24 months out; constrained supply supports both.
Investment metrics
- 1% rule
- 0.75% ✗
- Cap rate
- 5.37%
- Cash-on-cash
- -3.29%
- DSCR
- 0.85
- GRM
- 11.1
CMA / ARV
- ARV (median comp)
- $438,148
- List price
- $415,000
- Delta
- -5.28%
- Verdict
- FAIR
- Comps
- 20 within 1.0 mi
Show comp detail 12 sales within ~0.75 mi
| Address | Dist | Beds/Ba | Sqft | Sold | Price | $/sf | Match |
|---|---|---|---|---|---|---|---|
| 9318 Bremerton Way | 0.31mi | 3/2.5 | 1,910 (+1%) | 2mo | $425,000 | $223 | 82 |
| 9566 Fern Hollow Way | 0.11mi | 3/1.5 | 1,765 (-6%) | 2mo | $425,000 | $241 | 79 |
| 9537 Tall Oaks Rd | 0.18mi | 3/3.0 | 1,760 (-7%) | 1mo | $512,000 | $291 | 78 |
| 20129 Waringwood Way | 0.41mi | 3/2.5 | 1,848 (-2%) | 1mo | $510,000 | $276 | 77 |
| 19765 Green Village Dr | 0.21mi | 3/2.5 | 2,016 (+7%) | 4mo | $585,000 | $290 | 76 |
| 20125 Hob Hill Way | 0.41mi | 4/2.5 (+1) | 1,820 (-3%) | 3mo | $437,000 | $240 | 67 |
| 20130 Waringwood Way | 0.40mi | 3/2.5 | 2,100 (+12%) | 1mo | $410,000 | $195 | 61 |
| 19726 Canopy Loop Unit 329B | 0.54mi | 3/2.5 | 1,741 (-8%) | 4mo | $545,145 | $313 | 59 |
| 20003 Canebrake Ct | 0.71mi | 3/2.5 | 1,677 (-11%) | 1mo | $330,000 | $197 | 48 |
| 19708 Preservation Mews | 0.61mi | 3/3.5 | 1,680 (-11%) | 2mo | $483,500 | $288 | 48 |
| 9201 Broadwater Dr | 0.72mi | 3/2.5 | 1,688 (-10%) | 3mo | $441,000 | $261 | 46 |
| 19133 Broadwater Way | 0.71mi | 3/3.5 | 1,682 (-11%) | 0mo | $425,000 | $253 | 44 |
Match score weights: distance 35% · size 25% · config 20% · recency 20%. Top-matched comps best support the ARV.
Projected returns pro-forma
-0.98% appreciation · 4.27% rent growth · sell at horizon
- IRR
- -9.3%
- Equity multiple
- 0.59×
- Total profit
- $-47,064
- Equity at exit
- $100,657
- IRR
- -1.4%
- Equity multiple
- 0.86×
- Total profit
- $-15,915
- Equity at exit
- $106,107
Cash invested: $116,200 (down + closing). Projections, not guarantees.
Landlord ↔ Tenant lean methodology
- Overall (STATE)
- 27 Tenant-Leaning
- State Maryland
- 27 Tenant-Leaning · D+14
- County
- — inherits STATE
- City
- — inherits STATE
ZIP-level market 20886
- Home prices YoY
- -0.4%
- Rents YoY
- 4.3%
- Active inventory
- 125
- Price-to-rent
- 11.1×
Monthly cashflow live
- Estimated rent
- $3,112 high interval (Pro) →
- Mortgage (P&I)
- −$2,176
- Tax from tax record
- −$276 /mo · $3,306/yr
- Insurance
- −$173
- HOA
- −$152
- Vacancy / Maint / Mgmt
- −$653
- Net cashflow
- $-318
Break-even live
Sensitivity live
| Price | -10% $-84 | -5% $-201 | +0% $-318 | +5% $-436 | +10% $-553 |
|---|---|---|---|---|---|
| Rent | -10% $-564 | -5% $-441 | +0% $-318 | +5% $-196 | +10% $-73 |
| Rate | -1.0pp $-110 | -0.5pp $-213 | base $-318 | +0.5pp $-426 | +1.0pp $-535 |
UW: 25.0% down · 7.5% · 30yr · 1.5% tax · 5.0% vac · 8.0% maint · 8.0% mgmt
Financing live
Cash to close
- Down payment
- $103,750
- Closing costs
- $12,450
- Reserves months
- —
- Total cash needed
- —
Loan-product check · same deal, 3 products live
Conventional
25% down · 7.5% · 30yr
- Down + closing
- —
- Monthly P&I
- —
- Monthly cashflow
- —
- DSCR
- —
- Eligible?
- —
Personal DTI + credit; lowest rate.
DSCR
20% down · 8.5% · 30yr
- Down + closing
- —
- Monthly P&I
- —
- Monthly cashflow
- —
- DSCR
- —
- Eligible?
- —
No personal income docs; deal must DSCR.
Hard money
10% down · 12.0% · 12mo
- Down + closing
- —
- Monthly P&I
- —
- Monthly cashflow
- —
- DSCR
- —
- Eligible?
- —
Short-term bridge; refi at stabilization.
Rent comps 40 comps
| Address | Beds | Baths | Sqft | Rent | $/sqft | DOM | Units | Dist |
|---|---|---|---|---|---|---|---|---|
| 9599 Tall Oaks Rd Montgomery Village, MD | 3.0 | 2.5 | 1760 | $3,250 | $1.85 | 20d | 1 | 0.17mi |
| 9537 Tall Oaks Rd Montgomery Village, MD | 3.0 | 2.5 | 1760 | $3,390 | $1.93 | 16d | 1 | 0.18mi |
| 9583 Tall Oaks Rd Montgomery Village, MD | 4.0 | 2.5 | 1760 | $3,480 | $1.98 | 25d | 1 | 0.18mi |
| 19533 Sol PL Gaithersburg, MD | 3.0 | 2.5 | 1978 | $3,499 | $1.77 | 45d | 1 | 0.20mi |
| 19753 Green Village Dr Montgomery Village, MD | 3.0 | 2.5 | 1936 | $3,350 | $1.73 | 3d | 1 | 0.21mi |
| 19753 Green Village Dr Unit 1 Montgomery Village, MD | 3.0 | 2.5 | 1936 | $3,375 | $1.74 | 3d | 1 | 0.21mi |
| 9639 Tall Oaks Rd Montgomery Village, MD | 3.0 | 2.5 | 1776 | $3,400 | $1.91 | 45d | 1 | 0.23mi |
| 9226 Weathervane Pl Unit 1 Gaithersburg, MD | 3.0 | 3.0 | 1739 | $2,750 | $1.58 | 20d | 1 | 0.24mi |
| 9226 Weathervane Pl Montgomery Village, MD | 3.0 | 2.5 | 1739 | $2,750 | $1.58 | 20d | 1 | 0.24mi |
| 9113 Bramble Bush Ct Gaithersburg, MD | 4.0 | 3.0 | 2252 | $3,000 | $1.33 | 6d | 1 | 0.34mi |
| 9343 Bremerton Way Montgomery Village, MD | 3.0 | 2.5 | 1457 | $3,150 | $2.16 | 19d | 1 | 0.34mi |
| 9402 Quill Pl Montgomery Village, MD | 4.0 | 2.5 | 2100 | $2,700 | $1.29 | 45d | 1 | 0.42mi |
| 19505 Turtle Dove Ter Gaithersburg, MD | 3.0 | 2.5 | 2002 | $2,900 | $1.45 | 45d | 1 | 0.48mi |
| 19505 Turtle Dove Ter Gaithersburg, MD | 3.0 | 2.5 | 2002 | $2,900 | $1.45 | 0d | 1 | 0.48mi |
| 19404 Transhire Rd Montgomery Village, MD | 4.0 | 2.5 | 1754 | $2,600 | $1.48 | 45d | 1 | 0.51mi |
| 9652 Marston Ln Montgomery Village, MD | 3.0 | 1.5 | 1320 | $2,700 | $2.05 | 4d | 1 | 0.51mi |
| 19349 Keymar Way Montgomery Village, MD | 3.0 | 1.5 | 1244 | $2,200 | $1.77 | 45d | 1 | 0.57mi |
| 9826 Posterity Ln Montgomery Village, MD | 3.0 | 3.5 | 1600 | $3,300 | $2.06 | 9d | 1 | 0.57mi |
| 19708 Preservation Mews Montgomery Village, MD | 3.0 | 3.5 | 1680 | $3,050 | $1.82 | 45d | 1 | 0.60mi |
| 9932 Tambay Ct Montgomery Village, MD | 3.0 | 2.5 | 1584 | $2,900 | $1.83 | 45d | 1 | 0.61mi |
| 20323 Swallow Point Rd Montgomery Village, MD | 3.0 | 2.5 | 1888 | $3,250 | $1.72 | 23d | 1 | 0.65mi |
| 10169 Ridgeline Dr Montgomery Village, MD | 3.0 | 2.5 | 1501 | $2,400 | $1.60 | 45d | 1 | 0.69mi |
| 8851 Welbeck Way Montgomery Village, MD | 3.0 | 2.5 | 1300 | $2,972 | $2.29 | 45d | 1 | 0.75mi |
| 9317 Broadwater Dr Gaithersburg, MD | 3.0 | 3.5 | 1760 | $2,590 | $1.47 | 45d | 1 | 0.77mi |
| 8874 Welbeck Way Gaithersburg, MD | 4.0 | 2.5 | 1254 | $2,450 | $1.95 | 22d | 1 | 0.78mi |
| 20559 Strath Haven Dr Montgomery Village, MD | 2.0 | 2.0 | 1260 | $2,300 | $1.83 | 45d | 1 | 0.80mi |
| 20322 Butterwick Way Montgomery Village, MD | 4.0 | 3.5 | 2029 | $3,300 | $1.63 | 0d | 1 | 0.83mi |
| 8711 Ravenglass Way Montgomery Village, MD | 3.0 | 3.5 | 1470 | $2,600 | $1.77 | 45d | 1 | 0.86mi |
| 10225 Cove Ledge Ct Montgomery Village, MD | 4.0 | 3.5 | 1724 | $2,750 | $1.60 | 45d | 1 | 0.87mi |
| 8785 Ravenglass Way Montgomery Village, MD | 2.0 | 3.5 | 1402 | $2,800 | $2.00 | 45d | 1 | 0.87mi |
| 8719 Delcris Dr Montgomery Village, MD | 3.0 | 2.5 | 2222 | $4,000 | $1.80 | 45d | 1 | 1.01mi |
| 18925 Lindenhouse Rd Gaithersburg, MD | 4.0 | 2.5 | 2245 | $3,390 | $1.51 | 23d | 1 | 1.01mi |
| 19407 Battleridge Way Montgomery Village, MD | 4.0 | 3.0 | 2307 | $3,000 | $1.30 | 45d | 1 | 1.05mi |
| 19002 Quail Valley Blvd Gaithersburg, MD | 4.0 | 2.0 | 1618 | $2,900 | $1.79 | 45d | 1 | 1.08mi |
| 9923 Lake Landing Rd Montgomery Village, MD | 3.0 | 2.5 | 2400 | $3,000 | $1.25 | 12d | 1 | 1.22mi |
| 18815 Walkers Choice Rd Montgomery Village, MD | 4.0 | 2.5 | 2104 | $2,725 | $1.30 | 45d | 1 | 1.23mi |
| 18815 Walkers Choice Rd Montgomery Village, MD | 4.0 | 2.5 | 2104 | $2,895 | $1.38 | 25d | 1 | 1.23mi |
| 19002 Stedwick Dr Montgomery Village, MD | 3.0 | 2.5 | 1452 | $2,650 | $1.83 | 15d | 1 | 1.27mi |
| 18728 Nathans Pl Unit 1 Montgomery Village, MD | 3.0 | 2.0 | 1440 | $2,400 | $1.67 | 45d | 1 | 1.43mi |
| 18624 Walkers Choice Rd Unit 6 Montgomery Village, MD | 3.0 | 2.0 | 1455 | $2,590 | $1.78 | 45d | 1 | 1.45mi |
HOA detail
- Monthly dues
- $152 · $1,824/yr
- Likely covers
- gym
Listing history 25 events
-
2026-06-21days on market $415,000 Active 38 DOM
-
2026-06-18days on market $415,000 Active 35 DOM
-
2026-06-17days on market $415,000 Active 34 DOM
-
2026-06-16days on market $415,000 Active 33 DOM
-
2026-06-15days on market $415,000 Active 32 DOM
-
2026-06-13days on market $415,000 Active 30 DOM
-
2026-06-09days on market $415,000 Active 26 DOM
-
2026-06-08days on market $415,000 Active 25 DOM
-
2026-06-07pricedays on market $415,000 Active 24 DOM
-
2026-06-04days on market $429,900 Active 21 DOM
-
2026-06-03days on market $429,900 Active 20 DOM
-
2026-06-02days on market $429,900 Active 19 DOM
-
2026-06-01days on market $429,900 Active 18 DOM
-
2026-05-31days on market $429,900 Active 17 DOM
-
2026-05-14$429,900 Active 1508-char remark
-
2024-11-11historical
-
2024-10-22price $444,900
-
2024-10-07price $449,900
-
2024-10-01price $459,000
-
2024-09-26$468,000 Active
-
2024-09-18historical
-
2006-10-03historical
-
2006-08-10
-
2001-05-23soldstatus $153,000
-
1981-01-05soldstatus $76,500
ⓘ Source: listings_history table (triggers on properties + properties_extension) + one-shot
backfill from property_details.listing_events for pre-trigger history.
Tax reassessment forecast MD · Partial reset (capped growth)
- Current annual tax
- $3,306 · $276/mo
- Projected year-2 tax
- $3,915 · $326/mo
- Expected delta
- +$609/yr (+$51/mo · 18.4%)
ⓘ Screening estimate from a state-policy table — verify with the county assessor before closing.
Climate risk First Street
- Flood 1/10 Low FEMA zone X (unshaded) · 0% chance over 30 yrs
- Wildfire 1/10 Low
- Heat 6/10 Major 7 d/yr ≥102°F today · 16 d/yr by 30 yrs out
- Wind 4/10 Moderate 12% chance of damaging wind over 30 yrs
- Air quality 2/10 Low 2 unhealthy d/yr today · 2 by 30 yrs out
Nearby sold comps map
Loading sold comps map…
Walkable amenities ~0.75 mi
Loading nearby amenities…
Taxation est. · year 1
- Rental income
- $37,340
- − Mortgage interest
- −$23,246
- − Property taxes
- −$3,306
- − Insurance
- −$2,075
- − Repairs & maintenance
- −$2,987
- − Management
- −$2,987
- − HOA
- −$1,824
- − Depreciation
- −$12,073
- Taxable loss
- −$11,158
- Est. tax savings @ 24.0%
- +$2,678
- After-tax cash flow
- $-1,144/yr
For passive investors: Depreciation is non-cash, so a rental often shows a tax loss while cash-flowing — sheltering income. Rental losses are passive: they offset passive income freely, and up to $25,000/yr can offset ordinary (W-2) income if you actively participate and your MAGI is under $100k (phasing out to $0 by $150k); unused losses carry forward. On sale, claimed depreciation is recaptured at up to 25%, and gains may owe capital-gains tax (a 1031 exchange can defer both). Figures are a year-1 estimate at your 24.0% rate — not tax advice; consult a CPA.
Schools (NCES district)
- District
- Montgomery County Public Schools
- NCES district ID
- 2400480
- Math proficiency
- 27% ▼ -21.00%
- Reading proficiency
- 45% ▼ -10.00%
- Median HH income
- $97,191
- Composite
- 35.62/100
- National rank
- #4889
- State rank
- #3 of 24 in MD
Livability — Montgomery Village
- Score
- 62/100
- State rank
- #318
- US rank
- #16536
Category grades
Schools grade is shown separately in the Schools card above.
Census & demographics
- Census place
- Montgomery Village, MD
- County
- Montgomery County · 961,106 people
- City population
- 34,718
- Metro
- Washington-Arlington-Alexandria, DC-VA-MD-WV
- Population (ZIP)
- 34,718
- Household income
- $98,542
- Rent vs Own
- Severe rent burden
- 1600.0
Population outlook (Montgomery County) Hauer SSP2
- Today (2025)
- 1,173,231 people
- By 2030
- 1,237,402 · +5.5%
- By 2040
- 1,365,115 · +16.4%
- By 2050
- 1,491,592 · +27.1%
- By 2075
- 1,803,893 · +53.8%
- By 2100
- 2,035,619 · +73.5%
Race, ethnicity, and origin ACS 2023
- Neighborhood character
- Highly diverse neighborhood (Simpson 0.75)
- Race & ethnicity
- Hispanic / Latino 35% Black 23% White 23% Asian 14% Two or more races 12% Native American 1%
- Hispanic origin (detail)
- Mexican 2% Puerto Rican 2% Dominican 1%
- Common ancestry
- Romanian 1% Estonian 1% Lithuanian 1%
- Foreign-born
- 35% · Canada, China, Guatemala
- Languages at home
- 46% English-only · Spanish 32% Other Indo-European 6% French/Haitian/Cajun 3%
Political lean MEDSL · Montgomery
- 2024 margin
- Solid D (+53.3) · D 75.2% · R 21.9% · Other 2.9%
- 2008→2024 swing
- +8.7pp toward D · 2008: 44.6pp · 2024: 53.3pp
- All cycles
- 2024: D+53.3 2020: D+59.6 2016: D+55.5 2012: D+43.4 2008: D+44.6
Not yet ingested
- Civics
- —
Market trends
- HPI YoY
- ▼ -0.98%
- Current HPI
- 272.9687
- Rent YoY
- ▲ 4.27%
- Metro
- Washington-Arlington-Alexandria, DC-VA-MD-WV
- State GDP YoY
- ▲ 2.97%
- F500 in state
- 12
Industry mix (Fortune 500 HQ in MD)
| Industry | F500 HQs | Revenue |
|---|---|---|
| Aerospace / Defense | 1 | $71B |
|
||
| Utilities | 1 | $25B |
|
||
| Hotels | 1 | $24B |
|
||
| Consumer Goods | 1 | $7B |
|
||
| Real Estate | 1 | $6B |
|
||
| Chemicals | 1 | $2B |
|
||
Price history
+442.5% since first listed12 events — show timeline
- 2026-06-04 Price Changed $415,000 BRIGHT MLS
- 2026-05-14 Listed $429,900 BRIGHT MLS
- 2024-11-11 Listing Removed — BRIGHT MLS
- 2024-10-22 Price Changed $444,900 BRIGHT MLS
- 2024-10-07 Price Changed $449,900 BRIGHT MLS
- 2024-10-01 Price Changed $459,000 BRIGHT MLS
- 2024-09-26 Listed $468,000 BRIGHT MLS
- 2024-09-18 Coming Soon — BRIGHT MLS
- 2006-10-03 Delisted — MRIS
- 2006-08-10 Listed — MRIS
- 2001-05-23 Sold (Public Records) $153,000 Public Records
- 1981-01-05 Sold (Public Records) $76,500 Public Records
Property tax history
+4.7%/yrLatest (2025): $3,306 · +10.2% YoY. Source: county tax records.
Cash-flow waterfall
monthlySold comps — $/sqft
last 12 mo · ≤1 miLoading sold comps…