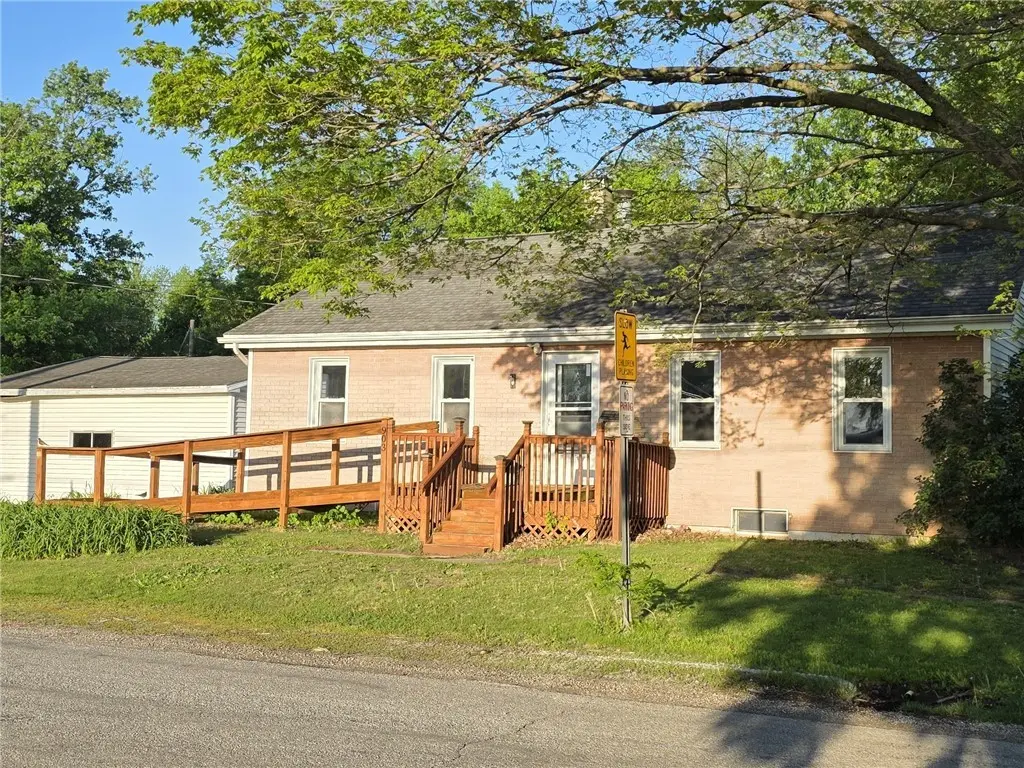
903 N Graham St · Sullivan, IL
Flood risk 1/10 · Minimal
- FEMA flood zone
- X (unshaded)
- Chance of flooding over 30 yrs
- 0.0%
- Est. flood insurance / yr
- $473 – $860
Fire risk 1/10 · Minimal
- Est. fire insurance / yr
- $804 – $1,492
Heat risk 4/10 · Minor
- Hot days now (above 104°F)
- 7 days/yr
- Hot days in 30 yrs
- 20 days/yr
Wind risk 2/10 · Minimal
- Chance of severe wind over 30 yrs
- 2.0%
Air-quality risk 2/10 · Minimal
- Unhealthy air days now
- 1 days/yr
- Unhealthy air days in 30 yrs
- 1 days/yr
Risk factors via First Street. Map © Google.
Why this score? — see what drove the C+ grade
The composite is a weighted blend of 9 inputs, each scored 0–100. Each bar is that input's sub-score; the figure is the points it added to the 100-point composite (weight × sub-score).
- Cash flow +25.1/30.0
- ARV discount +12.0/15.0
- DSCR +8.2/10.0
- 1% rule +5.8/10.0
- Livability +3.2/5.0
- Rent growth +2.5/5.0
- Condition / age +2.5/5.0
- Schools +2.1/10.0
- Appreciation +0.0/10.0
$135,000
🖨 Deal sheet (PDF) 📄 Offer letter ✓ Due diligence
Listing remarks
This family home is ready for you. A functional kitchen to create wonderful meals. A dining room large enough to entertain and a living room with a fireplace for cozy nights. Three main floor bedrooms and a bonus attic space for a 4th bedroom gives everyone their own space. It's carpeted throughout but the closets reveal the original hardwood underneath. A full basement for laundry, storage and projects rounds out this mid-century home. The corner double lot has a spacious and shaded lawn for enjoying the outdoors. The detached garage has space for 3 vehicles and lawn care equipment to keep things neat and tidy. It's a short walk to the schools, parks and civic center for activities. Schedu
Key facts
- Functional kitchen
- Original hardwood
- Full basement
Tags
Property features AI
Exterior
- Parking: Detached garage with 3 spaces
- Utilities: Public water; Public sewer
- Home design: Single-family residence; One-story
- Construction: Vinyl siding; Built as single-family construction
- Exterior features: Shingle roof; Private maintained road access; Private road frontage
Interior
- Kitchen: Range; Range hood; Dishwasher; Refrigerator
- Bathrooms: 1 full bathroom
- Heating & cooling: Natural gas forced-air heating; Central air conditioning
- Interior features: Fireplace (1); Unfinished full basement
- Laundry & utility: Washer; Dryer; Gas water heater
Neighborhood map
What this means for you Summary
Snapshot
- This is a 4-bed/1.0-bath single-family listed at $135k.
Deal economics
- At list price, monthly cash flow is $296 ($4k/yr) — positive.
- The deal already cash-flows at list — no discount required.
- Meets the 1% rule at list price ($1k rent vs $135k).
- Recommended offer: $131k (3.0% below list) — sets the bar for market timing.
- Cap rate 8.9% vs local median 6.4% in Sullivan — top-decile yield for the area; either an underpriced asset or a hidden risk that comps aren't pricing in. Stress-test before assuming the spread holds.
Location & tenants
- Location reads 65/100 on livability (#647 in IL) — a middle-class / working-renter tenant base. Strengths: crime A+, cost of living A+, housing A+; Watch: employment C-, schools F, amenities F.
- Sullivan CUSD 300 (town): math 21% / reading 28% proficiency, ranked #338 of 620 in IL (top 54%) — low school quality limits family demand, transient renter base, plan for 1-2y turnover.
- Market conditions: 42 active listings in the ZIP; 42 units permitted in Moultrie County in 2024 (20 in 5+ unit buildings).
Forward outlook
- Local home prices are declining (-3.0%/yr); year-one equity from $933 of loan paydown is wiped out by about $4k of value loss. Plan a longer hold.
- Moultrie County population projected at -12% by 2050 — secular population decline; favor cash flow + early exit over multi-decade hold.
Negotiation context
- It's been on market 52 days — a 3% lower offer ($131k) is reasonable based on typical stale-listing flexibility.
Risks & watch-outs
- Watch-outs: built in 1952 — expect roof / HVAC / electrical / plumbing capex.
Questions for the listing agent
- It's been on market 52 days. Have you received any prior offers? Is the seller open to a 3% concession, seller financing, or rate buy-down credit?
- Built in 1952 — when were the roof, HVAC, electrical panel, plumbing, and water heater last replaced?
- Is there a deadline driving the sale (1031 exchange, divorce, estate, relocation)? That informs how much negotiation room exists.
- Schools are F-rated, which usually means shorter tenancies and higher turnover. Who's the typical renter profile here, and what's been the actual vacancy rate?
- What's the average days-on-market for RENTAL listings here right now (not sales)? A rising rental-DOM trend means longer vacancies and softer asking-rent achievability than the comps imply.
- What's the recent tenant-quality profile in this submarket — average credit score on applications, eviction rate, late-payment / NSF rate, and stable-employment percentage? A property-management company in the area should have these aggregated.
- How much new for-sale + rental construction is in the pipeline within 1–3 miles? Heavy new supply typically softens prices + rents 12–24 months out; constrained supply supports both.
Investment metrics
- 1% rule
- 1.08% ✓
- Cap rate
- 8.93%
- Cash-on-cash
- 9.41%
- DSCR
- 1.42
- GRM
- 7.7
CMA / ARV
- ARV (median comp)
- $149,948
- List price
- $135,000
- Delta
- -9.97%
- Verdict
- FAIR
- Comps
- 20 within 1.0 mi
Show comp detail 8 sales within ~0.75 mi
| Address | Dist | Beds/Ba | Sqft | Sold | Price | $/sf | Match |
|---|---|---|---|---|---|---|---|
| 818 N Market St | 0.37mi | 4/2.0 | 1,753 (-6%) | 7mo | $230,000 | $131 | 63 |
| 202 E Monroe St | 0.56mi | 3/2.0 (-1) | 1,831 (-2%) | 2mo | $217,000 | $119 | 61 |
| 116 W Strain St | 0.29mi | 4/1.0 | 1,702 (-8%) | 15mo | $112,500 | $66 | 60 |
| 716 W Monroe St | 0.49mi | 4/3.5 | 1,821 (-2%) | 8mo | $195,000 | $107 | 57 |
| 712 W Harrison St | 0.53mi | 4/1.5 | 1,974 (+6%) | 7mo | $120,000 | $61 | 57 |
| 407 N Main St | 0.36mi | 4/2.5 | 2,080 (+12%) | 3mo | $179,900 | $86 | 55 |
| 2 Parkway Dr | 0.13mi | 3/2.0 (-1) | 1,620 (-13%) | 20mo | $144,900 | $89 | 47 |
| 710 N Worth St | 0.40mi | 3/2.0 (-1) | 1,609 (-14%) | 6mo | $200,000 | $124 | 45 |
Match score weights: distance 35% · size 25% · config 20% · recency 20%. Top-matched comps best support the ARV.
Projected returns pro-forma
-3.0% appreciation · 3.0% rent growth · sell at horizon
- IRR
- -2.1%
- Equity multiple
- 0.92×
- Total profit
- $-3,026
- Equity at exit
- $20,129
- IRR
- 7.6%
- Equity multiple
- 1.57×
- Total profit
- $21,564
- Equity at exit
- $11,672
Cash invested: $37,800 (down + closing). Projections, not guarantees.
Landlord ↔ Tenant lean methodology
- Overall (STATE)
- 43 Moderately Tenant-Leaning
- State Illinois
- 43 Moderately Tenant-Leaning · D+7
- County
- — inherits STATE
- City
- — inherits STATE
ZIP-level market 61951
- Home prices YoY
- -7.6%
- Active inventory
- 42
- Price-to-rent
- 7.7×
Monthly cashflow live
- Estimated rent
- $1,456 medium interval (Pro) →
- Mortgage (P&I)
- −$708
- Tax from tax record
- −$90 /mo · $1,075/yr
- Insurance
- −$56
- HOA
- −$0
- Vacancy / Maint / Mgmt
- −$306
- Net cashflow
- $296
Break-even live
Sensitivity live
| Price | -10% $373 | -5% $335 | +0% $296 | +5% $258 | +10% $220 |
|---|---|---|---|---|---|
| Rent | -10% $181 | -5% $239 | +0% $296 | +5% $354 | +10% $411 |
| Rate | -1.0pp $364 | -0.5pp $331 | base $296 | +0.5pp $261 | +1.0pp $226 |
UW: 25.0% down · 7.5% · 30yr · 1.5% tax · 5.0% vac · 8.0% maint · 8.0% mgmt
Financing live
Cash to close
- Down payment
- $33,750
- Closing costs
- $4,050
- Reserves months
- —
- Total cash needed
- —
Loan-product check · same deal, 3 products live
Conventional
25% down · 7.5% · 30yr
- Down + closing
- —
- Monthly P&I
- —
- Monthly cashflow
- —
- DSCR
- —
- Eligible?
- —
Personal DTI + credit; lowest rate.
DSCR
20% down · 8.5% · 30yr
- Down + closing
- —
- Monthly P&I
- —
- Monthly cashflow
- —
- DSCR
- —
- Eligible?
- —
No personal income docs; deal must DSCR.
Hard money
10% down · 12.0% · 12mo
- Down + closing
- —
- Monthly P&I
- —
- Monthly cashflow
- —
- DSCR
- —
- Eligible?
- —
Short-term bridge; refi at stabilization.
Listing history 18 events
-
2026-06-21days on market $135,000 Active 52 DOM
-
2026-06-19days on market $135,000 Active 50 DOM
-
2026-06-18days on market $135,000 Active 49 DOM
-
2026-06-17days on market $135,000 Active 48 DOM
-
2026-06-16days on market $135,000 Active 47 DOM
-
2026-06-15days on market $135,000 Active 46 DOM
-
2026-06-14days on market $135,000 Active 44 DOM
-
2026-06-12days on market $135,000 Active 43 DOM
-
2026-06-09days on market $135,000 Active 40 DOM
-
2026-06-08days on market $135,000 Active 39 DOM
-
2026-06-07days on market $135,000 Active 38 DOM
-
2026-06-05days on market $135,000 Active 35 DOM
-
2026-06-03days on market $135,000 Active 34 DOM
-
2026-06-02days on market $135,000 Active 33 DOM
-
2026-06-01days on market $135,000 Active 32 DOM
-
2026-05-31days on market $135,000 Active 31 DOM
-
2026-05-30days on market $135,000 Active 30 DOM
-
2026-04-30$165,000 Active 736-char remark
ⓘ Source: listings_history table (triggers on properties + properties_extension) + one-shot
backfill from property_details.listing_events for pre-trigger history.
Tax reassessment forecast IL · Partial reset (capped growth)
- Current annual tax
- $1,075 · $90/mo
- Projected year-2 tax
- $2,070 · $172/mo
- Expected delta
- +$995/yr (+$83/mo · 92.5%)
ⓘ Screening estimate from a state-policy table — verify with the county assessor before closing.
Climate risk First Street
- Flood 1/10 Low FEMA zone X (unshaded) · 0% chance over 30 yrs
- Wildfire 1/10 Low
- Heat 4/10 Moderate 7 d/yr ≥104°F today · 20 d/yr by 30 yrs out
- Wind 2/10 Low 2% chance of damaging wind over 30 yrs
- Air quality 2/10 Low 1 unhealthy d/yr today · 1 by 30 yrs out
Nearby sold comps map
Loading sold comps map…
Walkable amenities ~0.75 mi
Loading nearby amenities…
Taxation est. · year 1
- Rental income
- $17,471
- − Mortgage interest
- −$7,562
- − Property taxes
- −$1,075
- − Insurance
- −$675
- − Repairs & maintenance
- −$1,398
- − Management
- −$1,398
- − Depreciation
- −$3,927
- Taxable income
- $1,436
- Est. tax owed @ 24.0%
- −$345
- After-tax cash flow
- $3,212/yr
For passive investors: Depreciation is non-cash, so a rental often shows a tax loss while cash-flowing — sheltering income. Rental losses are passive: they offset passive income freely, and up to $25,000/yr can offset ordinary (W-2) income if you actively participate and your MAGI is under $100k (phasing out to $0 by $150k); unused losses carry forward. On sale, claimed depreciation is recaptured at up to 25%, and gains may owe capital-gains tax (a 1031 exchange can defer both). Figures are a year-1 estimate at your 24.0% rate — not tax advice; consult a CPA.
Schools (NCES district)
- District
- Sullivan CUSD 300
- NCES district ID
- 1738130
- Math proficiency
- 21% ▬ 0.00%
- Reading proficiency
- 28% ▼ -10.00%
- Median HH income
- $47,763
- Composite
- 21.41/100
- National rank
- #8346
- State rank
- #338 of 620 in IL
Livability — Sullivan
- Score
- 65/100
- State rank
- #647
- US rank
- #13204
Category grades
Schools grade is shown separately in the Schools card above.
Census & demographics
- Census place
- Sullivan, IL
- Population (ZIP)
- 7,654
Population outlook (Moultrie County) Hauer SSP2
- Today (2025)
- 14,766 people
- By 2030
- 14,490 · -1.9%
- By 2040
- 13,848 · -6.2%
- By 2050
- 13,063 · -11.5%
- By 2075
- 10,862 · -26.4%
- By 2100
- 7,963 · -46.1%
Race, ethnicity, and origin ACS 2023
- Neighborhood character
- Predominantly White (97%)
- Race & ethnicity
- White 97% Two or more races 2% Black 1%
- Common ancestry
- Lithuanian 1% Italian 1% Slovak 1%
- Foreign-born
- 1%
- Languages at home
- 90% English-only · German/W. Germanic 8% Other Indo-European 1% Spanish 1%
Political lean MEDSL · Moultrie
- 2024 margin
- Solid R (+49.1) · D 24.8% · R 73.8% · Other 1.4%
- 2008→2024 swing
- -36.2pp toward R · 2008: -12.8pp · 2024: -49.1pp
- All cycles
- 2024: R+49.1 2020: R+49.0 2016: R+48.0 2012: R+27.1 2008: R+12.8
Not yet ingested
- Civics
- —
Market trends
- HPI YoY
- ▼ -17.15%
- Current HPI
- 208.2808
- Rent YoY
- —
- Metro
- —
- State GDP YoY
- ▲ 1.59%
- F500 in state
- 60
Industry mix (Fortune 500 HQ in IL)
| Industry | F500 HQs | Revenue |
|---|---|---|
| Insurance | 4 | $201B |
|
||
| Consumer Goods | 4 | $87B |
|
||
| Industrial Machinery | 3 | $64B |
|
||
| Healthcare | 2 | $55B |
|
||
| Retail / Pharmacy | 1 | $148B |
|
||
| Agriculture / Food | 1 | $86B |
|
||
Price history
-18.2% since first listed2 events — show timeline
- 2026-05-29 Price Changed $135,000 CIBR
- 2026-04-30 Listed $165,000 CIBR
Property tax history
-2.4%/yrLatest (2024): $1,075 · +0.3% YoY. Source: county tax records.
Cash-flow waterfall
monthlySold comps — $/sqft
last 12 mo · ≤1 miLoading sold comps…