 Duplex
156 W 84th · Los Angeles, CA
Flood risk 1/10 · Minimal
- FEMA flood zone
- X (unshaded)
- Chance of flooding over 30 yrs
- 0.0%
- Est. flood insurance / yr
- $507 – $1,088
Fire risk 1/10 · Minimal
- Est. fire insurance / yr
- $659 – $1,223
Heat risk 5/10 · Moderate
- Hot days now (above 88°F)
- 7 days/yr
- Hot days in 30 yrs
- 22 days/yr
Wind risk 1/10 · Minimal
- Chance of severe wind over 30 yrs
- —
Air-quality risk 5/10 · Moderate
- Unhealthy air days now
- 7 days/yr
- Unhealthy air days in 30 yrs
- 7 days/yr
Risk factors via First Street. Map © Google.
Why this score? — see what drove the C grade
The composite is a weighted blend of 9 inputs, each scored 0–100. Each bar is that input's sub-score; the figure is the points it added to the 100-point composite (weight × sub-score).
- Cash flow +20.3/30.0
- ARV discount +15.0/15.0
- DSCR +6.5/10.0
- 1% rule +4.0/10.0
- Schools +3.6/10.0
- Livability +3.4/5.0
- Rent growth +2.5/5.0
- Condition / age +2.5/5.0
- Appreciation +0.0/10.0
$549,999
🖨 Deal sheet (PDF) 📄 Offer letter ✓ Due diligence
Multi-family units
County records classify this as Multi-Family (2-4 Unit). Listing-text estimate: 2 units. confirmed
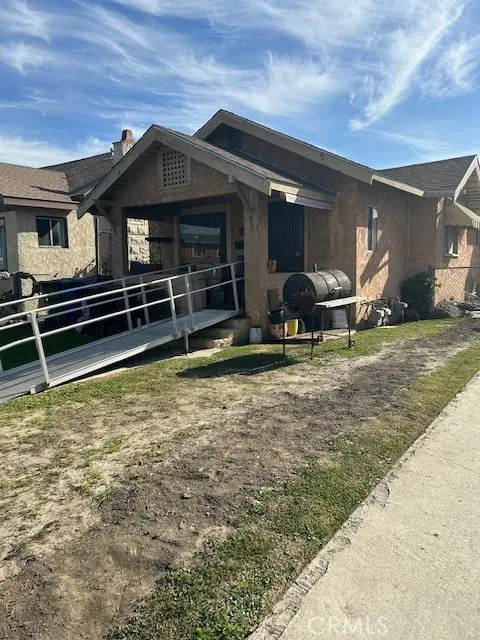
Listing remarks MLS
This property features a 2 bedroom unit in front with two one bedrooms and 2 two bath(duplex in back)City shows 3 bedroom 2 bath in back. Back needs some repair. Shared driveway. All information deemed reliable but not guaranteed. Owner in process of putting carpet, paint and flooring in back unit.
Key facts
- 5,320 sq ft lot
- Built 1920
- Listed 9 days
Property features AI
Finance
- Other: Total of 3 units (multifamily); Parcel number on file
- HOA & community: Street lighting in the community
Exterior
- Utilities: Public sewer; Water source: see remarks
- Home design: Triplex (attached property); Single-story; Entry at level 1
- Construction: Year built per assessor; 2+ common walls (attached units)
- Exterior features: No pool; Lot appears to be 0–1 unit per acre (assessor data)
Interior
- Bedrooms: Main level includes 1 bedroom
- Bathrooms: 3 full bathrooms (one on main level)
- Interior features: All bedrooms located on the ground floor; One-level home
- Laundry & utility: No laundry on site
Neighborhood map
What this means for you Summary
Snapshot
- This is a 2 × 2-bed/?-bath units multifamily listed at $550k.
Deal economics
- At list price, monthly cash flow is $709 ($9k/yr) — positive. Per door: $355/mo.
- The deal already cash-flows at list — no discount required.
- To meet the 1% rule (rent ≥ 1% of price), the offer needs to be $496k (9.8% below list).
- Recommended offer: $496k (9.8% below list) — sets the bar for 1% rule.
- Cap rate 7.8% vs local median 2.1% in Los Angeles — top-decile yield for the area; either an underpriced asset or a hidden risk that comps aren't pricing in. Stress-test before assuming the spread holds.
Location & tenants
- Location reads 68/100 on livability (#273 in CA) — a middle-class / working-renter tenant base. Strengths: amenities A+, commute A+, employment B; Watch: health & safety C-, schools D+, crime F.
- Los Angeles Unified (urban): math 29% / reading 54% proficiency, ranked #223 of 517 in CA (top 43%) — families likely to look elsewhere, expect single-tenant / working-renter base with shorter leases; 67% free/reduced lunch — lower-income household profile, screen leases tightly.
- Market conditions: Rents flat; 161 active listings in the ZIP; 40 comparable units currently listed for rent nearby; rentals lingering (median 45d on market — plan ~5-8 weeks vacancy on turnover, expect pricing pressure); 58% of comp listings sitting > 30 days — soft ceiling on asking rent; 19,697 units permitted in Los Angeles County in 2024 (9,426 in 5+ unit buildings).
- At $4,963/mo this rent would consume 106% of the median local household income ($56k/yr) (locally 4550% of renters already pay >50% of income on rent) — very limited rent-growth headroom before tenants either downsize or default.
Forward outlook
- Local home prices are declining (-3.0%/yr); year-one equity from $4k of loan paydown is wiped out by about $16k of value loss. Plan a longer hold.
- Los Angeles County population projected at +9% by 2050 — modest demand growth; plan on rents tracking national, not racing it.
Negotiation context
- Only 10 days on market — expect competitive offers; lowballing is unlikely to land.
- 2 sale attempts with the ask held roughly flat each time — persistent listings suggest the price (not the market) is what's stuck; bring a comps-based counter.
Risks & watch-outs
- Watch-outs: built in 1920 — expect roof / HVAC / electrical / plumbing capex.
- Climate carrying-cost: extreme-heat days projected 7→22/yr by 2055 (HVAC capex compounding) — expect insurance premiums to compound above CPI over the hold.
Questions for the listing agent
- Can we see the unit-by-unit rent roll, current vacancy, and any below-market leases? What's the average tenancy length?
- What capital expenditures (roof, boiler, parking lot, exteriors) have been made in the last 5 years, and what's planned in the next 2?
- Built in 1920 — when were the roof, HVAC, electrical panel, plumbing, and water heater last replaced?
- Is there a deadline driving the sale (1031 exchange, divorce, estate, relocation)? That informs how much negotiation room exists.
- Schools are D-rated, which usually means shorter tenancies and higher turnover. Who's the typical renter profile here, and what's been the actual vacancy rate?
- Crime grade is F in this area — have there been break-ins, vandalism, or insurance claims at this property in the last 3 years? What carrier currently insures it and at what premium?
- What's the average days-on-market for RENTAL listings here right now (not sales)? A rising rental-DOM trend means longer vacancies and softer asking-rent achievability than the comps imply.
- What's the recent tenant-quality profile in this submarket — average credit score on applications, eviction rate, late-payment / NSF rate, and stable-employment percentage? A property-management company in the area should have these aggregated.
- How much new apartment / multifamily construction is in the pipeline within 1–3 miles? Heavy new supply (>2% of stock underway) typically softens rents 12–24 months out; light construction supports rent growth.
Investment metrics
- 1% rule
- 0.90% ✗
- Cap rate
- 7.84%
- Cash-on-cash
- 5.53%
- DSCR
- 1.25
- GRM
- 9.2
CMA / ARV
- ARV (median comp)
- $729,993
- List price
- $549,999
- Delta
- -23.29%
- Verdict
- UNDERPRICED
- Comps
- 20 within 1.0 mi
Show comp detail 6 sales within ~0.75 mi
| Address | Dist | Beds/Ba | Sqft | Sold | Price | $/sf | Match |
|---|---|---|---|---|---|---|---|
| 233 W 88th St | 0.34mi | 4/3.0 (+1) | 1,907 (+1%) | 2mo | $520,000 | $273 | 72 |
| 240 E 84th St | 0.31mi | 4/1.0 (+1) | 2,039 (+8%) | 14mo | $890,000 | $436 | 51 |
| 253 E 82nd | 0.41mi | 4/2.0 (+1) | 1,612 (-14%) | 3mo | $750,000 | $465 | 49 |
| 8110 S Main St | 0.28mi | 4/4.0 (+1) | 1,728 (-8%) | 16mo | $580,000 | $336 | 46 |
| 447 W 84th St | 0.36mi | 4/2.0 (+1) | 1,702 (-10%) | 21mo | $675,000 | $397 | 44 |
| 636 W 81st St | 0.59mi | 4/4.0 (+1) | 2,088 (+11%) | 20mo | $950,000 | $455 | 25 |
Match score weights: distance 35% · size 25% · config 20% · recency 20%. Top-matched comps best support the ARV.
Projected returns pro-forma
-3.0% appreciation · 0.11% rent growth · sell at horizon
- IRR
- -10.7%
- Equity multiple
- 0.62×
- Total profit
- $-58,259
- Equity at exit
- $82,007
- IRR
- -5.4%
- Equity multiple
- 0.69×
- Total profit
- $-48,048
- Equity at exit
- $47,554
Cash invested: $154,000 (down + closing). Projections, not guarantees.
Landlord ↔ Tenant lean methodology
- Overall (CITY)
- 0 Strongly Tenant-Friendly
- State California
- 18 Strongly Tenant-Friendly · D+13
- County
- — inherits STATE
- City Los Angeles
- 0 Strongly Tenant-Friendly · D+22
ZIP-level market 90003
- Rents YoY
- 0.1%
- Active inventory
- 161
- Price-to-rent
- 18.5×
Monthly cashflow live
- Estimated rent
- $4,963 high interval (Pro) →
- Mortgage (P&I)
- −$2,884
- Tax from tax record
- −$98 /mo · $1,176/yr
- Insurance
- −$229
- HOA
- −$0
- Vacancy / Maint / Mgmt
- −$1,042
- Net cashflow
- $709
Break-even live
Sensitivity live
| Price | -10% $1,021 | -5% $865 | +0% $709 | +5% $554 | +10% $-260 |
|---|---|---|---|---|---|
| Rent | -10% $317 | -5% $513 | +0% $709 | +5% $905 | +10% $1,101 |
| Rate | -1.0pp $986 | -0.5pp $849 | base $709 | +0.5pp $567 | +1.0pp $422 |
2-unit breakdown (identical units grouped — click to expand)
| Units | Beds | Baths | Est. rent |
|---|---|---|---|
| 2× units | 2 | — | $4,962 |
| #1 | 2 | — | $2,481 |
| #2 | 2 | — | $2,481 |
| Total (2 units) | $4,963 | ||
UW: 25.0% down · 7.5% · 30yr · 1.5% tax · 5.0% vac · 8.0% maint · 8.0% mgmt
Financing live
Cash to close
- Down payment
- $137,500
- Closing costs
- $16,500
- Reserves months
- —
- Total cash needed
- —
Loan-product check · same deal, 3 products live
Conventional
25% down · 7.5% · 30yr
- Down + closing
- —
- Monthly P&I
- —
- Monthly cashflow
- —
- DSCR
- —
- Eligible?
- —
Personal DTI + credit; lowest rate.
DSCR
20% down · 8.5% · 30yr
- Down + closing
- —
- Monthly P&I
- —
- Monthly cashflow
- —
- DSCR
- —
- Eligible?
- —
No personal income docs; deal must DSCR.
Hard money
10% down · 12.0% · 12mo
- Down + closing
- —
- Monthly P&I
- —
- Monthly cashflow
- —
- DSCR
- —
- Eligible?
- —
Short-term bridge; refi at stabilization.
Rent comps 40 comps
| Address | Beds | Baths | Sqft | Rent | $/sqft | DOM | Units | Dist |
|---|---|---|---|---|---|---|---|---|
| 116 E 82nd St Los Angeles, CA | 4.0 | 2.0 | 1240 | $3,750 | $3.02 | 44d | 1 | 0.27mi |
| 240 E 84th St Los Angeles, CA | 2.0 | 1.0 | 2039 | $1,950 | $0.96 | 25d | 1 | 0.32mi |
| 263 E 84th Pl Los Angeles, CA | 3.0 | 1.0 | 1450 | $2,950 | $2.03 | 15d | 1 | 0.36mi |
| 249 E 82nd St Los Angeles, CA | 4.0 | 2.0 | 1300 | $2,750 | $2.12 | 44d | 1 | 0.42mi |
| 520 W 82nd St Unit 520- A Los Angeles, CA | 4.0 | 2.0 | 1519 | $3,795 | $2.50 | 44d | 1 | 0.46mi |
| 624 W 83rd St Unit 624 1/2 Los Angeles, CA | 4.0 | 4.0 | 1400 | $3,600 | $2.57 | 44d | 1 | 0.52mi |
| 239 E 90th St Los Angeles, CA | 3.0 | 2.0 | 1260 | $3,295 | $2.62 | 11d | 1 | 0.59mi |
| 707 W 80th St Unit 80709BE Los Angeles, CA | 4.0 | 2.0 | 1507 | $3,500 | $2.32 | 17d | 1 | 0.65mi |
| 707 W 80th St Unit 80703FW Los Angeles, CA | 4.0 | 4.5 | 1765 | $3,900 | $2.21 | 17d | 1 | 0.65mi |
| 707 W 80th St Unit 80705FE Los Angeles, CA | 4.0 | 4.0 | 1710 | $3,700 | $2.16 | 17d | 1 | 0.65mi |
| 703 W 80th St Los Angeles, CA | 4.0 | 4.0 | 1765 | $3,900 | $2.21 | 44d | 1 | 0.65mi |
| 705 W 80th St Los Angeles, CA | 4.0 | 4.0 | 1710 | $3,700 | $2.16 | 44d | 1 | 0.66mi |
| 709 W 80th St Los Angeles, CA | 4.0 | 2.0 | 1507 | $3,500 | $2.32 | 44d | 1 | 0.66mi |
| 9197 Wall St Los Angeles, CA | 3.0 | 2.0 | 1250 | $3,500 | $2.80 | 44d | 1 | 0.67mi |
| 650 E 81st St Los Angeles, CA | 4.0 | 2.0 | 1944 | $3,500 | $1.80 | 44d | 1 | 0.77mi |
| 8640 Baring Cross St Los Angeles, CA | 4.0 | 2.0 | 1285 | $3,700 | $2.88 | 25d | 1 | 0.78mi |
| 9017 Avalon Blvd Los Angeles, CA | 3.0 | 2.0 | 1234 | $3,000 | $2.43 | 44d | 1 | 0.81mi |
| 447 W 74th St Los Angeles, CA | 2.0 | 1.0 | 1411 | $2,800 | $1.98 | 25d | 1 | 0.82mi |
| 130 E 95th St Los Angeles, CA | 4.0 | 2.0 | 1275 | $3,500 | $2.75 | 21d | 1 | 0.85mi |
| 156 E Colden Ave Los Angeles, CA | 2.0 | 1.0 | 2524 | $2,900 | $1.15 | 44d | 1 | 0.92mi |
| 136 W 97th St Unit 138 Los Angeles, CA | 4.0 | 2.0 | 1275 | $3,490 | $2.74 | 14d | 1 | 0.96mi |
| 219 E 71st St Los Angeles, CA | 3.0 | 2.0 | 1680 | $3,575 | $2.13 | 44d | 1 | 0.98mi |
| 909 E 83rd St Los Angeles, CA | 4.0 | 2.0 | 1400 | $3,888 | $2.78 | 44d | 1 | 1.03mi |
| 121 W Century Blvd Los Angeles, CA | 4.0 | 2.0 | 1275 | $3,885 | $3.05 | 44d | 1 | 1.12mi |
| 234 E 99th St Los Angeles, CA | 4.0 | 2.0 | 1275 | $3,850 | $3.02 | 44d | 1 | 1.13mi |
| 447 W 69th St Los Angeles, CA | 2.0 | 1.0 | 2400 | $2,500 | $1.04 | 44d | 1 | 1.13mi |
| 1018 E 79th St Los Angeles, CA | 2.0 | 2.0 | 2380 | $2,500 | $1.05 | 14d | 1 | 1.15mi |
| 915 E 91st St Unit 915 Los Angeles, CA | 3.0 | 1.0 | 1800 | $3,200 | $1.78 | 44d | 1 | 1.17mi |
| 1110 W 92nd St Los Angeles, CA | 3.0 | 2.5 | 2112 | $3,495 | $1.65 | 25d | 1 | 1.22mi |
| 1231 W 87th St Los Angeles, CA | 3.0 | 2.0 | 1310 | $3,925 | $3.00 | 19d | 1 | 1.22mi |
| 606 E 99th St Los Angeles, CA | 3.0 | 2.0 | 1798 | $3,650 | $2.03 | 0d | 1 | 1.24mi |
| 245 W 66th St Los Angeles, CA | 2.0 | 1.0 | 1426 | $2,950 | $2.07 | 8d | 1 | 1.25mi |
| 1228 W 89th St Los Angeles, CA | 3.0 | 2.5 | 1300 | $3,200 | $2.46 | 44d | 1 | 1.26mi |
| 8416 Hooper Ave Los Angeles, CA | 4.0 | 3.0 | 1600 | $3,350 | $2.09 | 44d | 1 | 1.28mi |
| 352 E 101st St Los Angeles, CA | 4.0 | 2.0 | 1275 | $3,500 | $2.75 | 44d | 1 | 1.30mi |
| 1159 E 78th St Los Angeles, CA | 4.0 | 2.0 | 1300 | $3,950 | $3.04 | 44d | 1 | 1.31mi |
| 1312 W Manchester Ave Los Angeles, CA | 4.0 | 3.0 | 2475 | $4,000 | $1.62 | 44d | 1 | 1.32mi |
| 1012 E 73rd St Los Angeles, CA | 3.0 | 3.0 | 1257 | $3,400 | $2.70 | 25d | 1 | 1.34mi |
| 1310 W 89th St Unit 1310 Los Angeles, CA | 2.0 | 1.0 | 1480 | $2,400 | $1.62 | 44d | 1 | 1.35mi |
| 1310 W 89th St Unit 1310-5 Los Angeles, CA | 2.0 | 1.0 | 1480 | $2,350 | $1.59 | 13d | 1 | 1.35mi |
Listing history 18 events
-
2026-06-21days on market $549,999 Active 10 DOM
-
2026-06-18days on market $549,999 Active 7 DOM
-
2026-06-17remarks 286-char remark
-
2026-06-17days on market $549,999 Active 6 DOM
-
2026-06-16days on market $549,999 Active 5 DOM
-
2026-06-15days on market $549,999 Active 4 DOM
-
2026-06-13remarks 209-char remark
Show marketing remark (299 chars)
This property features a 2 bedroom unit in front with two one bedrooms and 2 two bath(duplex in back)City shows 3 bedroom 2 bath in back. Back needs some repair. Shared driveway. All information deemed reliable but not guaranteed. Owner in process of putting carpet, paint and flooring in back unit.
-
2026-06-13pricedays on market $549,999 Active 2 DOM
Show marketing remark (299 chars)
This property features a 2 bedroom unit in front with two one bedrooms and 2 two bath(duplex in back)City shows 3 bedroom 2 bath in back. Back needs some repair. Shared driveway. All information deemed reliable but not guaranteed. Owner in process of putting carpet, paint and flooring in back unit.
-
2026-06-09pricedays on market $559,999 Active 63 DOM
-
2026-06-08days on market $599,999 Active 62 DOM
Show marketing remark (299 chars)
This property features a 2 bedroom unit in front with two one bedrooms and 2 two bath(duplex in back)City shows 3 bedroom 2 bath in back. Back needs some repair. Shared driveway. All information deemed reliable but not guaranteed. Owner in process of putting carpet, paint and flooring in back unit.
-
2026-06-07days on market $599,999 Active 61 DOM
-
2026-06-04days on market $599,999 Active 58 DOM
-
2026-06-03days on market $599,999 Active 57 DOM
-
2026-06-02days on market $599,999 Active 56 DOM
-
2026-06-01days on market $599,999 Active 55 DOM
-
2026-05-31days on market $599,999 Active 54 DOM
-
2026-04-30price $599,999 190-char remark
Show marketing remark (299 chars)
This property features a 2 bedroom unit in front with two one bedrooms and 2 two bath(duplex in back)City shows 3 bedroom 2 bath in back. Back needs some repair. Shared driveway. All information deemed reliable but not guaranteed. Owner in process of putting carpet, paint and flooring in back unit.
-
2026-04-07$659,999 Active 190-char remark
Show marketing remark (299 chars)
This property features a 2 bedroom unit in front with two one bedrooms and 2 two bath(duplex in back)City shows 3 bedroom 2 bath in back. Back needs some repair. Shared driveway. All information deemed reliable but not guaranteed. Owner in process of putting carpet, paint and flooring in back unit.
ⓘ Source: listings_history table (triggers on properties + properties_extension) + one-shot
backfill from property_details.listing_events for pre-trigger history.
Tax reassessment forecast CA · Resets to sale price
- Current annual tax
- $1,176 · $98/mo
- Projected year-2 tax
- $4,180 · $348/mo
- Expected delta
- +$3,004/yr (+$250/mo · 255.4%)
ⓘ Screening estimate from a state-policy table — verify with the county assessor before closing.
Climate risk First Street
- Flood 1/10 Low FEMA zone X (unshaded) · 0% chance over 30 yrs
- Wildfire 1/10 Low
- Heat 5/10 Major 7 d/yr ≥88°F today · 22 d/yr by 30 yrs out
- Wind 1/10 Low
- Air quality 5/10 Major 7 unhealthy d/yr today · 7 by 30 yrs out
Nearby sold comps map
Loading sold comps map…
Walkable amenities ~0.75 mi
Loading nearby amenities…
Taxation est. · year 1
- Rental income
- $59,556
- − Mortgage interest
- −$30,808
- − Property taxes
- −$1,176
- − Insurance
- −$2,750
- − Repairs & maintenance
- −$4,764
- − Management
- −$4,764
- − Depreciation
- −$16,000
- Taxable loss
- −$707
- Est. tax savings @ 24.0%
- +$170
- After-tax cash flow
- $8,682/yr
For passive investors: Depreciation is non-cash, so a rental often shows a tax loss while cash-flowing — sheltering income. Rental losses are passive: they offset passive income freely, and up to $25,000/yr can offset ordinary (W-2) income if you actively participate and your MAGI is under $100k (phasing out to $0 by $150k); unused losses carry forward. On sale, claimed depreciation is recaptured at up to 25%, and gains may owe capital-gains tax (a 1031 exchange can defer both). Figures are a year-1 estimate at your 24.0% rate — not tax advice; consult a CPA.
Schools (NCES district)
- District
- Los Angeles Unified
- NCES district ID
- 0622710
- Math proficiency
- 29% ▼ -4.00%
- Reading proficiency
- 54% ▲ 10.00%
- Median HH income
- $50,403
- Composite
- 35.67/100
- National rank
- #4875
- State rank
- #223 of 517 in CA
Livability — Los Angeles
- Score
- 68/100
- State rank
- #273
- US rank
- #9237
Category grades
Schools grade is shown separately in the Schools card above.
Census & demographics
- Census place
- Los Angeles, CA
- County
- Los Angeles County · 9,444,647 people
- City population
- 3,838,149
- Metro
- Los Angeles-Long Beach-Anaheim, CA
- Population (ZIP)
- 70,065
- Household income
- $56,030
- Rent vs Own
- Severe rent burden
- 4550.0
Population outlook (Los Angeles County) Hauer SSP2
- Today (2025)
- 10,940,515 people
- By 2030
- 11,256,481 · +2.9%
- By 2040
- 11,729,929 · +7.2%
- By 2050
- 11,948,407 · +9.2%
- By 2075
- 11,818,114 · +8.0%
- By 2100
- 10,842,928 · -0.9%
Race, ethnicity, and origin ACS 2023
- Neighborhood character
- Predominantly Hispanic (81%)
- Race & ethnicity
- Hispanic / Latino 81% Two or more races 20% Black 16% Native American 1%
- Hispanic origin (detail)
- Mexican 51%
- Common ancestry
- British 1%
- Foreign-born
- 40% · Canada
- Languages at home
- 24% English-only · Spanish 75%
Political lean MEDSL · Los Angeles
- 2024 margin
- Solid D (+32.9) · D 64.8% · R 31.9% · Other 3.3%
- 2008→2024 swing
- -7.4pp toward R · 2008: 40.4pp · 2024: 32.9pp
- All cycles
- 2024: D+32.9 2020: D+44.2 2016: D+48.0 2012: D+40.0 2008: D+40.4
Not yet ingested
- Civics
- —
Market trends
- HPI YoY
- ▼ -785.95%
- Current HPI
- 512.5667
- Rent YoY
- ▲ 0.11%
- Metro
- Los Angeles-Long Beach-Anaheim, CA
- State GDP YoY
- ▲ 3.21%
- F500 in state
- 116
Industry mix (Fortune 500 HQ in CA)
| Industry | F500 HQs | Revenue |
|---|---|---|
| Technology | 27 | $1,492B |
|
||
| Financial Services | 3 | $174B |
|
||
| Retail | 3 | $44B |
|
||
| Insurance | 3 | $26B |
|
||
| Media / Entertainment | 2 | $115B |
|
||
| Pharmaceuticals / Biotech | 2 | $62B |
|
||
Price history
-16.7% since first listed5 events — show timeline
- 2026-06-13 Price Changed $549,999 CRMLS
- 2026-06-11 Listed $549,999 CRMLS
- 2026-06-08 Price Changed $559,999 CRMLS
- 2026-04-30 Price Changed $599,999 CRMLS
- 2026-04-07 Listed $659,999 CRMLS
Property tax history
+2.1%/yrLatest (2025): $1,176 · +5.5% YoY. Source: county tax records.
Cash-flow waterfall
monthlySold comps — $/sqft
last 12 mo · ≤1 miLoading sold comps…