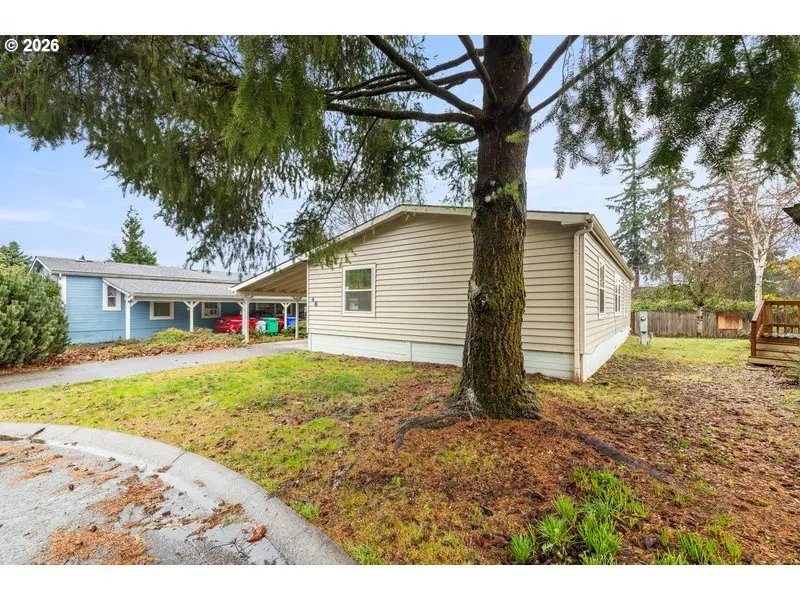
16000 SE Powell Blvd #48 · Portland, OR
Flood risk 1/10 · Minimal
- FEMA flood zone
- X (unshaded)
- Chance of flooding over 30 yrs
- 0.0%
- Est. flood insurance / yr
- $507 – $1,088
Fire risk 3/10 · Minor
- Est. fire insurance / yr
- $498 – $926
Heat risk 3/10 · Minor
- Hot days now (above 92°F)
- 7 days/yr
- Hot days in 30 yrs
- 15 days/yr
Wind risk 1/10 · Minimal
- Chance of severe wind over 30 yrs
- —
Air-quality risk 10/10 · Severe
- Unhealthy air days now
- 23 days/yr
- Unhealthy air days in 30 yrs
- 27 days/yr
Risk factors via First Street. Map © Google.
Why this score? — see what drove the C+ grade
The composite is a weighted blend of 9 inputs, each scored 0–100. Each bar is that input's sub-score; the figure is the points it added to the 100-point composite (weight × sub-score).
- Cash flow +30.0/30.0
- DSCR +10.0/10.0
- 1% rule +9.1/10.0
- Livability +3.9/5.0
- Schools +3.5/10.0
- Rent growth +2.9/5.0
- Condition / age +2.5/5.0
- ARV discount +0.0/15.0
- Appreciation +0.0/10.0
$139,000
🖨 Deal sheet 📄 Offer letter ✓ Due diligence
Listing remarks MLS
Just like brand new! This beautifully remodeled home has been updated from tip to tail and is filled with light throughout. The kitchen shines with a skylight, creating a bright and welcoming space that flows into both a cozy breakfast nook and a formal dining room—perfect for everyday living or hosting gatherings. The spacious living room offers plenty of room for entertaining, while the private primary retreat provides a peaceful escape complete with a walk-in closet and its own bathroom. Additional bedrooms are generously sized, offering flexibility for family, guests, or a home office. Step outside to a nicely sized yard ready for your garden ideas, play space, or outdoor entertaining. Conveniently located close to public transit, shopping, and restaurants, and just minutes from Powell Butte Nature Park with miles of scenic walking and biking trails.
Key facts
- Breakfast nook
- Formal dining room
- Skylight
Tags
Neighborhood map
What this means for you Summary
Snapshot
- This is a 3-bed/2.0-bath manufactured listed at $139k.
Deal economics
- At list price, monthly cash flow is $727 ($9k/yr) — positive.
- The deal already cash-flows at list — no discount required.
- Meets the 1% rule at list price ($2k rent vs $139k).
- Recommended offer: $126k (9.0% below list) — sets the bar for market timing.
- Cap rate 12.6% vs local median 2.2% in Portland — top-decile yield for the area; either an underpriced asset or a hidden risk that comps aren't pricing in. Stress-test before assuming the spread holds.
Location & tenants
- Location reads 77/100 on livability (#72 in OR, #3,256 nationally) — a middle-class / working-renter tenant base. Strengths: amenities A+, commute A+, health & safety A+; Watch: crime F, cost of living F.
- Centennial SD 28J (suburban): math 31% / reading 43% proficiency, ranked #125 of 183 in OR (top 68%) — families likely to look elsewhere, expect single-tenant / working-renter base with shorter leases.
- Market conditions: Rents rising (+1.6%/yr); 204 active listings in the ZIP; 40 comparable units currently listed for rent nearby; rentals at typical pace (median 22d on market — plan ~3-4 weeks tenant-placement turnaround); solid renter incomes; 2,041 units permitted in Multnomah County in 2024 (905 in 5+ unit buildings).
- This rent runs 31% of the median local income ($75k/yr) — at the standard rent-burdened threshold; future hikes will face affordability resistance.
Forward outlook
- Local home prices are declining (-3.0%/yr); year-one equity from $961 of loan paydown is wiped out by about $4k of value loss. Plan a longer hold.
- Multnomah County population projected at +33% by 2050 — long-run rental-demand tailwind backs the buy-and-hold thesis.
- At projected returns (-3.0% appreciation + 1.6% rent growth), your $39k cash investment doubles in ~6 years — after that, you're playing with house money.
Negotiation context
- It's been on market 104 days — a 9% lower offer ($126k) is reasonable based on typical stale-listing flexibility.
Questions for the listing agent
- It's been on market 104 days. Have you received any prior offers? Is the seller open to a 9% concession, seller financing, or rate buy-down credit?
- Why hasn't it sold? Are there any deal-killer items the seller is aware of (foundation, flood, title, zoning, code violations)?
- Is there a deadline driving the sale (1031 exchange, divorce, estate, relocation)? That informs how much negotiation room exists.
- Crime grade is F in this area — have there been break-ins, vandalism, or insurance claims at this property in the last 3 years? What carrier currently insures it and at what premium?
- What's the average days-on-market for RENTAL listings here right now (not sales)? A rising rental-DOM trend means longer vacancies and softer asking-rent achievability than the comps imply.
- What's the recent tenant-quality profile in this submarket — average credit score on applications, eviction rate, late-payment / NSF rate, and stable-employment percentage? A property-management company in the area should have these aggregated.
- How much new for-sale + rental construction is in the pipeline within 1–3 miles? Heavy new supply typically softens prices + rents 12–24 months out; constrained supply supports both.
Investment metrics
- 1% rule
- 1.41% ✓
- Cap rate
- 12.57%
- Cash-on-cash
- 22.42%
- DSCR
- 2.00
- GRM
- 5.9
CMA / ARV
- ARV (median comp)
- $108,874
- List price
- $139,000
- Delta
- 27.67%
- Verdict
- OVERPRICED
- Comps
- 20 within 1.0 mi
Show comp detail 6 sales within ~0.75 mi
| Address | Dist | Beds/Ba | Sqft | Sold | Price | $/sf | Match |
|---|---|---|---|---|---|---|---|
| 16000 SE Powell Blvd #16 | 0.14mi | 3/2.0 | 1,404 (0%) | 8mo | $69,985 | $50 | 86 |
| 3930 SE 162nd Ave #4 | 0.05mi | 3/2.0 | 1,456 (+4%) | 11mo | $119,999 | $82 | 82 |
| 16000 SE Powell Blvd #76 | 0.07mi | 3/2.0 | 1,456 (+4%) | 22mo | $138,000 | $95 | 72 |
| 15768 SE Powell Blvd #13 | 0.21mi | 3/2.0 | 1,568 (+12%) | 9mo | $149,900 | $96 | 63 |
| 3930 SE 162nd Ave | 0.09mi | 2/2.0 (-1) | 1,568 (+12%) | 13mo | $113,500 | $72 | 60 |
| 15768 SE Powell Blvd #45 | 0.21mi | 3/2.0 | 1,232 (-12%) | 14mo | $93,000 | $75 | 58 |
Match score weights: distance 35% · size 25% · config 20% · recency 20%. Top-matched comps best support the ARV.
Projected returns pro-forma
-3.0% appreciation · 1.64% rent growth · sell at horizon
- IRR
- 13.8%
- Equity multiple
- 1.54×
- Total profit
- $21,091
- Equity at exit
- $20,725
- IRR
- 21.6%
- Equity multiple
- 2.73×
- Total profit
- $67,223
- Equity at exit
- $12,018
Cash invested: $38,920 (down + closing). Projections, not guarantees.
Landlord ↔ Tenant lean methodology
- Overall (CITY)
- 0 Strongly Tenant-Friendly
- State Oregon
- 28 Tenant-Leaning · D+6
- County
- — inherits STATE
- City Portland
- 0 Strongly Tenant-Friendly · D+39
ZIP-level market 97236
- Rents YoY
- 1.6%
- Active inventory
- 204
- Price-to-rent
- 5.9×
Monthly cashflow live
- Estimated rent
- $1,956 high interval (Pro) →
- Mortgage (P&I)
- −$729
- Tax from tax record
- −$31 /mo · $374/yr
- Insurance
- −$58
- HOA
- −$0
- Vacancy / Maint / Mgmt
- −$411
- Net cashflow
- $727
Break-even live
UW: 25.0% down · 7.5% · 30yr · 1.5% tax · 5.0% vac · 8.0% maint · 8.0% mgmt
Financing live
Cash to close
- Down payment
- $34,750
- Closing costs
- $4,170
- Reserves months
- —
- Total cash needed
- —
Loan-product check · same deal, 3 products live
Conventional
25% down · 7.5% · 30yr
- Down + closing
- —
- Monthly P&I
- —
- Monthly cashflow
- —
- DSCR
- —
- Eligible?
- —
Personal DTI + credit; lowest rate.
DSCR
20% down · 8.5% · 30yr
- Down + closing
- —
- Monthly P&I
- —
- Monthly cashflow
- —
- DSCR
- —
- Eligible?
- —
No personal income docs; deal must DSCR.
Hard money
10% down · 12.0% · 12mo
- Down + closing
- —
- Monthly P&I
- —
- Monthly cashflow
- —
- DSCR
- —
- Eligible?
- —
Short-term bridge; refi at stabilization.
Rent comps 40 comps
| Address | Beds | Baths | Sqft | Rent | $/sqft | DOM | Units | Dist |
|---|---|---|---|---|---|---|---|---|
| 16804 SE Powell Blvd Portland, OR | 3.0 | 3.0 | 1564 | $2,350 | $1.50 | 23d | 1 | 0.35mi |
| 16804 SE Powell Blvd Portland, OR | 2.0 | 2.0 | 1101 | $1,625 | $1.48 | 10d | 1 | 0.35mi |
| 16804 SE Powell Blvd Portland, OR | 2.0 | 2.0 | 1070 | $1,675 | $1.57 | 14d | 1 | 0.35mi |
| 16804 SE Powell Blvd Unit 18-201 Portland, OR | 2.0 | 2.0 | 1070 | $1,675 | $1.57 | 21d | 1 | 0.35mi |
| 16804 SE Powell Blvd Unit 04-101 Portland, OR | 3.0 | 2.5 | 1564 | $2,350 | $1.50 | 21d | 1 | 0.35mi |
| 16804 SE Powell Blvd Unit 12-102 Portland, OR | 2.0 | 2.0 | 1070 | $1,725 | $1.61 | 21d | 1 | 0.35mi |
| 16804 SE Powell Blvd Unit 08-202 Portland, OR | 2.0 | 2.0 | 1070 | $1,395 | $1.30 | 21d | 1 | 0.35mi |
| 16824 SE Powell Blvd Portland, OR | 2.0 | 2.0 | 1070 | $1,720 | $1.61 | 4d | 5 | 0.36mi |
| 16811 SE Francis St Portland, OR | 3.0 | 1.0 | 1488 | $2,600 | $1.75 | 14d | 1 | 0.38mi |
| 3332 SE 157th Ave Portland, OR | 3.0 | 1.0 | 1000 | $2,495 | $2.50 | 43d | 1 | 0.39mi |
| 16916 SE Powell Blvd Portland, OR | 2.0 | 2.0 | 1070 | $1,695 | $1.58 | 43d | 1 | 0.39mi |
| 15075 SE Powell Blvd Portland, OR | 3.0 | 3.5 | 1500 | $2,295 | $1.53 | 4d | 3 | 0.61mi |
| 15075 SE Powell Blvd Apt 4 Portland, OR | 3.0 | 3.5 | 1500 | $2,395 | $1.60 | 43d | 1 | 0.61mi |
| 17310 SE Naegeli Dr Portland, OR | 2.0 | 2.0 | 990 | $1,562 | $1.58 | 1d | 5 | 0.63mi |
| 3318 SE 148th Ave Portland, OR | 2.0 | 1.5 | 950 | $1,750 | $1.84 | 17d | 1 | 0.72mi |
| 2641 SE 168th Ave Portland, OR | 3.0 | 1.5 | 1144 | $2,700 | $2.36 | 43d | 1 | 0.72mi |
| 14915 SE Woodward St Portland, OR | 4.0 | 2.0 | 1608 | $2,850 | $1.77 | 2d | 1 | 0.78mi |
| 15301-15353 SE Division St Unit 15301 Portland, OR | 2.0 | 1.5 | 1000 | $1,500 | $1.50 | 43d | 1 | 0.85mi |
| 14992 SE Division St Unit 3 Bedroom Portland, OR | 3.0 | 1.0 | 909 | $1,350 | $1.49 | 43d | 1 | 0.88mi |
| 14992 SE Division St Portland, OR | 1.0–3.0 | 1.0 | 726 | $1,350 | $1.86 | 16d | 3 | 0.88mi |
| 3414 SE 143rd Ave Portland, OR | 2.0 | 2.0 | 1000 | $1,650 | $1.65 | 7d | 2 | 0.94mi |
| 4777 SW 11th St Gresham, OR | 2.0–3.0 | 2.0 | 1042 | $2,134 | $2.05 | 1d | 5 | 0.95mi |
| 4850 SW 11th St Gresham, OR | 2.0 | 2.0 | 1075 | $1,575 | $1.47 | 4d | 2 | 0.95mi |
| 2333 SE 174th Ave Unit 2333 Portland, OR | 2.0 | 1.5 | 1000 | $1,649 | $1.65 | 23d | 1 | 0.98mi |
| 2329 SE 174th Ave Unit 2329 Portland, OR | 2.0 | 1.5 | 995 | $1,695 | $1.70 | 43d | 1 | 1.00mi |
| 17726 SE Division St Portland, OR | 1.0–2.0 | 1.0–1.5 | 788 | $1,575 | $2.00 | 11d | 3 | 1.07mi |
| 2609 SE 145th Ave Unit H-77 Portland, OR | 3.0 | 1.5 | 1117 | $1,504 | $1.35 | 17d | 1 | 1.07mi |
| 2609 SE 145th Ave Unit C-19 Portland, OR | 3.0 | 1.5 | 1117 | $1,499 | $1.34 | 17d | 1 | 1.07mi |
| 16456 SE Stephens Ct Portland, OR | 3.0 | 1.5 | 1280 | $2,495 | $1.95 | 2d | 1 | 1.08mi |
| 1811 SE 162nd Ave Portland, OR | 3.0 | 1.5 | 1092 | $2,295 | $2.10 | 23d | 1 | 1.10mi |
| 13938 SE Powell Blvd Unit 2 Portland, OR | 2.0 | 1.0 | 900 | $1,535 | $1.71 | 43d | 1 | 1.12mi |
| 17924 SE Division St Portland, OR | 2.0–3.0 | 1.0 | 770 | $1,545 | $2.01 | 43d | 3 | 1.13mi |
| 13746 SE Powell Blvd Portland, OR | 2.0–3.0 | 1.0 | 763 | $1,325 | $1.74 | 3d | 2 | 1.22mi |
| 1640 SE 162nd Ave Portland, OR | 2.0 | 1.5 | 950 | $1,295 | $1.36 | 43d | 2 | 1.22mi |
| 15041 SE Millmain Dr Portland, OR | 3.0 | 1.0 | 1000 | $2,220 | $2.22 | 43d | 1 | 1.25mi |
| 14909 SE Mill St Portland, OR | 3.0 | 1.0 | 1550 | $2,495 | $1.61 | 20d | 1 | 1.29mi |
| 5524 SE 140th Pl Portland, OR | 4.0 | 3.0 | 1584 | $3,050 | $1.93 | 17d | 1 | 1.30mi |
| 3208 SE 136th Ave Unit 3 Portland, OR | 3.0 | 1.5 | 1217 | $1,597 | $1.31 | 23d | 1 | 1.30mi |
| 3208 SE 136th Ave Unit 45 Portland, OR | 2.0 | 1.5 | 900 | $1,397 | $1.55 | 23d | 1 | 1.30mi |
| 3228 SE 136th Ave Portland, OR | 2.0–3.0 | 1.5 | 1058 | $1,597 | $1.51 | 4d | 4 | 1.31mi |
Listing history 14 events
-
2026-06-18days on market $139,000 Active 104 DOM
-
2026-06-17days on market $139,000 Active 103 DOM
-
2026-06-16days on market $139,000 Active 102 DOM
-
2026-06-15days on market $139,000 Active 101 DOM
-
2026-06-13days on market $139,000 Active 99 DOM
-
2026-06-13days on market $139,000 Active 98 DOM
-
2026-06-09days on market $139,000 Active 95 DOM
-
2026-06-07days on market $139,000 Active 93 DOM
-
2026-06-05days on market $139,000 Active 90 DOM
-
2026-06-03days on market $139,000 Active 89 DOM
-
2026-06-02days on market $139,000 Active 88 DOM
-
2026-06-01days on market $139,000 Active 87 DOM
-
2026-05-31days on market $139,000 Active 86 DOM
-
2026-03-06$139,000 Active 875-char remark
Show marketing remark (875 chars)
Just like brand new! This beautifully remodeled home has been updated from tip to tail and is filled with light throughout. The kitchen shines with a skylight, creating a bright and welcoming space that flows into both a cozy breakfast nook and a formal dining room—perfect for everyday living or hosting gatherings. The spacious living room offers plenty of room for entertaining, while the private primary retreat provides a peaceful escape complete with a walk-in closet and its own bathroom. Additional bedrooms are generously sized, offering flexibility for family, guests, or a home office. Step outside to a nicely sized yard ready for your garden ideas, play space, or outdoor entertaining. Conveniently located close to public transit, shopping, and restaurants, and just minutes from Powell Butte Nature Park with miles of scenic walking and biking trails.
ⓘ Source: listings_history table (triggers on properties + properties_extension) + one-shot
backfill from property_details.listing_events for pre-trigger history.
Tax reassessment forecast OR · Resets to sale price
- Current annual tax
- $374 · $31/mo
- Projected year-2 tax
- $1,348 · $112/mo
- Expected delta
- +$974/yr (+$81/mo · 260.1%)
ⓘ Screening estimate from a state-policy table — verify with the county assessor before closing.
Climate risk First Street
- Flood 1/10 Low FEMA zone X (unshaded) · 0% chance over 30 yrs
- Wildfire 3/10 Moderate
- Heat 3/10 Moderate 7 d/yr ≥92°F today · 15 d/yr by 30 yrs out
- Wind 1/10 Low
- Air quality 10/10 Extreme 23 unhealthy d/yr today · 27 by 30 yrs out
Nearby sold comps map
Loading sold comps map…
Walkable amenities ~0.75 mi
Loading nearby amenities…
Taxation est. · year 1
- Rental income
- $23,472
- − Mortgage interest
- −$7,786
- − Property taxes
- −$374
- − Insurance
- −$695
- − Repairs & maintenance
- −$1,878
- − Management
- −$1,878
- − Depreciation
- −$4,044
- Taxable income
- $6,817
- Est. tax owed @ 24.0%
- −$1,636
- After-tax cash flow
- $7,090/yr
For passive investors: Depreciation is non-cash, so a rental often shows a tax loss while cash-flowing — sheltering income. Rental losses are passive: they offset passive income freely, and up to $25,000/yr can offset ordinary (W-2) income if you actively participate and your MAGI is under $100k (phasing out to $0 by $150k); unused losses carry forward. On sale, claimed depreciation is recaptured at up to 25%, and gains may owe capital-gains tax (a 1031 exchange can defer both). Figures are a year-1 estimate at your 24.0% rate — not tax advice; consult a CPA.
Schools (NCES district)
- District
- Centennial SD 28J
- NCES district ID
- 4102800
- Math proficiency
- 31% ▼ -2.00%
- Reading proficiency
- 43% ▼ -2.00%
- Median HH income
- $49,619
- Composite
- 34.5/100
- National rank
- #10133
- State rank
- #125 of 183 in OR
Livability — Portland
- Score
- 77/100
- State rank
- #72
- US rank
- #3256
Category grades
Schools grade is shown separately in the Schools card above.
Census & demographics
- Census place
- Portland, OR
- County
- Multnomah County · 786,692 people
- City population
- 774,334
- Metro
- Portland-Vancouver-Hillsboro, OR-WA
- Population (ZIP)
- 37,558
- Household income
- $75,090
- Rent vs Own
- Severe rent burden
- 1744.0
Population outlook (Multnomah County) Hauer SSP2
- Today (2025)
- 930,825 people
- By 2030
- 996,904 · +7.1%
- By 2040
- 1,121,379 · +20.5%
- By 2050
- 1,242,124 · +33.4%
- By 2075
- 1,464,431 · +57.3%
- By 2100
- 1,576,181 · +69.3%
Race, ethnicity, and origin ACS 2023
- Neighborhood character
- Diverse neighborhood (Simpson 0.67)
- Race & ethnicity
- White 51% Hispanic / Latino 21% Asian 13% Two or more races 12% Black 9% Pacific Islander 1%
- Hispanic origin (detail)
- Mexican 15% Cuban 1%
- Common ancestry
- Italian 3% Scotch-Irish 2% Subsaharan African 2%
- Foreign-born
- 25% · Canada, Vietnam, China
- Languages at home
- 63% English-only · Spanish 16% Vietnamese 6% Russian/Polish/Slavic 5%
Political lean MEDSL · Multnomah
- 2024 margin
- Solid D (+62.1) · D 79.3% · R 17.2% · Other 3.5%
- 2008→2024 swing
- +6.0pp toward D · 2008: 56.1pp · 2024: 62.1pp
- All cycles
- 2024: D+62.1 2020: D+61.3 2016: D+58.3 2012: D+54.9 2008: D+56.1
Not yet ingested
- Civics
- —
Market trends
- HPI YoY
- ▼ -334.44%
- Current HPI
- 289.931
- Rent YoY
- ▲ 1.64%
- Metro
- Portland-Vancouver-Hillsboro, OR-WA
- State GDP YoY
- ▲ 2.05%
- F500 in state
- 2
Industry mix (Fortune 500 HQ in OR)
| Industry | F500 HQs | Revenue |
|---|---|---|
| Consumer Goods | 1 | $51B |
|
||
Price history
1 event — show timeline
- 2026-03-06 Listed $139,000 RMLS
Property tax history
-2.1%/yrLatest (2025): $374 · +14.8% YoY. Source: county tax records.
Cash-flow waterfall
monthlySold comps — $/sqft
last 12 mo · ≤1 miLoading sold comps…