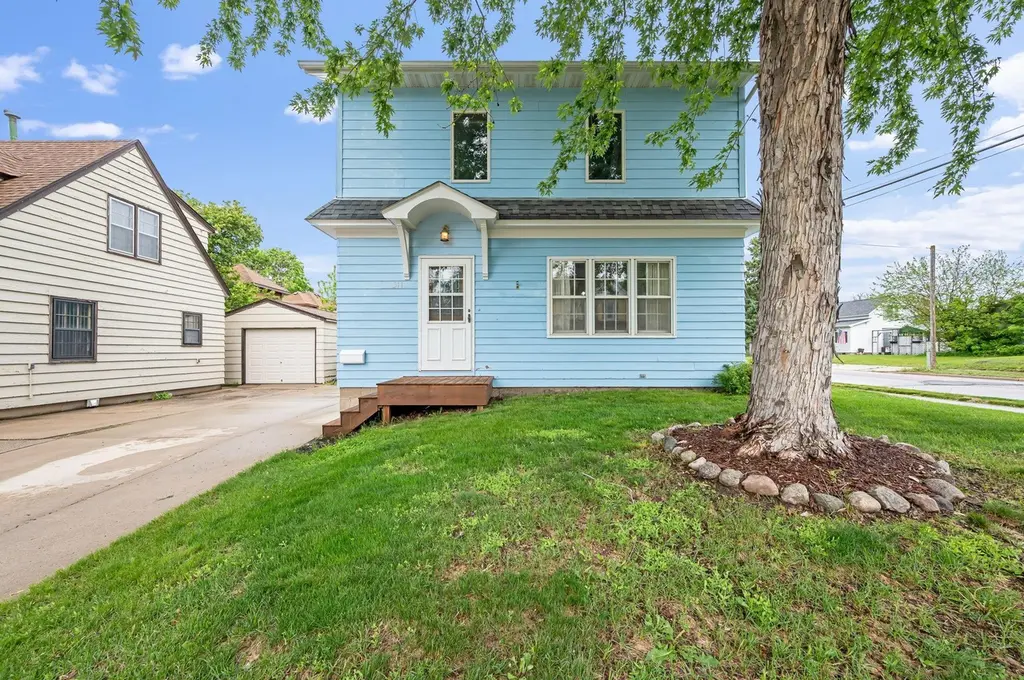
311 Budd St · Fairmont, MN
Flood risk 1/10 · Minimal
- FEMA flood zone
- X
- Chance of flooding over 30 yrs
- 0.0%
- Est. flood insurance / yr
- $507 – $1,088
Fire risk 1/10 · Minimal
- Est. fire insurance / yr
- $888 – $1,650
Heat risk 2/10 · Minimal
- Hot days now (above 98°F)
- 7 days/yr
- Hot days in 30 yrs
- 15 days/yr
Wind risk 2/10 · Minimal
- Chance of severe wind over 30 yrs
- —
Air-quality risk 1/10 · Minimal
- Unhealthy air days now
- 0 days/yr
- Unhealthy air days in 30 yrs
- 0 days/yr
Risk factors via First Street. Map © Google.
Why this score? — see what drove the C- grade
The composite is a weighted blend of 9 inputs, each scored 0–100. Each bar is that input's sub-score; the figure is the points it added to the 100-point composite (weight × sub-score).
- Cash flow +21.4/30.0
- ARV discount +7.5/15.0
- DSCR +6.8/10.0
- 1% rule +4.8/10.0
- Schools +4.1/10.0
- Livability +3.4/5.0
- Rent growth +2.5/5.0
- Condition / age +2.5/5.0
- Appreciation +0.0/10.0
$115,000
🖨 Deal sheet 📄 Offer letter ✓ Due diligence
Listing remarks
Situated on a corner lot, this 3 bedroom home offers character with original hardwood floors and updates throughout. All three bedrooms and a full bathroom are located upstairs, while the basement features a 3/4 bathroom, laundry area, and workspace with workbench. Enjoy newer kitchen flooring, countertops updated in 2022, and a water heater replaced in 2023. Outside, a yard shed provides extra storage for all your outdoor needs!
Key facts
- Laundry area
- 3/4 bathroom
- Corner lot
Tags
Property features AI
Exterior
- Parking: Concrete parking surface
- Utilities: City water connected; City sewer connected; Natural gas
- Home design: Residential property; One and one-half levels; Main entry on main level
- Construction: Block foundation; Roof replaced within the last 8 years
- Exterior features: Wood exterior; Storage shed; No fencing; City street frontage; Publicly maintained road
Interior
- Kitchen: Range; Refrigerator
- Bedrooms: 3 bedrooms (all on the upper level)
- Bathrooms: 1 full bathroom on the main level; 1 three-quarter bathroom in the basement
- Heating & cooling: Forced air heating; Central air conditioning
- Interior features: Informal dining room; Block basement
- Laundry & utility: Washer; Dryer
Neighborhood map
What this means for you Summary
Snapshot
- This is a 3-bed/2.0-bath single-family listed at $115k.
Deal economics
- At list price, monthly cash flow is $170 ($2k/yr) — positive.
- The deal already cash-flows at list — no discount required.
- To meet the 1% rule (rent ≥ 1% of price), the offer needs to be $113k (1.5% below list).
- Recommended offer: $113k (1.5% below list) — sets the bar for 1% rule.
- Cap rate 8.1% vs local median 3.4% in Fairmont — top-decile yield for the area; either an underpriced asset or a hidden risk that comps aren't pricing in. Stress-test before assuming the spread holds.
Location & tenants
- Location reads 68/100 on livability (#407 in MN) — a middle-class / working-renter tenant base. Strengths: cost of living A+, housing A+; Watch: health & safety C-, employment D+, amenities F.
- Fairmont Area School District (town): math 45% / reading 51% proficiency, ranked #148 of 301 in MN (top 49%) — families likely to look elsewhere, expect single-tenant / working-renter base with shorter leases.
- Market conditions: 94 active listings in the ZIP; 19 units permitted in Martin County in 2024 (0 in 5+ unit buildings).
Forward outlook
- Local home prices are declining (-3.0%/yr); year-one equity from $795 of loan paydown is wiped out by about $3k of value loss. Plan a longer hold.
- Martin County population projected at -19% by 2050 — secular population decline; favor cash flow + early exit over multi-decade hold.
Negotiation context
- Only 13 days on market — expect competitive offers; lowballing is unlikely to land.
- Current owner paid $27k; list at $115k implies a 326% gain — meaningful room to come down on a strong offer.
Risks & watch-outs
- Watch-outs: built in 1937 — expect roof / HVAC / electrical / plumbing capex.
Questions for the listing agent
- Built in 1937 — when were the roof, HVAC, electrical panel, plumbing, and water heater last replaced?
- Is there a deadline driving the sale (1031 exchange, divorce, estate, relocation)? That informs how much negotiation room exists.
- What's the average days-on-market for RENTAL listings here right now (not sales)? A rising rental-DOM trend means longer vacancies and softer asking-rent achievability than the comps imply.
- What's the recent tenant-quality profile in this submarket — average credit score on applications, eviction rate, late-payment / NSF rate, and stable-employment percentage? A property-management company in the area should have these aggregated.
- How much new for-sale + rental construction is in the pipeline within 1–3 miles? Heavy new supply typically softens prices + rents 12–24 months out; constrained supply supports both.
Investment metrics
- 1% rule
- 0.98% ✗
- Cap rate
- 8.06%
- Cash-on-cash
- 6.32%
- DSCR
- 1.28
- GRM
- 8.5
CMA / ARV
No comps found within radius.
Projected returns pro-forma
-3.0% appreciation · 3.0% rent growth · sell at horizon
- IRR
- -6.6%
- Equity multiple
- 0.76×
- Total profit
- $-7,855
- Equity at exit
- $17,147
- IRR
- 3.0%
- Equity multiple
- 1.22×
- Total profit
- $6,968
- Equity at exit
- $9,943
Cash invested: $32,200 (down + closing). Projections, not guarantees.
Landlord ↔ Tenant lean methodology
- Overall (STATE)
- 46 Balanced
- State Minnesota
- 46 Balanced · D+2
- County
- — inherits STATE
- City
- — inherits STATE
ZIP-level market 56031
- Active inventory
- 94
- Price-to-rent
- 8.5×
Monthly cashflow live
- Estimated rent
- $1,132 medium interval (Pro) →
- Mortgage (P&I)
- −$603
- Tax from tax record
- −$74 /mo · $886/yr
- Insurance
- −$48
- HOA
- −$0
- Vacancy / Maint / Mgmt
- −$238
- Net cashflow
- $170
Break-even live
UW: 25.0% down · 7.5% · 30yr · 1.5% tax · 5.0% vac · 8.0% maint · 8.0% mgmt
Financing live
Cash to close
- Down payment
- $28,750
- Closing costs
- $3,450
- Reserves months
- —
- Total cash needed
- —
Loan-product check · same deal, 3 products live
Conventional
25% down · 7.5% · 30yr
- Down + closing
- —
- Monthly P&I
- —
- Monthly cashflow
- —
- DSCR
- —
- Eligible?
- —
Personal DTI + credit; lowest rate.
DSCR
20% down · 8.5% · 30yr
- Down + closing
- —
- Monthly P&I
- —
- Monthly cashflow
- —
- DSCR
- —
- Eligible?
- —
No personal income docs; deal must DSCR.
Hard money
10% down · 12.0% · 12mo
- Down + closing
- —
- Monthly P&I
- —
- Monthly cashflow
- —
- DSCR
- —
- Eligible?
- —
Short-term bridge; refi at stabilization.
Listing history 11 events
-
2026-06-09status $115,000 Pending 13 DOM
-
2026-06-08days on market $115,000 Active 13 DOM
-
2026-06-07days on market $115,000 Active 12 DOM
-
2026-06-05days on market $115,000 Active 10 DOM
-
2026-06-04days on market $115,000 Active 8 DOM
-
2026-06-02days on market $115,000 Active 7 DOM
-
2026-06-01days on market $115,000 Active 6 DOM
-
2026-05-31days on market $115,000 Active 5 DOM
-
2026-05-31days on market $115,000 Active 4 DOM
-
2026-05-26$115,000 Active
-
1998-07-01soldstatus $27,000
ⓘ Source: listings_history table (triggers on properties + properties_extension) + one-shot
backfill from property_details.listing_events for pre-trigger history.
Tax reassessment forecast MN · Partial reset (capped growth)
- Current annual tax
- $886 · $74/mo
- Projected year-2 tax
- $1,087 · $91/mo
- Expected delta
- +$201/yr (+$17/mo · 22.7%)
ⓘ Screening estimate from a state-policy table — verify with the county assessor before closing.
Climate risk First Street
- Flood 1/10 Low FEMA zone X · 0% chance over 30 yrs
- Wildfire 1/10 Low
- Heat 2/10 Low 7 d/yr ≥98°F today · 15 d/yr by 30 yrs out
- Wind 2/10 Low
- Air quality 1/10 Low 0 unhealthy d/yr today · 0 by 30 yrs out
Nearby sold comps map
Loading sold comps map…
Walkable amenities ~0.75 mi
Loading nearby amenities…
Taxation est. · year 1
- Rental income
- $13,587
- − Mortgage interest
- −$6,442
- − Property taxes
- −$886
- − Insurance
- −$575
- − Repairs & maintenance
- −$1,087
- − Management
- −$1,087
- − Depreciation
- −$3,345
- Taxable income
- $165
- Est. tax owed @ 24.0%
- −$40
- After-tax cash flow
- $1,996/yr
For passive investors: Depreciation is non-cash, so a rental often shows a tax loss while cash-flowing — sheltering income. Rental losses are passive: they offset passive income freely, and up to $25,000/yr can offset ordinary (W-2) income if you actively participate and your MAGI is under $100k (phasing out to $0 by $150k); unused losses carry forward. On sale, claimed depreciation is recaptured at up to 25%, and gains may owe capital-gains tax (a 1031 exchange can defer both). Figures are a year-1 estimate at your 24.0% rate — not tax advice; consult a CPA.
Schools (NCES district)
- District
- Fairmont Area School District
- NCES district ID
- 2700124
- Math proficiency
- 45% ▼ -13.00%
- Reading proficiency
- 51% ▼ -7.00%
- Median HH income
- $46,280
- Composite
- 40.76/100
- National rank
- #3648
- State rank
- #148 of 301 in MN
Livability — Fairmont
- Score
- 68/100
- State rank
- #407
- US rank
- #9480
Category grades
Schools grade is shown separately in the Schools card above.
Census & demographics
- Census place
- Fairmont, MN
- City population
- 11,800
- Population (ZIP)
- 11,800
Population outlook (Martin County) Hauer SSP2
- Today (2025)
- 18,583 people
- By 2030
- 17,814 · -4.1%
- By 2040
- 16,312 · -12.2%
- By 2050
- 15,021 · -19.2%
- By 2075
- 13,025 · -29.9%
- By 2100
- 11,311 · -39.1%
Race, ethnicity, and origin ACS 2023
- Neighborhood character
- Predominantly White (87%)
- Race & ethnicity
- White 87% Hispanic / Latino 8% Two or more races 3%
- Hispanic origin (detail)
- Mexican 7%
- Common ancestry
- Portuguese 11% Romanian 6% Italian 2%
- Foreign-born
- 3% · Canada, China
- Languages at home
- 93% English-only · Spanish 5%
Political lean MEDSL · Martin
- 2024 margin
- Solid R (+39.7) · D 29.5% · R 69.1% · Other 1.4%
- 2008→2024 swing
- -24.4pp toward R · 2008: -15.2pp · 2024: -39.7pp
- All cycles
- 2024: R+39.7 2020: R+37.9 2016: R+41.4 2012: R+23.8 2008: R+15.2
Not yet ingested
- Civics
- —
Market trends
- HPI YoY
- ▼ -143.34%
- Current HPI
- 191.514
- Rent YoY
- —
- Metro
- —
- State GDP YoY
- ▲ 2.41%
- F500 in state
- 34
Industry mix (Fortune 500 HQ in MN)
| Industry | F500 HQs | Revenue |
|---|---|---|
| Healthcare | 2 | $407B |
|
||
| Retail | 2 | $150B |
|
||
| Consumer Goods | 2 | $32B |
|
||
| Industrial Machinery | 2 | $6B |
|
||
| Agriculture | 1 | $40B |
|
||
| Healthcare / Medical Devices | 1 | $32B |
|
||
Price history
+325.9% since first listed2 events — show timeline
- 2026-05-26 Listed $115,000 NORTHSTARMLS as Distributed by MLS Grid
- 1998-07-01 Sold (Public Records) $27,000 Public Records
Property tax history
+3.8%/yrLatest (2025): $886 · +1.6% YoY. Source: county tax records.
Cash-flow waterfall
monthlySold comps — $/sqft
last 12 mo · ≤1 miLoading sold comps…