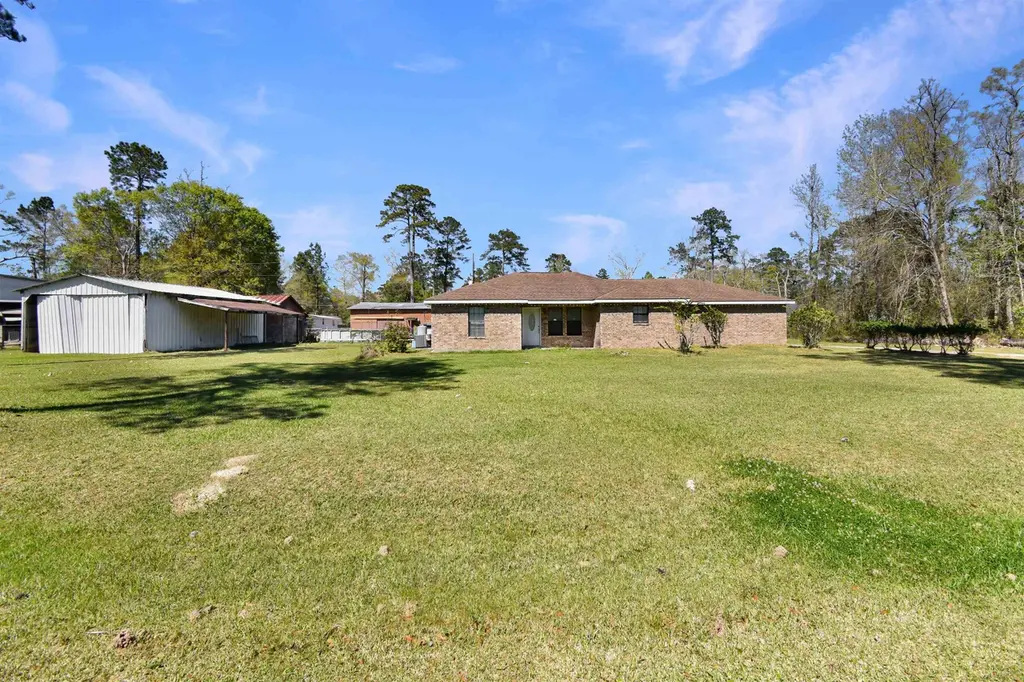
8891 Wingfield · Lumberton, TX
Flood risk 1/10 · Minimal
- FEMA flood zone
- X (unshaded)
- Chance of flooding over 30 yrs
- 0.0%
- Est. flood insurance / yr
- $507 – $1,088
Fire risk 4/10 · Minor
- Est. fire insurance / yr
- $1,222 – $2,270
Heat risk 9/10 · Severe
- Hot days now (above 111°F)
- 7 days/yr
- Hot days in 30 yrs
- 24 days/yr
Wind risk 9/10 · Severe
- Chance of severe wind over 30 yrs
- 99.0%
Air-quality risk 2/10 · Minimal
- Unhealthy air days now
- 1 days/yr
- Unhealthy air days in 30 yrs
- 1 days/yr
Risk factors via First Street. Map © Google.
Why this score? — see what drove the D grade
The composite is a weighted blend of 9 inputs, each scored 0–100. Each bar is that input's sub-score; the figure is the points it added to the 100-point composite (weight × sub-score).
- ARV discount +11.6/15.0
- Cash flow +9.4/30.0
- 1% rule +4.3/10.0
- Schools +4.3/10.0
- Livability +3.8/5.0
- DSCR +2.6/10.0
- Rent growth +2.5/5.0
- Condition / age +2.5/5.0
- Appreciation +0.0/10.0
$180,000
🖨 Deal sheet 📄 Offer letter ✓ Due diligence
Listing remarks
Charming 2-bedroom, 2-bath brick home with a 2-car garage situated on a slab in the highly sought-after Lumberton ISD. Nestled on approximately 0.72 acres, this property offers over 1,300 square feet of living space and plenty of room to make it your own. The home features a functional layout with great potential, plus a large workshop perfect for storage, hobbies, or projects. With a little TLC, this property could truly shine—ideal for investors or buyers looking to add personal touches. Priced to sell—don’t miss this opportunity
Key facts
- 2 garage spots
Neighborhood map
What this means for you Summary
Snapshot
- This is a 2-bed/2.0-bath single-family listed at $180k.
Deal economics
- At list price, monthly cash flow is $-128 ($-2k/yr) — negative.
- To cash-flow at today's rent, offer at most $157k (12.6% below list).
- To meet the 1% rule (rent ≥ 1% of price), the offer needs to be $168k (6.5% below list).
- Recommended offer: $157k (12.6% below list) — sets the bar for cash-flow.
- Cap rate 5.4% vs local median 3.2% in Lumberton — top-decile yield for the area; either an underpriced asset or a hidden risk that comps aren't pricing in. Stress-test before assuming the spread holds.
Location & tenants
- Location reads 75/100 on livability (#160 in TX, #4,326 nationally) — a middle-class / working-renter tenant base. Strengths: crime A+, employment A+, cost of living A+; Watch: amenities F, commute F.
- Lumberton ISD (suburban): math 48% / reading 50% proficiency, ranked #173 of 826 in TX (top 21%) — families likely to look elsewhere, expect single-tenant / working-renter base with shorter leases.
- Market conditions: 318 active listings in the ZIP; 6 comparable units currently listed for rent nearby; rentals at typical pace (median 24d on market — plan ~3-4 weeks tenant-placement turnaround); solid renter incomes; 358 units permitted in Hardin County in 2024 (0 in 5+ unit buildings).
Forward outlook
- Local home prices are declining (-3.0%/yr); year-one equity from $1k of loan paydown is wiped out by about $5k of value loss. Plan a longer hold.
Negotiation context
- Only 0 days on market — expect competitive offers; lowballing is unlikely to land.
- 3 sale attempts with the ask held roughly flat each time — persistent listings suggest the price (not the market) is what's stuck; bring a comps-based counter.
Risks & watch-outs
- Watch-outs: property tax is 2.9% of price.
- Climate carrying-cost: severe wind risk, 99% chance of damaging wind over 30y; extreme-heat days projected 7→24/yr by 2055 (HVAC capex compounding) — expect insurance premiums to compound above CPI over the hold.
Questions for the listing agent
- What do current leases actually rent for vs. the listed asking? Can we see a recent rent roll and the last 12 months of T-12 income?
- Property tax is high relative to price — has the assessment been appealed recently, and will the sale trigger a re-assessment?
- Is there a deadline driving the sale (1031 exchange, divorce, estate, relocation)? That informs how much negotiation room exists.
- The area grade is low — what's the realistic commute time and amenity access for the typical tenant pool here? Any planned neighborhood developments (good or bad) we should know about?
- What's the average days-on-market for RENTAL listings here right now (not sales)? A rising rental-DOM trend means longer vacancies and softer asking-rent achievability than the comps imply.
- What's the recent tenant-quality profile in this submarket — average credit score on applications, eviction rate, late-payment / NSF rate, and stable-employment percentage? A property-management company in the area should have these aggregated.
- How much new for-sale + rental construction is in the pipeline within 1–3 miles? Heavy new supply typically softens prices + rents 12–24 months out; constrained supply supports both.
Investment metrics
- 1% rule
- 0.93% ✗
- Cap rate
- 5.44%
- Cash-on-cash
- -3.06%
- DSCR
- 0.86
- GRM
- 8.9
CMA / ARV
- ARV (median comp)
- $198,201
- List price
- $180,000
- Delta
- -9.18%
- Verdict
- FAIR
- Comps
- 8 within 1.0 mi
Show comp detail 2 sales within ~0.75 mi
| Address | Dist | Beds/Ba | Sqft | Sold | Price | $/sf | Match |
|---|---|---|---|---|---|---|---|
| 8483 Wingfield Dr | 0.36mi | 2/2.0 | 1,440 (+9%) | 3mo | $225,000 | $156 | 66 |
| 8801 Mitchell Rd | 0.65mi | 3/2.0 (+1) | 1,352 (+2%) | 17mo | $200,000 | $148 | 46 |
Match score weights: distance 35% · size 25% · config 20% · recency 20%. Top-matched comps best support the ARV.
Projected returns pro-forma
-3.0% appreciation · 3.0% rent growth · sell at horizon
- IRR
- -21.3%
- Equity multiple
- 0.26×
- Total profit
- $-37,195
- Equity at exit
- $26,839
- IRR
- -14.6%
- Equity multiple
- 0.16×
- Total profit
- $-42,289
- Equity at exit
- $15,563
Cash invested: $50,400 (down + closing). Projections, not guarantees.
Landlord ↔ Tenant lean methodology
- Overall (STATE)
- 87 Strongly Landlord-Friendly
- State Texas
- 87 Strongly Landlord-Friendly · R+5
- County
- — inherits STATE
- City
- — inherits STATE
ZIP-level market 77657
- Active inventory
- 318
- Price-to-rent
- 8.9×
Monthly cashflow live
- Estimated rent
- $1,683 high interval (Pro) →
- Mortgage (P&I)
- −$944
- Tax from tax record
- −$439 /mo · $5,269/yr
- Insurance
- −$75
- HOA
- −$0
- Vacancy / Maint / Mgmt
- −$353
- Net cashflow
- $-128
Break-even live
UW: 25.0% down · 7.5% · 30yr · 1.5% tax · 5.0% vac · 8.0% maint · 8.0% mgmt
Financing live
Cash to close
- Down payment
- $45,000
- Closing costs
- $5,400
- Reserves months
- —
- Total cash needed
- —
Loan-product check · same deal, 3 products live
Conventional
25% down · 7.5% · 30yr
- Down + closing
- —
- Monthly P&I
- —
- Monthly cashflow
- —
- DSCR
- —
- Eligible?
- —
Personal DTI + credit; lowest rate.
DSCR
20% down · 8.5% · 30yr
- Down + closing
- —
- Monthly P&I
- —
- Monthly cashflow
- —
- DSCR
- —
- Eligible?
- —
No personal income docs; deal must DSCR.
Hard money
10% down · 12.0% · 12mo
- Down + closing
- —
- Monthly P&I
- —
- Monthly cashflow
- —
- DSCR
- —
- Eligible?
- —
Short-term bridge; refi at stabilization.
Rent comps 6 comps
| Address | Beds | Baths | Sqft | Rent | $/sqft | DOM | Units | Dist |
|---|---|---|---|---|---|---|---|---|
| 9006 Duke St Lumberton, TX | 3.0 | 2.0 | 1064 | $1,400 | $1.32 | 43d | 1 | 0.35mi |
| 8445 Harvard St Lumberton, TX | 3.0 | 2.5 | 1295 | $1,790 | $1.38 | 23d | 1 | 0.44mi |
| 9440 Hickory St Lumberton, TX | 2.0 | 2.0 | 1250 | $1,500 | $1.20 | 43d | 1 | 0.62mi |
| 9440 Hickory St Lumberton, TX | 2.0 | 2.0 | 1200 | $1,500 | $1.25 | 23d | 1 | 0.62mi |
| 9984 Golden Ln Lumberton, TX | 2.0 | 1.5 | 1001 | $1,575 | $1.57 | 13d | 1 | 1.16mi |
| 110 Azaelia Dr Lumberton, TX | 2.0 | 2.0 | 1380 | $1,650 | $1.20 | 13d | 1 | 1.35mi |
Listing history 4 events
-
2026-06-02pricestatusdays on market $180,000 Pending
-
2026-05-19$180,000 Active 555-char remark
-
2026-03-18$180,000 Active
-
2012-10-10soldstatus
ⓘ Source: listings_history table (triggers on properties + properties_extension) + one-shot
backfill from property_details.listing_events for pre-trigger history.
Tax reassessment forecast TX · Resets to sale price
- Current annual tax
- $5,269 · $439/mo
- Projected year-2 tax
- $5,269 · $439/mo
- Expected delta
- $0/yr ($0/mo · 0.0%)
ⓘ Screening estimate from a state-policy table — verify with the county assessor before closing.
Climate risk First Street
- Flood 1/10 Low FEMA zone X (unshaded) · 0% chance over 30 yrs
- Wildfire 4/10 Moderate
- Heat 9/10 Extreme 7 d/yr ≥111°F today · 24 d/yr by 30 yrs out
- Wind 9/10 Extreme 99% chance of damaging wind over 30 yrs
- Air quality 2/10 Low 1 unhealthy d/yr today · 1 by 30 yrs out
Nearby sold comps map
Loading sold comps map…
Walkable amenities ~0.75 mi
Loading nearby amenities…
Taxation est. · year 1
- Rental income
- $20,195
- − Mortgage interest
- −$10,083
- − Property taxes
- −$5,269
- − Insurance
- −$900
- − Repairs & maintenance
- −$1,616
- − Management
- −$1,616
- − Depreciation
- −$5,236
- Taxable loss
- −$4,524
- Est. tax savings @ 24.0%
- +$1,086
- After-tax cash flow
- $-456/yr
For passive investors: Depreciation is non-cash, so a rental often shows a tax loss while cash-flowing — sheltering income. Rental losses are passive: they offset passive income freely, and up to $25,000/yr can offset ordinary (W-2) income if you actively participate and your MAGI is under $100k (phasing out to $0 by $150k); unused losses carry forward. On sale, claimed depreciation is recaptured at up to 25%, and gains may owe capital-gains tax (a 1031 exchange can defer both). Figures are a year-1 estimate at your 24.0% rate — not tax advice; consult a CPA.
Schools (NCES district)
- District
- Lumberton ISD
- NCES district ID
- 4813530
- Math proficiency
- 48% ▼ -5.00%
- Reading proficiency
- 50% ▼ -4.00%
- Median HH income
- $62,996
- Composite
- 43.2/100
- National rank
- #3063
- State rank
- #173 of 826 in TX
Livability — Lumberton
- Score
- 75/100
- State rank
- #160
- US rank
- #4326
Category grades
Schools grade is shown separately in the Schools card above.
Census & demographics
- County
- Hardin County · 39,783 people
- City population
- 22,258
- Metro
- Beaumont-Port Arthur, TX
- Population (ZIP)
- 22,258
- Household income
- $95,718
- Rent vs Own
- Severe rent burden
- 147.0
Population outlook (Hardin County) Hauer SSP2
- Today (2025)
- 57,780 people
- By 2030
- 58,296 · +0.9%
- By 2040
- 58,421 · +1.1%
- By 2050
- 57,391 · -0.7%
- By 2075
- 53,132 · -8.0%
- By 2100
- 44,905 · -22.3%
Race, ethnicity, and origin ACS 2023
- Neighborhood character
- Predominantly White (89%)
- Race & ethnicity
- White 89% Hispanic / Latino 5% Two or more races 5%
- Hispanic origin (detail)
- Mexican 4%
- Common ancestry
- Lithuanian 10% Serbian 3% Slovak 2%
- Foreign-born
- 2% · Canada
- Languages at home
- 97% English-only · Spanish 2%
Political lean MEDSL · Hardin
- 2024 margin
- Solid R (+75.8) · D 11.9% · R 87.7%
- 2008→2024 swing
- -14.6pp toward R · 2008: -61.2pp · 2024: -75.8pp
- All cycles
- 2024: R+75.8 2020: R+73.8 2016: R+73.9 2012: R+67.6 2008: R+61.2
Not yet ingested
- Civics
- —
Market trends
- HPI YoY
- ▼ -160.56%
- Current HPI
- 156.2265
- Rent YoY
- —
- Metro
- Beaumont-Port Arthur, TX
- State GDP YoY
- ▲ 3.95%
- F500 in state
- 110
Industry mix (Fortune 500 HQ in TX)
| Industry | F500 HQs | Revenue |
|---|---|---|
| Energy | 16 | $1,198B |
|
||
| Technology | 5 | $198B |
|
||
| Engineering / Construction | 4 | $72B |
|
||
| Energy Services | 3 | $60B |
|
||
| Utilities | 3 | $41B |
|
||
| Healthcare | 2 | $330B |
|
||
Price history
+0.0% since first listed6 events — show timeline
- 2026-06-18 Delisted — BBOR
- 2026-05-30 Listed $180,000 BBOR
- 2026-05-28 Price Changed $150,000 BBOR
- 2026-05-19 Listed $180,000 BBOR
- 2026-03-18 Listed $180,000 BBOR
- 2012-10-10 Sold (Public Records) — Public Records
Property tax history
+5.3%/yrLatest (2025): $5,269 · -0.8% YoY. Source: county tax records.
Cash-flow waterfall
monthlySold comps — $/sqft
last 12 mo · ≤1 miLoading sold comps…