3489 Seyburn St · Detroit, MI
Flood risk 1/10 · Minimal
- FEMA flood zone
- X (unshaded)
- Chance of flooding over 30 yrs
- 0.0%
- Est. flood insurance / yr
- $473 – $860
Fire risk 1/10 · Minimal
- Est. fire insurance / yr
- $784 – $1,456
Heat risk 3/10 · Minor
- Hot days now (above 96°F)
- 7 days/yr
- Hot days in 30 yrs
- 15 days/yr
Wind risk 2/10 · Minimal
- Chance of severe wind over 30 yrs
- —
Air-quality risk 3/10 · Minor
- Unhealthy air days now
- 2 days/yr
- Unhealthy air days in 30 yrs
- 5 days/yr
Risk factors via First Street. Map © Google.
Why this score? — see what drove the D grade
The composite is a weighted blend of 9 inputs, each scored 0–100. Each bar is that input's sub-score; the figure is the points it added to the 100-point composite (weight × sub-score).
- Cash flow +15.0/30.0
- ARV discount +7.5/15.0
- 1% rule +5.0/10.0
- DSCR +5.0/10.0
- Livability +3.7/5.0
- Rent growth +2.5/5.0
- Condition / age +2.5/5.0
- Schools +1.3/10.0
- Appreciation +0.0/10.0
$11,250
🖨 Deal sheet 📄 Offer letter ✓ Due diligence
Listing remarks MLS
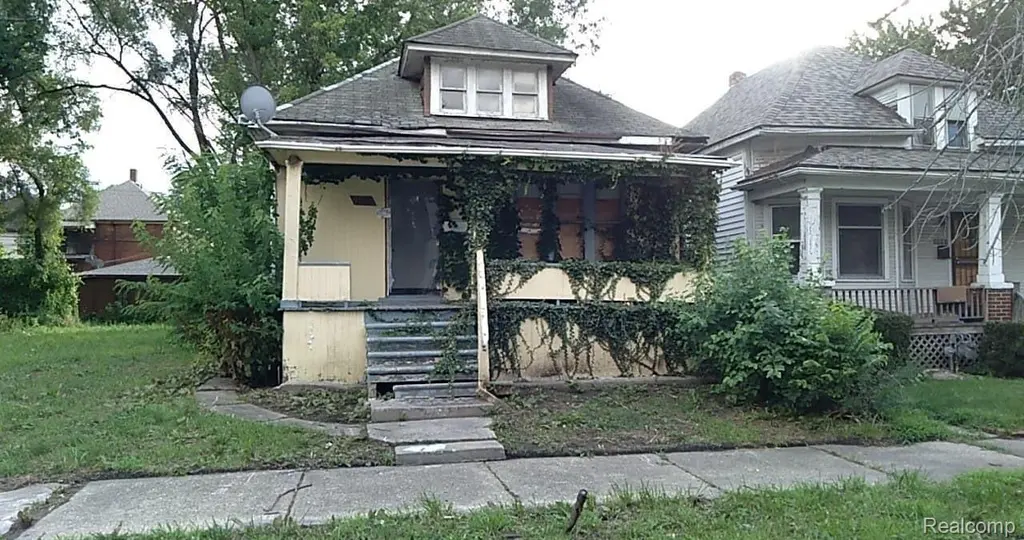
Property needs a full rehab top to bottom, but don't let that scare you away. The right investor will certainly turn a profit on this Islandview 2 bedroom ranch, just west of West Village. Islandview is named for its proximity to Detroit's island park, Belle Isle. The neighborhood is bound by Jefferson on the south, Mack to the north, Mt. Elliott to the west and Baldwin Street on the east. Please note that the Detroit Land Bank Authority is entitled to a tax capture for the 5 tax years subsequent to transferring ownership of the property. The tax capture may be incompatible with tax abatements and lot combinations that are otherwise available to the selected purchaser. DLBA will review requests to waive its tax capture rights and may require a payment in lieu of taxes to approve such requests. The payment will be determined upon reviewing the development proforma and effect of any tax abatements on the purchase and development financing.
Key facts
- 3,049 sq ft lot
- Built 1911
- Listed 164 days
Neighborhood map
What this means for you Summary
Snapshot
- This is a 2-bed/1.0-bath single-family listed at $11k.
Deal economics
- At list price, monthly cash flow is $989 ($12k/yr) — positive.
- The deal already cash-flows at list — no discount required.
- Meets the 1% rule at list price ($1k rent vs $11k).
- Recommended offer: $10k (12.0% below list) — sets the bar for market timing.
- Cap rate 111.8% vs local median 10.2% in Detroit — top-decile yield for the area; either an underpriced asset or a hidden risk that comps aren't pricing in. Stress-test before assuming the spread holds.
Location & tenants
- Location reads 73/100 on livability (#218 in MI) — a middle-class / working-renter tenant base. Strengths: amenities A+, commute A+, cost of living A+; Watch: schools F, crime F, employment F.
- Detroit Public Schools Community District (urban): math 10% / reading 24% proficiency, ranked #499 of 540 in MI (top 92%) — low school quality limits family demand, transient renter base, plan for 1-2y turnover; 90% free/reduced lunch — lower-income household profile, screen leases tightly.
- Market conditions: 298 active listings in the ZIP; 40 comparable units currently listed for rent nearby; rentals at typical pace (median 24d on market — plan ~3-4 weeks tenant-placement turnaround); 48% of comp listings sitting > 30 days — soft ceiling on asking rent; lower-income renter base — watch delinquency; 2,639 units permitted in Wayne County in 2024 (1,216 in 5+ unit buildings).
- At $1,358/mo this rent would consume 49% of the median local household income ($34k/yr) (locally 1364% of renters already pay >50% of income on rent) — very limited rent-growth headroom before tenants either downsize or default.
Forward outlook
- Local home prices are declining (-3.0%/yr); year-one equity from $78 of loan paydown is wiped out by about $338 of value loss. Plan a longer hold.
- Wayne County population projected at -17% by 2050 — secular population decline; favor cash flow + early exit over multi-decade hold.
- At projected returns (-3.0% appreciation + 3.0% rent growth), your $3k cash investment doubles in ~1 year — after that, you're playing with house money.
Negotiation context
- It's been on market 164 days — a 12% lower offer ($10k) is reasonable based on typical stale-listing flexibility.
- 10 sale attempts since 6y ago with the ask held roughly flat each time — persistent listings suggest the price (not the market) is what's stuck; bring a comps-based counter.
Risks & watch-outs
- Watch-outs: built in 1911 — expect roof / HVAC / electrical / plumbing capex.
Questions for the listing agent
- It's been on market 164 days. Have you received any prior offers? Is the seller open to a 12% concession, seller financing, or rate buy-down credit?
- Built in 1911 — when were the roof, HVAC, electrical panel, plumbing, and water heater last replaced?
- Why hasn't it sold? Are there any deal-killer items the seller is aware of (foundation, flood, title, zoning, code violations)?
- Is there a deadline driving the sale (1031 exchange, divorce, estate, relocation)? That informs how much negotiation room exists.
- Schools are F-rated, which usually means shorter tenancies and higher turnover. Who's the typical renter profile here, and what's been the actual vacancy rate?
- Crime grade is F in this area — have there been break-ins, vandalism, or insurance claims at this property in the last 3 years? What carrier currently insures it and at what premium?
- The area grade is low — what's the realistic commute time and amenity access for the typical tenant pool here? Any planned neighborhood developments (good or bad) we should know about?
- What's the average days-on-market for RENTAL listings here right now (not sales)? A rising rental-DOM trend means longer vacancies and softer asking-rent achievability than the comps imply.
- What's the recent tenant-quality profile in this submarket — average credit score on applications, eviction rate, late-payment / NSF rate, and stable-employment percentage? A property-management company in the area should have these aggregated.
- How much new for-sale + rental construction is in the pipeline within 1–3 miles? Heavy new supply typically softens prices + rents 12–24 months out; constrained supply supports both.
Investment metrics
- 1% rule
- 12.07% ✓
- Cap rate
- 111.78%
- Cash-on-cash
- 376.74%
- DSCR
- 17.76
- GRM
- 0.7
CMA / ARV
- ARV (median comp)
- $80,336
- List price
- $11,250
- Delta
- -86.00%
- Verdict
- UNDERPRICED
- Comps
- 20 within 1.0 mi
Show comp detail 3 sales within ~0.75 mi
| Address | Dist | Beds/Ba | Sqft | Sold | Price | $/sf | Match |
|---|---|---|---|---|---|---|---|
| 8043 Sprague St | 0.43mi | 3/1.0 (+1) | 988 (-10%) | 15mo | $35,000 | $35 | 45 |
| 4198 Seneca St | 0.55mi | 3/1.5 (+1) | 1,172 (+6%) | 22mo | $199,400 | $170 | 39 |
| 1831 Helen St St | 0.74mi | 3/1.5 (+1) | 1,230 (+12%) | 7mo | $227,500 | $185 | 34 |
Match score weights: distance 35% · size 25% · config 20% · recency 20%. Top-matched comps best support the ARV.
Projected returns pro-forma
-3.0% appreciation · 3.0% rent growth · sell at horizon
- IRR
- —
- Equity multiple
- 20.42×
- Total profit
- $61,188
- Equity at exit
- $1,677
- IRR
- —
- Equity multiple
- 43.69×
- Total profit
- $134,486
- Equity at exit
- $973
Cash invested: $3,150 (down + closing). Projections, not guarantees.
Landlord ↔ Tenant lean methodology
- Overall (STATE)
- 62 Landlord-Friendly
- State Michigan
- 62 Landlord-Friendly · EVEN
- County
- — inherits STATE
- City
- — inherits STATE
ZIP-level market 48214
- Active inventory
- 298
- Price-to-rent
- 0.7×
Monthly cashflow live
- Estimated rent
- $1,358 high interval (Pro) →
- Mortgage (P&I)
- −$59
- Tax from tax record
- −$20 /mo · $240/yr
- Insurance
- −$5
- HOA
- −$0
- Vacancy / Maint / Mgmt
- −$285
- Net cashflow
- $989
Break-even live
UW: 25.0% down · 7.5% · 30yr · 1.5% tax · 5.0% vac · 8.0% maint · 8.0% mgmt
Financing live
Cash to close
- Down payment
- $2,812
- Closing costs
- $338
- Reserves months
- —
- Total cash needed
- —
Loan-product check · same deal, 3 products live
Conventional
25% down · 7.5% · 30yr
- Down + closing
- —
- Monthly P&I
- —
- Monthly cashflow
- —
- DSCR
- —
- Eligible?
- —
Personal DTI + credit; lowest rate.
DSCR
20% down · 8.5% · 30yr
- Down + closing
- —
- Monthly P&I
- —
- Monthly cashflow
- —
- DSCR
- —
- Eligible?
- —
No personal income docs; deal must DSCR.
Hard money
10% down · 12.0% · 12mo
- Down + closing
- —
- Monthly P&I
- —
- Monthly cashflow
- —
- DSCR
- —
- Eligible?
- —
Short-term bridge; refi at stabilization.
Rent comps 40 comps
| Address | Beds | Baths | Sqft | Rent | $/sqft | DOM | Units | Dist |
|---|---|---|---|---|---|---|---|---|
| 3460 Field St Detroit, MI | 2.0 | 1.0 | 1000 | $1,260 | $1.26 | 4d | 1 | 0.20mi |
| 2972 Field St Detroit, MI | 3.0 | 1.0 | 1225 | $1,395 | $1.14 | 17d | 1 | 0.25mi |
| 3511 Concord Ave Detroit, MI | 2.0 | 1.0 | 750 | $1,100 | $1.47 | 43d | 1 | 0.50mi |
| 3980 Helen St Detroit, MI | 2.0 | 1.0 | 800 | $845 | $1.06 | 16d | 1 | 0.51mi |
| 8001 Kercheval Ave Detroit, MI | 1.0–2.0 | 1.0–2.0 | 984 | $2,270 | $2.31 | 1d | 3 | 0.56mi |
| 3475 Crane St Detroit, MI | 3.0 | 1.5 | 1000 | $1,338 | $1.34 | 43d | 1 | 0.57mi |
| 7410 Kercheval Ave Unit 212 Detroit, MI | 2.0 | 2.0 | 1017 | $1,950 | $1.92 | 43d | 1 | 0.61mi |
| 374 E Grand Blvd Unit 2A Detroit, MI | 2.0 | 2.0 | 1450 | $2,750 | $1.90 | 43d | 1 | 0.74mi |
| 1454 Townsend St #101 Detroit, MI | 2.0 | 2.0 | 1268 | $2,500 | $1.97 | 3d | 1 | 0.75mi |
| 4811 Seyburn St Detroit, MI | 3.0 | 1.0 | 1196 | $1,037 | $0.87 | 17d | 1 | 0.75mi |
| 2282 Belvidere St Unit 102 Detroit, MI | 2.0 | 2.0 | 1000 | $1,250 | $1.25 | 43d | 1 | 0.86mi |
| 4735 Rohns St Unit 6A Detroit, MI | 2.0 | 1.0 | 850 | $1,100 | $1.29 | 1d | 1 | 0.92mi |
| 4735 Rohns St Unit 4A Detroit, MI | 2.0 | 1.0 | 850 | $1,000 | $1.18 | 1d | 1 | 0.92mi |
| 4735 Rohns St Unit 2A Detroit, MI | 1.0 | 1.0 | 700 | $900 | $1.29 | 1d | 1 | 0.92mi |
| 3755 Ellery St Unit 1 Detroit, MI | 2.0 | 1.0 | 915 | $1,200 | $1.31 | 24d | 1 | 0.96mi |
| 1000 Van Dyke St Unit 205 Detroit, MI | 2.0 | 1.0 | 863 | $1,495 | $1.73 | 14d | 1 | 0.97mi |
| 1000 Van Dyke St Unit B02 Detroit, MI | 2.0 | 1.0 | 871 | $1,295 | $1.49 | 24d | 1 | 0.97mi |
| 1000 Van Dyke St Detroit, MI | 1.0–2.0 | 1.0 | 751 | $1,295 | $1.72 | 43d | 4 | 0.97mi |
| 7918 E Lafayette St #4 Detroit, MI | 3.0 | 1.0 | 1150 | $1,800 | $1.57 | 17d | 1 | 0.99mi |
| 1341 Crane St Detroit, MI | 1.0 | 1.0 | 750 | $995 | $1.33 | 1d | 1 | 1.00mi |
| 2544 Cadillac Blvd Unit 2 Detroit, MI | 2.0 | 1.0 | 973 | $825 | $0.85 | 23d | 1 | 1.08mi |
| 3032 Hurlbut St Unit 1 Detroit, MI | 2.0 | 1.0 | 950 | $900 | $0.95 | 3d | 1 | 1.09mi |
| 625 Field St Detroit, MI | 3.0 | 1.5 | 900 | $882 | $0.98 | 17d | 1 | 1.09mi |
| 5380 Maxwell St Unit 5380 Detroit, MI | 2.0 | 1.0 | 1100 | $900 | $0.82 | 17d | 1 | 1.10mi |
| 3323 Gratiot Ave Unit R Detroit, MI | 2.0 | 1.0 | 1200 | $975 | $0.81 | 43d | 1 | 1.14mi |
| 3325 Gratiot Ave Unit R Detroit, MI | 2.0 | 1.0 | 1200 | $1,000 | $0.83 | 43d | 1 | 1.14mi |
| 8845 E Jefferson Apt 208 Detroit, MI | 2.0 | 1.5 | 992 | $1,635 | $1.65 | 43d | 1 | 1.14mi |
| 8845 E Jefferson Ave Unit 206 Detroit, MI | 2.0 | 1.5 | 1230 | $1,660 | $1.35 | 43d | 1 | 1.15mi |
| 8845 E Jefferson Ave Unit 204 Detroit, MI | 2.0 | 1.5 | 1150 | $2,350 | $2.04 | 43d | 1 | 1.15mi |
| 8845 E Jefferson Ave Unit 207 Detroit, MI | 2.0 | 1.5 | 1500 | $1,695 | $1.13 | 43d | 1 | 1.15mi |
| 8845 E Jefferson Ave Unit 203 Detroit, MI | 2.0 | 1.5 | 1024 | $1,515 | $1.48 | 43d | 1 | 1.15mi |
| 8845 E Jefferson Ave Unit 205 Detroit, MI | 2.0 | 1.5 | 960 | $1,425 | $1.48 | 43d | 1 | 1.15mi |
| 8845 E Jefferson Ave Unit 302 Detroit, MI | 2.0 | 2.0 | 885 | $1,460 | $1.65 | 43d | 1 | 1.15mi |
| 8845 E Jefferson Ave Unit 102 Detroit, MI | 1.0 | 1.5 | 800 | $1,350 | $1.69 | 43d | 1 | 1.15mi |
| 8925 E Jefferson Ave Detroit, MI | 1.0–2.0 | 1.0–2.0 | 1050 | $1,945 | $1.85 | 43d | 9 | 1.15mi |
| 1130 Holcomb St Detroit, MI | 2.0 | 1.0 | 550 | $1,095 | $1.99 | 1d | 18 | 1.15mi |
| 4190 Hurlbut St Unit 2 Detroit, MI | 2.0 | 1.0 | 900 | $945 | $1.05 | 14d | 1 | 1.16mi |
| 7700 E Jefferson Ave Detroit, MI | 2.0 | 1.0 | 877 | $1,795 | $2.05 | 43d | 1 | 1.18mi |
| 3495 Garland St Detroit, MI | 2.0 | 1.0 | 1100 | $900 | $0.82 | 43d | 1 | 1.19mi |
| 3501 Garland St Detroit, MI | 2.0 | 1.0 | 1000 | $900 | $0.90 | 24d | 1 | 1.19mi |
Listing history 28 events
-
2025-12-09$11,250 Active 951-char remark
Show marketing remark (951 chars)
Property needs a full rehab top to bottom, but don't let that scare you away. The right investor will certainly turn a profit on this Islandview 2 bedroom ranch, just west of West Village. Islandview is named for its proximity to Detroit's island park, Belle Isle. The neighborhood is bound by Jefferson on the south, Mack to the north, Mt. Elliott to the west and Baldwin Street on the east. Please note that the Detroit Land Bank Authority is entitled to a tax capture for the 5 tax years subsequent to transferring ownership of the property. The tax capture may be incompatible with tax abatements and lot combinations that are otherwise available to the selected purchaser. DLBA will review requests to waive its tax capture rights and may require a payment in lieu of taxes to approve such requests. The payment will be determined upon reviewing the development proforma and effect of any tax abatements on the purchase and development financing.
-
2025-12-06historical
-
2025-12-05status Active
-
2025-10-14status Pending
-
2025-10-14status Pending
-
2025-10-14historical
-
2025-02-03status Active
-
2025-02-03status Active
-
2024-12-17status Pending
-
2024-07-24historical
-
2024-05-22status Pending
-
2024-05-22status Pending
-
2024-04-17$11,250 Active
-
2024-04-17$11,250 Active
-
2023-12-26$11,250 Active
-
2021-10-02status Pending
-
2021-10-02status Pending
-
2021-08-16historical Accepting Backup Offers
-
2021-08-16historical Accepting Backup Offers
-
2021-08-16historical
-
2021-08-16historical
-
2021-01-05price $11,250
-
2021-01-04price $11,250
-
2020-10-27price $15,000
-
2020-10-27price $15,000
-
2020-08-05$18,000 Active
-
2020-08-05$18,000 Active
ⓘ Source: listings_history table (triggers on properties + properties_extension) + one-shot
backfill from property_details.listing_events for pre-trigger history.
Tax reassessment forecast MI · Partial reset (capped growth)
- Current annual tax
- $240 · $20/mo
- Projected year-2 tax
- $240 · $20/mo
- Expected delta
- $0/yr ($0/mo · 0.0%)
ⓘ Screening estimate from a state-policy table — verify with the county assessor before closing.
Climate risk First Street
- Flood 1/10 Low FEMA zone X (unshaded) · 0% chance over 30 yrs
- Wildfire 1/10 Low
- Heat 3/10 Moderate 7 d/yr ≥96°F today · 15 d/yr by 30 yrs out
- Wind 2/10 Low
- Air quality 3/10 Moderate 2 unhealthy d/yr today · 5 by 30 yrs out
Nearby sold comps map
Loading sold comps map…
Walkable amenities ~0.75 mi
Loading nearby amenities…
Taxation est. · year 1
- Rental income
- $16,293
- − Mortgage interest
- −$630
- − Property taxes
- −$240
- − Insurance
- −$56
- − Repairs & maintenance
- −$1,303
- − Management
- −$1,303
- − Depreciation
- −$327
- Taxable income
- $12,433
- Est. tax owed @ 24.0%
- −$2,984
- After-tax cash flow
- $8,884/yr
For passive investors: Depreciation is non-cash, so a rental often shows a tax loss while cash-flowing — sheltering income. Rental losses are passive: they offset passive income freely, and up to $25,000/yr can offset ordinary (W-2) income if you actively participate and your MAGI is under $100k (phasing out to $0 by $150k); unused losses carry forward. On sale, claimed depreciation is recaptured at up to 25%, and gains may owe capital-gains tax (a 1031 exchange can defer both). Figures are a year-1 estimate at your 24.0% rate — not tax advice; consult a CPA.
Schools (NCES district)
- District
- Detroit Public Schools Community District
- NCES district ID
- 2601103
- Math proficiency
- 10% ▼ -2.00%
- Reading proficiency
- 24% ▲ 6.00%
- Median HH income
- $25,815
- Composite
- 13.06/100
- National rank
- #9564
- State rank
- #499 of 540 in MI
Livability — Detroit
- Score
- 73/100
- State rank
- #218
- US rank
- #5427
Category grades
Schools grade is shown separately in the Schools card above.
Census & demographics
- Census place
- Detroit, MI
- County
- Wayne County · 1,562,939 people
- City population
- 572,865
- Metro
- Detroit-Warren-Dearborn, MI
- Population (ZIP)
- 18,595
- Household income
- $33,544
- Rent vs Own
- Severe rent burden
- 1364.0
Population outlook (Wayne County) Hauer SSP2
- Today (2025)
- 1,675,273 people
- By 2030
- 1,620,300 · -3.3%
- By 2040
- 1,502,341 · -10.3%
- By 2050
- 1,384,039 · -17.4%
- By 2075
- 1,124,592 · -32.9%
- By 2100
- 881,193 · -47.4%
Race, ethnicity, and origin ACS 2023
- Neighborhood character
- Predominantly Black (79%)
- Race & ethnicity
- Black 79% White 16% Two or more races 4%
- Common ancestry
- Romanian 1% Iranian 1% Lithuanian 1%
- Foreign-born
- 3% · Canada, Jamaica
- Languages at home
- 98% English-only · Spanish 1%
Political lean MEDSL · Wayne
- 2024 margin
- Strong D (+29.0) · D 62.7% · R 33.7% · Other 3.6%
- 2008→2024 swing
- -20.5pp toward R · 2008: 49.5pp · 2024: 29.0pp
- All cycles
- 2024: D+29.0 2020: D+38.1 2016: D+37.3 2012: D+46.9 2008: D+49.5
Not yet ingested
- Civics
- —
Market trends
- HPI YoY
- ▼ -367.43%
- Current HPI
- 102.0969
- Rent YoY
- —
- Metro
- Detroit-Warren-Dearborn, MI
- State GDP YoY
- ▲ 1.37%
- F500 in state
- 28
Industry mix (Fortune 500 HQ in MI)
| Industry | F500 HQs | Revenue |
|---|---|---|
| Automotive Parts | 3 | $48B |
|
||
| Automotive | 2 | $372B |
|
||
| Chemicals | 1 | $45B |
|
||
| Automotive Retail | 1 | $29B |
|
||
| Healthcare / Medical Devices | 1 | $23B |
|
||
| Automotive Technology | 1 | $20B |
|
||
Price history
-37.5% since first listed28 events — show timeline
- 2025-12-09 Listed $11,250 REALCOMP
- 2025-12-09 Listed $11,250 MiRealSource-MiMLS
- 2025-12-06 Listing Removed — MiRealSource-MiMLS
- 2025-12-05 Relisted — REALCOMP
- 2025-10-14 Pending — MiRealSource-MiMLS
- 2025-10-14 Pending — REALCOMP
- 2025-10-14 Listing Removed — REALCOMP
- 2025-02-03 Relisted — MiRealSource-MiMLS
- 2025-02-03 Relisted — REALCOMP
- 2024-12-17 Pending — REALCOMP
- 2024-07-24 Listing Removed — MiRealSource-MiMLS
- 2024-05-22 Pending — MiRealSource-MiMLS
- 2024-05-22 Pending — REALCOMP
- 2024-04-17 Listed $11,250 REALCOMP
- 2024-04-17 Listed $11,250 MiRealSource-MiMLS
- 2023-12-26 Listed $11,250 MiRealSource-MiMLS
- 2021-10-02 Pending — MiRealSource-MiMLS
- 2021-10-02 Pending — REALCOMP
- 2021-08-16 Contingent — MiRealSource-MiMLS
- 2021-08-16 Contingent — REALCOMP
- 2021-08-16 Listing Removed — MiRealSource-MiMLS
- 2021-08-16 Listing Removed — REALCOMP
- 2021-01-05 Price Changed $11,250 MiRealSource-MiMLS
- 2021-01-04 Price Changed $11,250 REALCOMP
- 2020-10-27 Price Changed $15,000 MiRealSource-MiMLS
- 2020-10-27 Price Changed $15,000 REALCOMP
- 2020-08-05 Listed $18,000 MiRealSource-MiMLS
- 2020-08-05 Listed $18,000 REALCOMP
Property tax history
-17.8%/yrLatest (2016): $240 · -42.2% YoY. Source: county tax records.
Cash-flow waterfall
monthlySold comps — $/sqft
last 12 mo · ≤1 miLoading sold comps…