6748 Holly Heath Dr · Progress Village, FL
Flood risk 1/10 · Minimal
- FEMA flood zone
- X (unshaded)
- Chance of flooding over 30 yrs
- 0.0%
- Est. flood insurance / yr
- $507 – $1,088
Fire risk 4/10 · Minor
- Est. fire insurance / yr
- $947 – $1,759
Heat risk 10/10 · Severe
- Hot days now (above 108°F)
- 7 days/yr
- Hot days in 30 yrs
- 27 days/yr
Wind risk 9/10 · Severe
- Chance of severe wind over 30 yrs
- 99.0%
Air-quality risk 3/10 · Minor
- Unhealthy air days now
- 3 days/yr
- Unhealthy air days in 30 yrs
- 4 days/yr
Risk factors via First Street. Map © Google.
Why this score? — see what drove the D- grade
The composite is a weighted blend of 9 inputs, each scored 0–100. Each bar is that input's sub-score; the figure is the points it added to the 100-point composite (weight × sub-score).
- Cash flow +10.2/30.0
- ARV discount +7.5/15.0
- 1% rule +4.7/10.0
- Schools +4.2/10.0
- Livability +3.7/5.0
- DSCR +2.9/10.0
- Condition / age +2.5/5.0
- Rent growth +2.3/5.0
- Appreciation +0.0/10.0
$249,900
🖨 Deal sheet 📄 Offer letter ✓ Due diligence
Listing remarks MLS
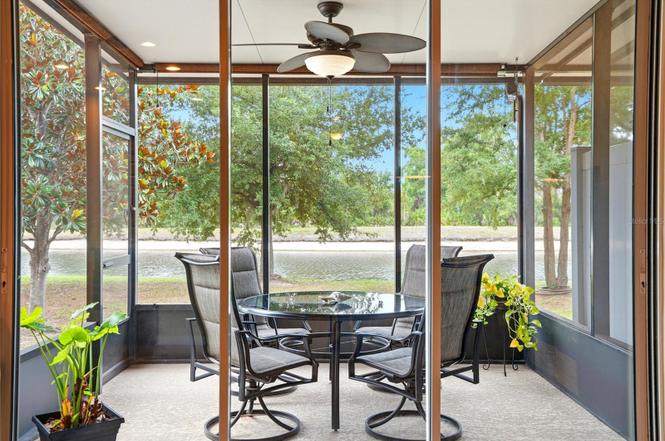
One or more photo(s) has been virtually staged. Carefree living at its best. Enjoy each day in this easy maintenance townhome that's nestled in a quiet community. This property offers 3 bedrooms, 2.5 baths, 1,400 square feet of living space and a 1 car attached garage. The kitchen has ceramic tile floors, granite counter tops, stainless appliances, closet pantry and center island. Easy flow into the dining and living room and is perfect for entertaining and family gatherings. The master bedroom has a ceiling fan and a private ensuite bath that features double sink vanity, tile floors, and separate shower. The second bathroom has a large vanity and tile floors. Enjoy your morning coffee in your private screened porch with ceiling fan for added comfort. Other great features in this home are roller shades in lanai, water softening system, custom pantry shelving, new garbage disposal and spacious laundry room with storage cabinets and drying bar. Walking distance to community pool, tropical landscaping and easy access to I-75 and crosstown expressway. Convenient to schools, shopping and great restaurants. Low HOA's that include cable, internet, water & trash. Move in ready for your enjoyment.
Key facts
- Screened-in porch
- Easy access to i-75
- $330 HOA
Tags
Property features AI
Finance
- Other: Total annual HOA/fees $3,960; Property listed as unfurnished
- Financial info: Other annual assessment $564; Annual taxes reported
- HOA & community: HOA managed by Castle Management Group; Monthly HOA fee $330; HOA covers cable TV, internet, trash and water; Community pool; Association recreation (owned); Pets allowed; CDD present
Exterior
- Parking: Attached garage; 1-car garage (12 x 10)
- Utilities: Public water; Public sewer; Public utilities
- Home design: Townhouse; Residential property; Two levels; Faces east; Located in a planned development (PD); Homesteaded
- Construction: Block and stucco construction; Shingle roof; Slab foundation; Built as part of Oak Creek community
- Exterior features: Covered patio/porch; Screened patio/porch; Sidewalk; Other exterior features
Interior
- Kitchen: Dishwasher; Disposal; Microwave; Range; Refrigerator
- Bedrooms: 3 bedrooms
- Flooring: Carpet; Ceramic tile
- Bathrooms: 2 full bathrooms; 1 half bathroom
- Heating & cooling: Central heating (electric); Central air conditioning
- Interior features: Ceiling fans; Blinds
- Laundry & utility: Laundry inside
Neighborhood map
What this means for you Summary
Snapshot
- This is a 3-bed/3.0-bath townhouse listed at $250k.
Deal economics
- At list price, monthly cash flow is $-141 ($-2k/yr) — negative.
- To cash-flow at today's rent, offer at most $225k (10.0% below list).
- To meet the 1% rule (rent ≥ 1% of price), the offer needs to be $243k (2.7% below list).
- Recommended offer: $225k (10.0% below list) — sets the bar for cash-flow.
Location & tenants
- Location reads 73/100 on livability (#298 in FL) — a middle-class / working-renter tenant base. Strengths: housing A+, employment A, cost of living A-; Watch: amenities F, health & safety F.
- Hillsborough (suburban): math 47% / reading 50% proficiency, ranked #41 of 73 in FL (top 56%) — families likely to look elsewhere, expect single-tenant / working-renter base with shorter leases.
- Zoned schools: Spoto High School (math 25% / reading 36%, grade F, #434 of 667 statewide, top 66%, 1,823 students, 57% FRL).
- Zoned-school proficiency averages 30% at this address vs 48% district-wide (-18 pts) — the specific schools serving this property underperform the Hillsborough average; the district grade overstates school quality for this exact location.
- Market conditions: Rents soft (-0.9%/yr); 559 active listings in the ZIP; 40 comparable units currently listed for rent nearby; rentals at typical pace (median 24d on market — plan ~3-4 weeks tenant-placement turnaround); solid renter incomes; 9,053 units permitted in Hillsborough County in 2024 (4,555 in 5+ unit buildings).
- This rent runs 34% of the median local income ($86k/yr) — at the standard rent-burdened threshold; future hikes will face affordability resistance.
Forward outlook
- Local home prices are declining (-3.0%/yr); year-one equity from $2k of loan paydown is wiped out by about $7k of value loss. Plan a longer hold.
- Hillsborough County population projected at +37% by 2050 — long-run rental-demand tailwind backs the buy-and-hold thesis.
Negotiation context
- Only 7 days on market — expect competitive offers; lowballing is unlikely to land.
- 3 sale attempts since 11y ago with the ask held roughly flat each time — persistent listings suggest the price (not the market) is what's stuck; bring a comps-based counter.
- Current owner paid $175k; 43% above their basis — modest negotiation headroom, anchor on the comps not their cost.
Risks & watch-outs
- Climate carrying-cost: severe wind risk, 99% chance of damaging wind over 30y; extreme-heat days projected 7→27/yr by 2055 (HVAC capex compounding) — expect insurance premiums to compound above CPI over the hold.
Questions for the listing agent
- What do current leases actually rent for vs. the listed asking? Can we see a recent rent roll and the last 12 months of T-12 income?
- What does the HOA fee cover, when was the last increase, and are there any pending special assessments or reserve-fund shortfalls?
- Is there a deadline driving the sale (1031 exchange, divorce, estate, relocation)? That informs how much negotiation room exists.
- The area grade is low — what's the realistic commute time and amenity access for the typical tenant pool here? Any planned neighborhood developments (good or bad) we should know about?
- What's the average days-on-market for RENTAL listings here right now (not sales)? A rising rental-DOM trend means longer vacancies and softer asking-rent achievability than the comps imply.
- What's the recent tenant-quality profile in this submarket — average credit score on applications, eviction rate, late-payment / NSF rate, and stable-employment percentage? A property-management company in the area should have these aggregated.
- How much new for-sale + rental construction is in the pipeline within 1–3 miles? Heavy new supply typically softens prices + rents 12–24 months out; constrained supply supports both.
Investment metrics
- 1% rule
- 0.97% ✗
- Cap rate
- 5.62%
- Cash-on-cash
- -2.42%
- DSCR
- 0.89
- GRM
- 8.6
CMA / ARV
No comps found within radius.
Projected returns pro-forma
-3.0% appreciation · 0.0% rent growth · sell at horizon
- IRR
- -24.4%
- Equity multiple
- 0.19×
- Total profit
- $-56,362
- Equity at exit
- $37,261
- IRR
- -35.6%
- Equity multiple
- -0.25×
- Total profit
- $-87,208
- Equity at exit
- $21,607
Cash invested: $69,972 (down + closing). Projections, not guarantees.
Landlord ↔ Tenant lean methodology
- Overall (STATE)
- 87 Strongly Landlord-Friendly
- State Florida
- 87 Strongly Landlord-Friendly · R+3
- County
- — inherits STATE
- City
- — inherits STATE
ZIP-level market 33578
- Home prices YoY
- -12.9%
- Rents YoY
- -0.9%
- Active inventory
- 559
- Price-to-rent
- 8.6×
Monthly cashflow live
- Estimated rent
- $2,432 high interval (Pro) →
- Mortgage (P&I)
- −$1,311
- Tax from tax record
- −$318 /mo · $3,816/yr
- Insurance
- −$104
- HOA
- −$330
- Vacancy / Maint / Mgmt
- −$511
- Net cashflow
- $-141
Break-even live
UW: 25.0% down · 7.5% · 30yr · 1.5% tax · 5.0% vac · 8.0% maint · 8.0% mgmt
Financing live
Cash to close
- Down payment
- $62,475
- Closing costs
- $7,497
- Reserves months
- —
- Total cash needed
- —
Loan-product check · same deal, 3 products live
Conventional
25% down · 7.5% · 30yr
- Down + closing
- —
- Monthly P&I
- —
- Monthly cashflow
- —
- DSCR
- —
- Eligible?
- —
Personal DTI + credit; lowest rate.
DSCR
20% down · 8.5% · 30yr
- Down + closing
- —
- Monthly P&I
- —
- Monthly cashflow
- —
- DSCR
- —
- Eligible?
- —
No personal income docs; deal must DSCR.
Hard money
10% down · 12.0% · 12mo
- Down + closing
- —
- Monthly P&I
- —
- Monthly cashflow
- —
- DSCR
- —
- Eligible?
- —
Short-term bridge; refi at stabilization.
Rent comps 40 comps
| Address | Beds | Baths | Sqft | Rent | $/sqft | DOM | Units | Dist |
|---|---|---|---|---|---|---|---|---|
| 7007 Towne Lake Rd Riverview, FL | 3.0 | 2.5 | 1400 | $3,800 | $2.71 | 24d | 1 | 0.08mi |
| 6705 Holly Heath Dr Riverview, FL | 3.0 | 2.5 | 1420 | $2,150 | $1.51 | 14d | 1 | 0.11mi |
| 6978 Holly Heath Dr Riverview, FL | 3.0 | 2.5 | 1400 | $2,100 | $1.50 | 24d | 1 | 0.16mi |
| 6614 Holly Heath Dr Riverview, FL | 3.0 | 3.0 | 1540 | $2,350 | $1.53 | 24d | 1 | 0.17mi |
| 7012 Holly Heath Dr Riverview, FL | 3.0 | 2.5 | 1400 | $2,000 | $1.43 | 24d | 1 | 0.18mi |
| 6925 Towering Spruce Dr Riverview, FL | 2.0 | 2.5 | 1176 | $1,795 | $1.53 | 14d | 1 | 0.34mi |
| 6925 Towering Spruce Dr Unit 1 Riverview, FL | 2.0 | 2.5 | 1176 | $1,895 | $1.61 | 24d | 1 | 0.34mi |
| 8317 Moccasin Trail Dr Unit 1227829P Riverview, FL | 3.0 | 2.0 | 1571 | $4,525 | $2.88 | 16d | 1 | 0.37mi |
| 7514 Forest Mere Dr Riverview, FL | 3.0 | 2.0 | 1716 | $4,000 | $2.33 | 24d | 1 | 0.38mi |
| 8530 Quarter Horse Dr Riverview, FL | 3.0 | 2.0 | 1278 | $2,000 | $1.56 | 10d | 1 | 0.40mi |
| 8530 Quarter Horse Dr Riverview, FL | 3.0 | 2.0 | 1278 | $2,000 | $1.56 | 24d | 1 | 0.40mi |
| 8220 Midnight Sun Ct Riverview, FL | 3.0 | 2.0 | 1275 | $1,900 | $1.49 | 24d | 1 | 0.41mi |
| 8969 Indigo Trail Loop Riverview, FL | 3.0 | 2.5 | 1707 | $2,200 | $1.29 | 24d | 1 | 0.49mi |
| 8959 Indigo Trail Loop Riverview, FL | 3.0 | 2.5 | 1785 | $2,200 | $1.23 | 24d | 1 | 0.50mi |
| 8933 Indigo Trail Loop Riverview, FL | 3.0 | 2.5 | 1785 | $2,295 | $1.29 | 16d | 1 | 0.52mi |
| 8868 Indigo Trail Loop Unit 8868 Riverview, FL | 3.0 | 2.5 | 1707 | $2,300 | $1.35 | 3d | 1 | 0.57mi |
| 6768 Breezy Palm Dr Riverview, FL | 2.0 | 2.0 | 1298 | $1,800 | $1.39 | 20d | 1 | 0.59mi |
| 8549 Deer Chase Dr Riverview, FL | 3.0 | 2.0 | 1592 | $2,300 | $1.44 | 16d | 1 | 0.60mi |
| 7046 Grand Elm Dr Riverview, FL | 3.0 | 2.5 | 1400 | $2,000 | $1.43 | 17d | 1 | 0.61mi |
| 7113 Grand Elm Dr Riverview, FL | 3.0 | 2.5 | 1400 | $1,900 | $1.36 | 10d | 1 | 0.62mi |
| 7014 Grand Elm Dr Riverview, FL | 3.0 | 2.5 | 1374 | $2,090 | $1.52 | 24d | 1 | 0.62mi |
| 6714 Breezy Palm Dr Riverview, FL | 3.0 | 2.5 | 1609 | $2,200 | $1.37 | 4d | 1 | 0.63mi |
| 9092 Moonlit Meadows Loop Riverview, FL | 2.0 | 2.0 | 1018 | $1,850 | $1.82 | 13d | 1 | 0.64mi |
| 8683 Holly Grove Ct Riverview, FL | 3.0 | 2.5 | 1525 | $2,299 | $1.51 | 2d | 6 | 0.65mi |
| 9120 Moonlit Meadows Loop Riverview, FL | 2.0 | 2.5 | 1260 | $1,850 | $1.47 | 24d | 1 | 0.65mi |
| 7102 Summer Holly Pl Riverview, FL | 3.0 | 2.5 | 1576 | $2,100 | $1.33 | 24d | 1 | 0.65mi |
| 8828 Kanawha Rd Riverview, FL | 2.0 | 2.0 | 950 | $1,450 | $1.53 | 24d | 1 | 0.94mi |
| 9515 Grovedale Cir #101 Riverview, FL | 3.0 | 2.0 | 1151 | $1,800 | $1.56 | 24d | 1 | 1.15mi |
| 9520 Amberdale Ct #101 Riverview, FL | 3.0 | 2.0 | 1151 | $2,150 | $1.87 | 4d | 1 | 1.16mi |
| 6118 Magnolia Park Blvd Riverview, FL | 3.0 | 2.0 | 1551 | $2,600 | $1.68 | 24d | 1 | 1.21mi |
| 6425 Cypressdale Dr #101 Riverview, FL | 3.0 | 2.0 | 1151 | $1,950 | $1.69 | 24d | 1 | 1.27mi |
| 6101 Innovation Way Tampa, FL | 1.0–3.0 | 1.0–2.0 | 1089 | $2,250 | $2.07 | 4d | 12 | 1.30mi |
| 5940 Sweet Birch Dr Riverview, FL | 3.0 | 2.0 | 1554 | $2,500 | $1.61 | 11d | 1 | 1.31mi |
| 9736 Carlsdale Dr Riverview, FL | 3.0 | 2.5 | 1575 | $1,850 | $1.17 | 14d | 1 | 1.33mi |
| 9519 Newdale Way #201 Riverview, FL | 3.0 | 2.0 | 1151 | $1,650 | $1.43 | 24d | 1 | 1.37mi |
| 9538 Newdale Way #101 Riverview, FL | 3.0 | 2.0 | 1151 | $1,895 | $1.65 | 24d | 1 | 1.38mi |
| 9520 Newdale Way Riverview, FL | 3.0 | 2.0 | 1151 | $1,700 | $1.48 | 1d | 1 | 1.40mi |
| 9711 Magnolia View Ct Riverview, FL | 1.0–3.0 | 1.0–2.0 | 1069 | $2,682 | $2.51 | 2d | 31 | 1.40mi |
| 8825 Oak St Riverview, FL | 3.0 | 2.0 | 1086 | $2,500 | $2.30 | 24d | 1 | 1.46mi |
| 10124 Cannon Dr Riverview, FL | 4.0 | 2.0 | 1796 | $2,450 | $1.36 | 24d | 1 | 1.48mi |
HOA detail
- Monthly dues
- $330 · $3,960/yr
- Likely covers
- watertrashinternetcablelandscapingpool
Listing history 7 events
-
2026-06-18days on market $249,900 Active 7 DOM
-
2026-06-17days on market $249,900 Active 6 DOM
-
2026-06-16days on market $249,900 Active 5 DOM
-
2026-06-15days on market $249,900 Active 4 DOM
-
2026-06-13days on market $249,900 Active 2 DOM
-
2026-06-13remarks 695-char remark
-
2026-06-13$249,900 Active 1 DOM
ⓘ Source: listings_history table (triggers on properties + properties_extension) + one-shot
backfill from property_details.listing_events for pre-trigger history.
Tax reassessment forecast FL · Resets to sale price
- Current annual tax
- $3,816 · $318/mo
- Projected year-2 tax
- $3,816 · $318/mo
- Expected delta
- $0/yr ($0/mo · 0.0%)
ⓘ Screening estimate from a state-policy table — verify with the county assessor before closing.
Climate risk First Street
- Flood 1/10 Low FEMA zone X (unshaded) · 0% chance over 30 yrs
- Wildfire 4/10 Moderate
- Heat 10/10 Extreme 7 d/yr ≥108°F today · 27 d/yr by 30 yrs out
- Wind 9/10 Extreme 99% chance of damaging wind over 30 yrs
- Air quality 3/10 Moderate 3 unhealthy d/yr today · 4 by 30 yrs out
Nearby sold comps map
Loading sold comps map…
Walkable amenities ~0.75 mi
Loading nearby amenities…
Taxation est. · year 1
- Rental income
- $29,189
- − Mortgage interest
- −$13,998
- − Property taxes
- −$3,816
- − Insurance
- −$1,250
- − Repairs & maintenance
- −$2,335
- − Management
- −$2,335
- − HOA
- −$3,960
- − Depreciation
- −$7,270
- Taxable loss
- −$5,775
- Est. tax savings @ 24.0%
- +$1,386
- After-tax cash flow
- $-306/yr
For passive investors: Depreciation is non-cash, so a rental often shows a tax loss while cash-flowing — sheltering income. Rental losses are passive: they offset passive income freely, and up to $25,000/yr can offset ordinary (W-2) income if you actively participate and your MAGI is under $100k (phasing out to $0 by $150k); unused losses carry forward. On sale, claimed depreciation is recaptured at up to 25%, and gains may owe capital-gains tax (a 1031 exchange can defer both). Figures are a year-1 estimate at your 24.0% rate — not tax advice; consult a CPA.
Schools (NCES district)
- District
- Hillsborough
- NCES district ID
- 1200870
- Math proficiency
- 47% ▼ -8.00%
- Reading proficiency
- 50% ▼ -4.00%
- Median HH income
- $50,622
- Composite
- 41.6/100
- National rank
- #3435
- State rank
- #41 of 73 in FL
Livability — Progress Village
- Score
- 73/100
- State rank
- #298
- US rank
- #5091
Category grades
Schools grade is shown separately in the Schools card above.
Census & demographics
- Census place
- Progress Village, FL
- County
- Hillsborough County · 1,540,968 people
- Metro
- Tampa-St. Petersburg-Clearwater, FL
- Population (ZIP)
- 60,651
- Household income
- $85,921
- Rent vs Own
- Severe rent burden
- 3063.0
Population outlook (Hillsborough County) Hauer SSP2
- Today (2025)
- 1,607,022 people
- By 2030
- 1,733,968 · +7.9%
- By 2040
- 1,979,565 · +23.2%
- By 2050
- 2,203,427 · +37.1%
- By 2075
- 2,667,893 · +66.0%
- By 2100
- 2,891,558 · +79.9%
Race, ethnicity, and origin ACS 2023
- Neighborhood character
- Diverse neighborhood (Simpson 0.69)
- Race & ethnicity
- White 43% Hispanic / Latino 26% Black 23% Two or more races 17% Asian 3%
- Hispanic origin (detail)
- Mexican 4% Puerto Rican 8% Cuban 3% Dominican 4%
- Common ancestry
- Romanian 3% Hispanic 3% Lithuanian 2%
- Foreign-born
- 14% · Canada, Jamaica, China
- Languages at home
- 73% English-only · Spanish 19% French/Haitian/Cajun 3% Other Indo-European 2%
Political lean MEDSL · Hillsborough
- 2024 margin
- Toss-up / Even · D 47.8% · R 50.9% · Other 1.3%
- 2008→2024 swing
- -10.2pp toward R · 2008: 7.1pp · 2024: -3.1pp
- All cycles
- 2024: R+3.1 2020: D+6.9 2016: D+6.8 2012: D+6.7 2008: D+7.1
Not yet ingested
- Civics
- —
Market trends
- HPI YoY
- ▼ -48.42%
- Current HPI
- 326.0368
- Rent YoY
- ▼ -0.95%
- Metro
- Tampa-St. Petersburg-Clearwater, FL
- State GDP YoY
- ▲ 3.28%
- F500 in state
- 36
Industry mix (Fortune 500 HQ in FL)
| Industry | F500 HQs | Revenue |
|---|---|---|
| Industrial Technology | 2 | $29B |
|
||
| Insurance | 2 | $17B |
|
||
| Retail | 1 | $60B |
|
||
| Technology Distribution | 1 | $58B |
|
||
| Homebuilding | 1 | $35B |
|
||
| Technology Manufacturing | 1 | $35B |
|
||
Price history
+73.5% since first listed9 events — show timeline
- 2026-06-11 Listed $249,900 Stellar MLS as Distributed by MLS Grid
- 2019-08-07 Sold (Public Records) $175,000 Public Records
- 2019-07-31 Sold (MLS) $175,000 Stellar MLS as Distributed by MLS Grid
- 2019-06-19 Pending — Stellar MLS as Distributed by MLS Grid
- 2019-06-13 Listed $179,900 Stellar MLS as Distributed by MLS Grid
- 2015-06-19 Sold (MLS) $135,000 Stellar MLS as Distributed by MLS Grid
- 2015-06-08 Sold (Public Records) $136,000 Public Records
- 2015-05-04 Pending — Stellar MLS as Distributed by MLS Grid
- 2015-04-03 Listed $144,000 Stellar MLS as Distributed by MLS Grid
Property tax history
+5.2%/yrLatest (2025): $3,816 · +6.5% YoY. Source: county tax records.
Cash-flow waterfall
monthlySold comps — $/sqft
last 12 mo · ≤1 miLoading sold comps…