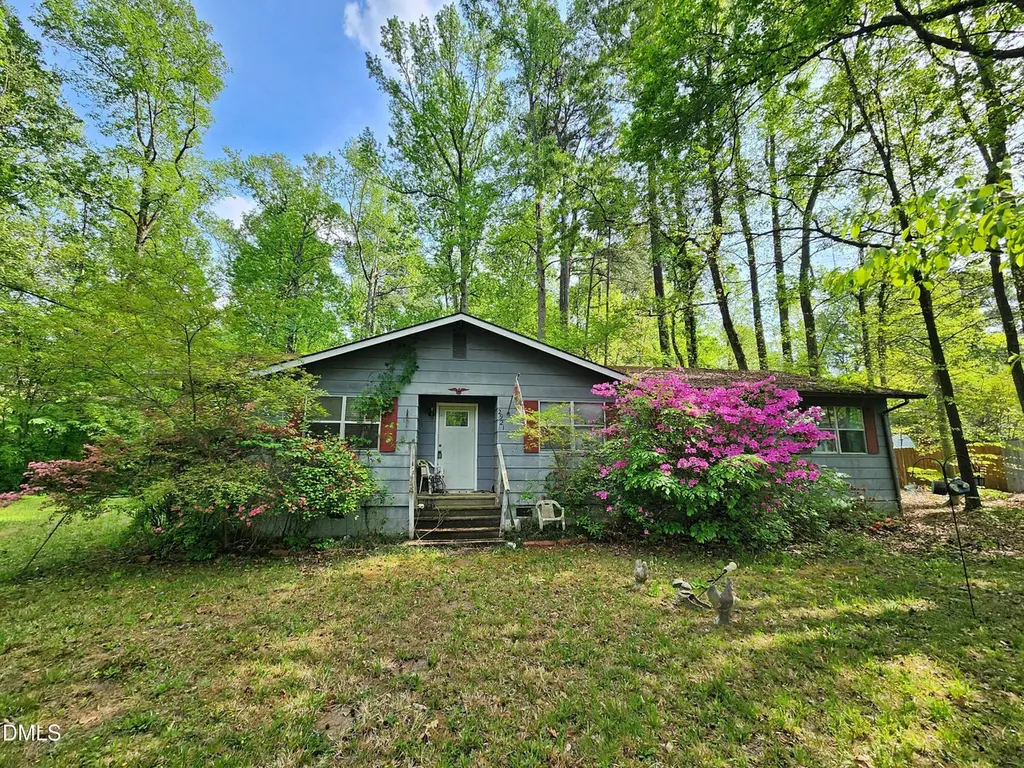
2921 Carolyn Dr · Durham, NC
Flood risk 6/10 · Moderate
- FEMA flood zone
- AE
- Chance of flooding over 30 yrs
- 0.75%
- Est. flood insurance / yr
- $1,737 – $8,500
Fire risk 2/10 · Minimal
- Est. fire insurance / yr
- $906 – $1,684
Heat risk 6/10 · Moderate
- Hot days now (above 105°F)
- 7 days/yr
- Hot days in 30 yrs
- 17 days/yr
Wind risk 6/10 · Moderate
- Chance of severe wind over 30 yrs
- 27.0%
Air-quality risk 2/10 · Minimal
- Unhealthy air days now
- 1 days/yr
- Unhealthy air days in 30 yrs
- 1 days/yr
Risk factors via First Street. Map © Google.
Why this score? — see what drove the B- grade
The composite is a weighted blend of 9 inputs, each scored 0–100. Each bar is that input's sub-score; the figure is the points it added to the 100-point composite (weight × sub-score).
- Cash flow +29.9/30.0
- DSCR +10.0/10.0
- 1% rule +9.1/10.0
- ARV discount +7.5/15.0
- Livability +4.0/5.0
- Schools +3.0/10.0
- Rent growth +2.7/5.0
- Condition / age +2.5/5.0
- Appreciation +0.0/10.0
$139,900
🖨 Deal sheet 📄 Offer letter ✓ Due diligence
Listing remarks
Major fixer upper and possible tear down. Large lot, over an acre. Would need to check with the city if they will allow multifamily on the lot. Great location with good access to highways, downtown Durham, parks, work centers, and RDU airport. This is an entry only listing. Please see agent remarks or contact list agent with questions.
Key facts
- Access to parks
- Large lot
- 1.16 acre lot
Tags
Property features AI
Finance
- Other: County: Durham
- HOA & community: No homeowners association; Not a senior community
Exterior
- Utilities: Public water; Public sewer
- Home design: Site-built single-story home; Above-grade living area approximately 1,444
- Construction: Masonite exterior; Site built construction; One-level structure
- Exterior features: Shingle roof; Property sits on approximately 1.16 acres; Lot dimensions roughly 342 x 200 x 163 x 283; Zoned R-8; Publicly maintained road access
Interior
- Bedrooms: 4 bedrooms (all on the main level)
- Flooring: See remarks for flooring details
- Bathrooms: 2 full bathrooms
- Heating & cooling: Forced air heating; Central air conditioning
- Interior features: Fixer condition; Wooded vegetation surrounding the property
Neighborhood map
What this means for you Summary
Snapshot
- This is a 4-bed/2.0-bath single-family listed at $140k.
Deal economics
- At list price, monthly cash flow is $91 ($1k/yr) — positive.
- The deal already cash-flows at list — no discount required.
- Meets the 1% rule at list price ($2k rent vs $140k).
- Recommended offer: $136k (3.0% below list) — sets the bar for market timing.
- Cap rate 10.7% vs local median 3.0% in Durham — top-decile yield for the area; either an underpriced asset or a hidden risk that comps aren't pricing in. Stress-test before assuming the spread holds.
Location & tenants
- Location reads 81/100 on livability (#15 in NC, #1,411 nationally) — a professional / high-income tenant draw. Strengths: amenities A+, commute A+, housing A+; Watch: schools D+, crime F.
- Durham Public Schools (urban): math 29% / reading 39% proficiency, ranked #132 of 178 in NC (top 74%) — families likely to look elsewhere, expect single-tenant / working-renter base with shorter leases.
- Market conditions: Rents flat; 1103 active listings in the ZIP; 13 comparable units currently listed for rent nearby; rentals at typical pace (median 24d on market — plan ~3-4 weeks tenant-placement turnaround); solid renter incomes; 2,905 units permitted in Durham County in 2024 (955 in 5+ unit buildings).
Forward outlook
- Local home prices are declining (-3.0%/yr); year-one equity from $967 of loan paydown is wiped out by about $4k of value loss. Plan a longer hold.
- Durham County population projected at +44% by 2050 — long-run rental-demand tailwind backs the buy-and-hold thesis.
Negotiation context
- It's been on market 46 days — a 3% lower offer ($136k) is reasonable based on typical stale-listing flexibility.
- Current owner paid $90k; list at $140k implies a 55% gain — meaningful room to come down on a strong offer.
Risks & watch-outs
- Watch-outs: flood insurance adds $427/mo.
- Climate carrying-cost: in FEMA flood zone AE (mandatory federal flood insurance); major wind risk, 27% chance of damaging wind over 30y; extreme-heat days projected 7→17/yr by 2055 (HVAC capex compounding) — expect insurance premiums to compound above CPI over the hold.
Questions for the listing agent
- It's been on market 46 days. Have you received any prior offers? Is the seller open to a 3% concession, seller financing, or rate buy-down credit?
- What's the actual annual flood-insurance premium (NFIP or private), and is the property in a SFHA with mandatory coverage?
- Is there a deadline driving the sale (1031 exchange, divorce, estate, relocation)? That informs how much negotiation room exists.
- Schools are D-rated, which usually means shorter tenancies and higher turnover. Who's the typical renter profile here, and what's been the actual vacancy rate?
- Crime grade is F in this area — have there been break-ins, vandalism, or insurance claims at this property in the last 3 years? What carrier currently insures it and at what premium?
- What's the average days-on-market for RENTAL listings here right now (not sales)? A rising rental-DOM trend means longer vacancies and softer asking-rent achievability than the comps imply.
- What's the recent tenant-quality profile in this submarket — average credit score on applications, eviction rate, late-payment / NSF rate, and stable-employment percentage? A property-management company in the area should have these aggregated.
- How much new for-sale + rental construction is in the pipeline within 1–3 miles? Heavy new supply typically softens prices + rents 12–24 months out; constrained supply supports both.
Investment metrics
- 1% rule
- 1.41% ✓
- Cap rate
- 10.73%
- Cash-on-cash
- 15.86%
- DSCR
- 1.71
- GRM
- 5.9
CMA / ARV
- ARV (on-the-fly)
- $307,572
- Comps found
- 12
Show comp detail 12 sales within ~0.75 mi
| Address | Dist | Beds/Ba | Sqft | Sold | Price | $/sf | Match |
|---|---|---|---|---|---|---|---|
| 135 Cushman St | 0.34mi | 3/2.0 (-1) | 1,486 (+3%) | 5mo | $282,000 | $190 | 70 |
| 202 Lynn Rd | 0.52mi | 5/2.0 (+1) | 1,422 (-2%) | 3mo | $225,000 | $158 | 66 |
| 118 Lynn Rd | 0.54mi | 5/2.0 (+1) | 1,430 (-1%) | 5mo | $315,000 | $220 | 64 |
| 806 Lindley Dr Dr | 0.21mi | 3/1.5 (-1) | 1,595 (+10%) | 2mo | $295,000 | $185 | 64 |
| 3004 Forrestal Dr | 0.52mi | 3/2.5 (-1) | 1,500 (+4%) | 5mo | $255,000 | $170 | 58 |
| 106 S Adams St | 0.71mi | 3/2.0 (-1) | 1,403 (-3%) | 2mo | $350,000 | $249 | 55 |
| 3004 Cathy Dr | 0.69mi | 4/2.0 | 1,551 (+7%) | 2mo | $330,000 | $213 | 53 |
| 207 S Adams St | 0.63mi | 3/2.0 (-1) | 1,562 (+8%) | 1mo | $330,000 | $211 | 51 |
| 3330 Nantuckett Ave | 0.59mi | 3/2.5 (-1) | 1,566 (+8%) | 6mo | $340,000 | $217 | 46 |
| 2905 Forrestal Dr | 0.59mi | 3/2.5 (-1) | 1,612 (+12%) | 1mo | $299,000 | $185 | 45 |
| 2912 Forrestal Dr | 0.57mi | 3/2.5 (-1) | 1,626 (+13%) | 1mo | $346,500 | $213 | 44 |
| 136 East End Ave | 0.64mi | 3/2.5 (-1) | 1,577 (+9%) | 5mo | $389,900 | $247 | 44 |
Match score weights: distance 35% · size 25% · config 20% · recency 20%. Top-matched comps best support the ARV.
Projected returns pro-forma
-3.0% appreciation · 0.84% rent growth · sell at horizon
- IRR
- -15.3%
- Equity multiple
- 0.47×
- Total profit
- $-20,737
- Equity at exit
- $20,860
- IRR
- -13.0%
- Equity multiple
- 0.34×
- Total profit
- $-25,733
- Equity at exit
- $12,096
Cash invested: $39,172 (down + closing). Projections, not guarantees.
Landlord ↔ Tenant lean methodology
- Overall (STATE)
- 85 Strongly Landlord-Friendly
- State North Carolina
- 85 Strongly Landlord-Friendly · R+3
- County
- — inherits STATE
- City
- — inherits STATE
ZIP-level market 27703
- Rents YoY
- 0.8%
- Active inventory
- 1103
- Price-to-rent
- 5.9×
Monthly cashflow live
- Estimated rent
- $1,976 high interval (Pro) →
- Mortgage (P&I)
- −$734
- Tax from tax record
- −$251 /mo · $3,018/yr
- Insurance
- −$58
- Flood insurance flood zone
- −$427 /mo · $5,118/yr
- HOA
- −$0
- Vacancy / Maint / Mgmt
- −$415
- Net cashflow
- $91
Break-even live
UW: 25.0% down · 7.5% · 30yr · 1.5% tax · 5.0% vac · 8.0% maint · 8.0% mgmt
Financing live
Cash to close
- Down payment
- $34,975
- Closing costs
- $4,197
- Reserves months
- —
- Total cash needed
- —
Loan-product check · same deal, 3 products live
Conventional
25% down · 7.5% · 30yr
- Down + closing
- —
- Monthly P&I
- —
- Monthly cashflow
- —
- DSCR
- —
- Eligible?
- —
Personal DTI + credit; lowest rate.
DSCR
20% down · 8.5% · 30yr
- Down + closing
- —
- Monthly P&I
- —
- Monthly cashflow
- —
- DSCR
- —
- Eligible?
- —
No personal income docs; deal must DSCR.
Hard money
10% down · 12.0% · 12mo
- Down + closing
- —
- Monthly P&I
- —
- Monthly cashflow
- —
- DSCR
- —
- Eligible?
- —
Short-term bridge; refi at stabilization.
Rent comps 13 comps
| Address | Beds | Baths | Sqft | Rent | $/sqft | DOM | Units | Dist |
|---|---|---|---|---|---|---|---|---|
| 419 Walton St Durham, NC | 3.0 | 1.5 | 1212 | $1,595 | $1.32 | 13d | 1 | 0.29mi |
| 122 Cushman St Durham, NC | 3.0 | 1.0 | 1000 | $1,650 | $1.65 | 23d | 1 | 0.43mi |
| 3004 Forrestal Dr Durham, NC | 3.0 | 3.0 | 1500 | $1,875 | $1.25 | 23d | 1 | 0.49mi |
| 3004 Ivey Wood Ln Durham, NC | 2.0–3.0 | 1.0–2.0 | 988 | $1,769 | $1.79 | 13d | 12 | 0.54mi |
| 3262 Ivey Wood Ln Unit 1 Durham, NC | 3.0 | 2.5 | 1380 | $1,675 | $1.21 | 13d | 1 | 0.62mi |
| 1218 Kendall Dr Durham, NC | 3.0 | 2.5 | 1408 | $1,820 | $1.29 | 23d | 1 | 0.68mi |
| 818 Riverbark Ln Durham, NC | 3.0 | 2.0 | 1252 | $1,875 | $1.50 | 23d | 1 | 0.73mi |
| 70 Lynn Rd Durham, NC | 1.0–3.0 | 1.0–2.0 | 1019 | $1,668 | $1.64 | 23d | 1 | 0.79mi |
| 650 Ganyard Farm Way #37 Durham, NC | 3.0 | 3.5 | 1550 | $1,870 | $1.21 | 23d | 1 | 0.89mi |
| 401 Sparella St Durham, NC | 3.0 | 2.0 | 1046 | $1,620 | $1.55 | 13d | 1 | 0.91mi |
| 207 Breedlove Ave Durham, NC | 3.0 | 3.0 | 1519 | $2,050 | $1.35 | 13d | 1 | 1.02mi |
| 2810 Ashe St Durham, NC | 3.0 | 2.0 | 1300 | $2,370 | $1.82 | 23d | 1 | 1.04mi |
| 2408 Hart St Durham, NC | 3.0 | 1.0 | 960 | $1,445 | $1.51 | 23d | 1 | 1.46mi |
Listing history 6 events
-
2026-05-30status $139,900 Pending 46 DOM
-
2026-05-19price $169,900
-
2026-05-03price $189,900
-
2026-04-18price $209,900
-
2026-04-13$239,900 Active
-
1997-04-09soldstatus $90,000
ⓘ Source: listings_history table (triggers on properties + properties_extension) + one-shot
backfill from property_details.listing_events for pre-trigger history.
Tax reassessment forecast NC · Resets to sale price
- Current annual tax
- $3,018 · $251/mo
- Projected year-2 tax
- $3,018 · $251/mo
- Expected delta
- $0/yr ($0/mo · 0.0%)
ⓘ Screening estimate from a state-policy table — verify with the county assessor before closing.
Climate risk First Street
- Flood 6/10 Major FEMA zone AE · 75% chance over 30 yrs
- Wildfire 2/10 Low
- Heat 6/10 Major 7 d/yr ≥105°F today · 17 d/yr by 30 yrs out
- Wind 6/10 Major 27% chance of damaging wind over 30 yrs
- Air quality 2/10 Low 1 unhealthy d/yr today · 1 by 30 yrs out
Nearby sold comps map
Loading sold comps map…
Walkable amenities ~0.75 mi
Loading nearby amenities…
Taxation est. · year 1
- Rental income
- $23,711
- − Mortgage interest
- −$7,837
- − Property taxes
- −$3,018
- − Insurance
- −$5,818
- − Repairs & maintenance
- −$1,897
- − Management
- −$1,897
- − Depreciation
- −$4,070
- Taxable loss
- −$825
- Est. tax savings @ 24.0%
- +$198
- After-tax cash flow
- $1,290/yr
For passive investors: Depreciation is non-cash, so a rental often shows a tax loss while cash-flowing — sheltering income. Rental losses are passive: they offset passive income freely, and up to $25,000/yr can offset ordinary (W-2) income if you actively participate and your MAGI is under $100k (phasing out to $0 by $150k); unused losses carry forward. On sale, claimed depreciation is recaptured at up to 25%, and gains may owe capital-gains tax (a 1031 exchange can defer both). Figures are a year-1 estimate at your 24.0% rate — not tax advice; consult a CPA.
Schools (NCES district)
- District
- Durham Public Schools
- NCES district ID
- 3701260
- Math proficiency
- 29% ▼ -3.00%
- Reading proficiency
- 39% ▲ 2.00%
- Median HH income
- $52,143
- Composite
- 29.69/100
- National rank
- #6457
- State rank
- #132 of 178 in NC
Livability — Durham
- Score
- 81/100
- State rank
- #15
- US rank
- #1411
Category grades
Schools grade is shown separately in the Schools card above.
Census & demographics
- Census place
- Durham, NC
- County
- Durham County · 288,747 people
- City population
- 288,747
- Metro
- Durham-Chapel Hill, NC
- Population (ZIP)
- 63,458
- Household income
- $89,317
- Rent vs Own
- Severe rent burden
- 1685.0
Population outlook (Durham County) Hauer SSP2
- Today (2025)
- 368,962 people
- By 2030
- 402,686 · +9.1%
- By 2040
- 468,677 · +27.0%
- By 2050
- 531,727 · +44.1%
- By 2075
- 660,446 · +79.0%
- By 2100
- 739,971 · +100.6%
Race, ethnicity, and origin ACS 2023
- Neighborhood character
- Diverse neighborhood (Simpson 0.70)
- Race & ethnicity
- Black 40% White 32% Hispanic / Latino 20% Two or more races 9% Asian 5%
- Hispanic origin (detail)
- Mexican 11% Puerto Rican 1%
- Common ancestry
- Swiss 2% Romanian 2% Italian 1%
- Foreign-born
- 15% · Canada, Vietnam, China
- Languages at home
- 77% English-only · Spanish 17% Other Asian/Pacific 1% Other Indo-European 1%
Political lean MEDSL · Durham
- 2024 margin
- Solid D (+61.9) · D 80.2% · R 18.2% · Other 1.6%
- 2008→2024 swing
- +10.0pp toward D · 2008: 51.9pp · 2024: 61.9pp
- All cycles
- 2024: D+61.9 2020: D+62.4 2016: D+60.4 2012: D+52.7 2008: D+51.9
Not yet ingested
- Civics
- —
Market trends
- HPI YoY
- ▼ -129.81%
- Current HPI
- 206.7413
- Rent YoY
- ▲ 0.84%
- Metro
- Durham-Chapel Hill, NC
- State GDP YoY
- ▲ 3.28%
- F500 in state
- 26
Industry mix (Fortune 500 HQ in NC)
| Industry | F500 HQs | Revenue |
|---|---|---|
| Financial Services | 2 | $213B |
|
||
| Retail | 2 | $95B |
|
||
| Industrial Conglomerate | 1 | $38B |
|
||
| Metals / Steel | 1 | $35B |
|
||
| Utilities | 1 | $30B |
|
||
| Industrial Machinery | 1 | $19B |
|
||
Price history
+88.8% since first listed5 events — show timeline
- 2026-05-19 Price Changed $169,900 TMLS
- 2026-05-03 Price Changed $189,900 TMLS
- 2026-04-18 Price Changed $209,900 TMLS
- 2026-04-13 Listed $239,900 TMLS
- 1997-04-09 Sold (Public Records) $90,000 Public Records
Property tax history
+3.9%/yrLatest (2025): $3,018 · +54.7% YoY. Source: county tax records.
Cash-flow waterfall
monthlySold comps — $/sqft
last 12 mo · ≤1 miLoading sold comps…