 🌊 Lakefront
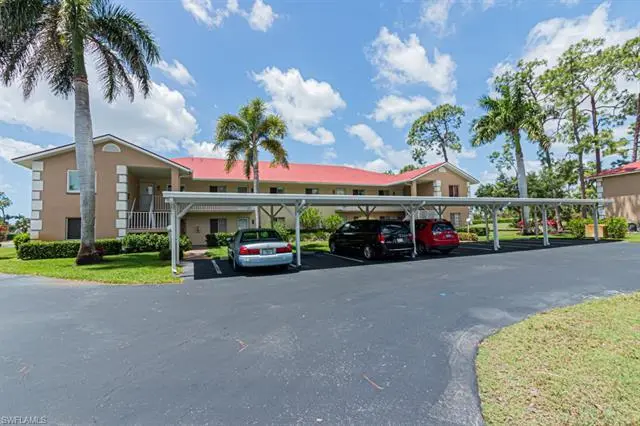
520 Augusta Blvd Unit B202 · Lely, FL
Flood risk 8/10 · Major
- FEMA flood zone
- X (shaded)
- Chance of flooding over 30 yrs
- 0.97%
- Est. flood insurance / yr
- $507 – $1,088
Fire risk 2/10 · Minimal
- Est. fire insurance / yr
- $947 – $1,759
Heat risk 10/10 · Severe
- Hot days now (above 108°F)
- 7 days/yr
- Hot days in 30 yrs
- 30 days/yr
Wind risk 10/10 · Severe
- Chance of severe wind over 30 yrs
- 99.0%
Air-quality risk 2/10 · Minimal
- Unhealthy air days now
- 2 days/yr
- Unhealthy air days in 30 yrs
- 2 days/yr
Risk factors via First Street. Map © Google.
Why this score? — see what drove the B- grade
The composite is a weighted blend of 9 inputs, each scored 0–100. Each bar is that input's sub-score; the figure is the points it added to the 100-point composite (weight × sub-score).
- Cash flow +27.1/30.0
- DSCR +9.4/10.0
- 1% rule +8.7/10.0
- ARV discount +7.5/15.0
- Schools +5.0/10.0
- Rent growth +3.9/5.0
- Livability +3.3/5.0
- Condition / age +2.5/5.0
- Appreciation +0.0/10.0
$249,900
🖨 Deal sheet (PDF) 📄 Offer letter ✓ Due diligence
Listing remarks
THIS IS AN ESTATE SALE. GREAT LOCATION WITH IN A WONDERFUL COMMUNITY. CLOSE TO ALL POINTS OF NAPLES. UNIT NEED UPDATING. PRICE TO SELL.
Key facts
- $489 HOA
- Garage
- Community pool
Neighborhood map
What this means for you Summary
Snapshot
- This is a 2-bed/2.0-bath condo listed at $250k.
Deal economics
- At list price, monthly cash flow is $642 ($8k/yr) — positive.
- The deal already cash-flows at list — no discount required.
- Meets the 1% rule at list price ($3k rent vs $250k).
Location & tenants
- Location reads 66/100 on livability (#586 in FL) — a middle-class / working-renter tenant base. Strengths: crime A+, housing A+; Watch: schools D+, health & safety D, amenities F.
- Collier (suburban): math 60% / reading 56% proficiency, ranked #16 of 73 in FL (top 22%) — acceptable for families but not a draw, mixed tenant base, ~2y average lease.
- Market conditions: Rents rising fast (+5.6%/yr); 598 active listings in the ZIP; 40 comparable units currently listed for rent nearby; rentals at typical pace (median 25d on market — plan ~3-4 weeks tenant-placement turnaround); solid renter incomes; 3,520 units permitted in Collier County in 2024 (959 in 5+ unit buildings).
- At $3,423/mo this rent would consume 50% of the median local household income ($82k/yr) (locally 954% of renters already pay >50% of income on rent) — very limited rent-growth headroom before tenants either downsize or default.
Forward outlook
- Local home prices are declining (-3.0%/yr); year-one equity from $2k of loan paydown is wiped out by about $7k of value loss. Plan a longer hold.
- Collier County population projected at +30% by 2050 — long-run rental-demand tailwind backs the buy-and-hold thesis.
- At projected returns (-3.0% appreciation + 5.6% rent growth), your $70k cash investment doubles in ~8 years — after that, you're playing with house money.
Negotiation context
- Only 12 days on market — expect competitive offers; lowballing is unlikely to land.
- Current owner paid $77k; list at $250k implies a 225% gain — meaningful room to come down on a strong offer.
Risks & watch-outs
- Watch-outs: flood insurance adds $66/mo.
- Climate carrying-cost: severe flood risk; severe wind risk, 99% chance of damaging wind over 30y; extreme-heat days projected 7→30/yr by 2055 (HVAC capex compounding) — expect insurance premiums to compound above CPI over the hold.
Questions for the listing agent
- What's the actual annual flood-insurance premium (NFIP or private), and is the property in a SFHA with mandatory coverage?
- What does the HOA fee cover, when was the last increase, and are there any pending special assessments or reserve-fund shortfalls?
- Any open or pending special assessments — roof, HVAC, plumbing, elevator, façade? What's the per-unit balance and payoff schedule, and is the seller paying it off at close or rolling it to the buyer?
- Is there a deadline driving the sale (1031 exchange, divorce, estate, relocation)? That informs how much negotiation room exists.
- Schools are D-rated, which usually means shorter tenancies and higher turnover. Who's the typical renter profile here, and what's been the actual vacancy rate?
- This sits on a lake — are riparian / water-frontage rights deeded with the parcel? Any dock permits, shoreline easements, or HOA water-use restrictions?
- What's the documented flood / surge / shoreline-erosion history here (FEMA AND non-FEMA — e.g., storm surge, creek backup, septic-field saturation)?
- Any water-quality or seasonal algae-bloom issues that affect tenant satisfaction or short-term-rental demand?
- What's the average days-on-market for RENTAL listings here right now (not sales)? A rising rental-DOM trend means longer vacancies and softer asking-rent achievability than the comps imply.
- What's the recent tenant-quality profile in this submarket — average credit score on applications, eviction rate, late-payment / NSF rate, and stable-employment percentage? A property-management company in the area should have these aggregated.
- How much new apartment / multifamily construction is in the pipeline within 1–3 miles? Heavy new supply (>2% of stock underway) typically softens rents 12–24 months out; light construction supports rent growth.
Investment metrics
- 1% rule
- 1.37% ✓
- Cap rate
- 9.70%
- Cash-on-cash
- 12.15%
- DSCR
- 1.54
- GRM
- 6.1
CMA / ARV
No comps found within radius.
Projected returns pro-forma
-3.0% appreciation · 5.59% rent growth · sell at horizon
- IRR
- 3.5%
- Equity multiple
- 1.14×
- Total profit
- $9,806
- Equity at exit
- $37,261
- IRR
- 15.7%
- Equity multiple
- 2.46×
- Total profit
- $101,840
- Equity at exit
- $21,607
Cash invested: $69,972 (down + closing). Projections, not guarantees.
Landlord ↔ Tenant lean methodology
- Overall (STATE)
- 87 Strongly Landlord-Friendly
- State Florida
- 87 Strongly Landlord-Friendly · R+3
- County
- — inherits STATE
- City
- — inherits STATE
ZIP-level market 34113
- Rents YoY
- 5.6%
- Active inventory
- 598
- Price-to-rent
- 6.1×
Monthly cashflow live
- Estimated rent
- $3,423 high interval (Pro) →
- Mortgage (P&I)
- −$1,311
- Tax from tax record
- −$92 /mo · $1,106/yr
- Insurance
- −$104
- Flood insurance flood zone
- −$66 /mo · $798/yr
- HOA
- −$489
- Vacancy / Maint / Mgmt
- −$719
- Net cashflow
- $642
Break-even live
Sensitivity live
| Price | -10% $783 | -5% $713 | +0% $642 | +5% $571 | +10% $501 |
|---|---|---|---|---|---|
| Rent | -10% $372 | -5% $507 | +0% $642 | +5% $777 | +10% $912 |
| Rate | -1.0pp $768 | -0.5pp $706 | base $642 | +0.5pp $577 | +1.0pp $511 |
UW: 25.0% down · 7.5% · 30yr · 1.5% tax · 5.0% vac · 8.0% maint · 8.0% mgmt
Financing live
Cash to close
- Down payment
- $62,475
- Closing costs
- $7,497
- Reserves months
- —
- Total cash needed
- —
Loan-product check · same deal, 3 products live
Conventional
25% down · 7.5% · 30yr
- Down + closing
- —
- Monthly P&I
- —
- Monthly cashflow
- —
- DSCR
- —
- Eligible?
- —
Personal DTI + credit; lowest rate.
DSCR
20% down · 8.5% · 30yr
- Down + closing
- —
- Monthly P&I
- —
- Monthly cashflow
- —
- DSCR
- —
- Eligible?
- —
No personal income docs; deal must DSCR.
Hard money
10% down · 12.0% · 12mo
- Down + closing
- —
- Monthly P&I
- —
- Monthly cashflow
- —
- DSCR
- —
- Eligible?
- —
Short-term bridge; refi at stabilization.
Rent comps 40 comps
| Address | Beds | Baths | Sqft | Rent | $/sqft | DOM | Units | Dist |
|---|---|---|---|---|---|---|---|---|
| 520 Augusta Blvd Unit B204 Naples, FL | 3.0 | 2.0 | 1294 | $2,200 | $1.70 | 24d | 1 | 0.04mi |
| 413 Augusta Blvd #302 Naples, FL | 2.0 | 2.0 | 1390 | $5,500 | $3.96 | 22d | 1 | 0.07mi |
| 555 Augusta Blvd Unit 3-1 Naples, FL | 2.0 | 2.0 | 1249 | $4,200 | $3.36 | 24d | 1 | 0.15mi |
| 265 Deerwood Cir Naples, FL | 2.0 | 2.0 | 1179 | $5,000 | $4.24 | 24d | 1 | 0.17mi |
| 575 Augusta Blvd Naples, FL | 3.0 | 2.0 | 1500 | $2,100 | $1.40 | 24d | 1 | 0.20mi |
| 605 Augusta Blvd #4 Naples, FL | 2.0 | 2.0 | 1125 | $3,950 | $3.51 | 15d | 1 | 0.26mi |
| 605 Augusta Blvd #14 Naples, FL | 2.0 | 2.0 | 1125 | $4,000 | $3.56 | 24d | 1 | 0.26mi |
| 701 Augusta Blvd Unit 701-8 Naples, FL | 2.0 | 2.0 | 1250 | $4,800 | $3.84 | 15d | 1 | 0.29mi |
| 705 Augusta Blvd Unit 705-5 Naples, FL | 2.0 | 2.0 | 1125 | $2,000 | $1.78 | 15d | 1 | 0.31mi |
| 709 Augusta Blvd Unit 709-5 Naples, FL | 3.0 | 2.0 | 1480 | $4,000 | $2.70 | 15d | 1 | 0.32mi |
| 760 Augusta Blvd Unit D204 Naples, FL | 3.0 | 2.0 | 1294 | $2,300 | $1.78 | 24d | 1 | 0.38mi |
| 905 Augusta Blvd Naples, FL | 2.0 | 2.0 | 1125 | $1,850 | $1.64 | 24d | 1 | 0.40mi |
| 452 Bristle Cone Ln #27 Naples, FL | 2.0 | 2.0 | 1129 | $2,000 | $1.77 | 24d | 1 | 0.42mi |
| 5651 Rattlesnake Hammock Rd Unit C-108 Naples, FL | 2.0 | 2.0 | 1054 | $1,800 | $1.71 | 24d | 1 | 0.42mi |
| 5635 Rattlesnake Hammock Rd Apt 203D Naples, FL | 2.0 | 2.0 | 1054 | $1,700 | $1.61 | 22d | 1 | 0.45mi |
| 315 Saint Andrews Blvd Unit A25 Naples, FL | 2.0 | 2.0 | 1126 | $1,530 | $1.36 | 24d | 1 | 0.45mi |
| 940 Augusta Blvd Unit D939 Naples, FL | 2.0 | 2.0 | 1419 | $2,200 | $1.55 | 24d | 1 | 0.48mi |
| 5535 Rattlesnake Hammock Rd #302 Naples, FL | 2.0 | 2.0 | 1205 | $2,800 | $2.32 | 24d | 1 | 0.50mi |
| 5857 Rattlesnake Hammock Rd #208 Naples, FL | 2.0 | 2.0 | 1133 | $3,000 | $2.65 | 15d | 1 | 0.55mi |
| 5502 Greenwood Cir #1 Naples, FL | 3.0 | 2.0 | 1450 | $2,400 | $1.66 | 24d | 1 | 0.56mi |
| 326 Bradstrom Cir Unit 103F Naples, FL | 2.0 | 2.0 | 1113 | $1,800 | $1.62 | 24d | 1 | 0.56mi |
| 326 Bradstrom Cir Unit 204F Naples, FL | 3.0 | 2.0 | 1200 | $3,500 | $2.92 | 24d | 1 | 0.56mi |
| 5841 Rattlesnake Hammock Rd Unit 2 Naples, FL | 2.0 | 2.0 | 1133 | $2,500 | $2.21 | 24d | 1 | 0.57mi |
| 5841 Rattlesnake Hammock Rd Unit I-203 Naples, FL | 2.0 | 2.0 | 1015 | $3,500 | $3.45 | 15d | 1 | 0.57mi |
| 332 Bradstrom Cir #201 Naples, FL | 2.0 | 2.0 | 1257 | $2,200 | $1.75 | 24d | 1 | 0.61mi |
| 5499 Rattlesnake Hammock Rd Naples, FL | 2.0 | 2.0 | 1071 | $1,775 | $1.66 | 15d | 2 | 0.65mi |
| 240 Pebble Beach Blvd #702 Naples, FL | 2.0 | 2.0 | 1090 | $4,000 | $3.67 | 24d | 1 | 0.65mi |
| 5293 Dixie Dr Unit 1546039P Naples, FL | 2.0 | 2.0 | 1130 | $1,561 | $1.38 | 15d | 1 | 0.66mi |
| 5595 Greenwood Cir #92 Naples, FL | 3.0 | 2.0 | 1450 | $5,000 | $3.45 | 24d | 1 | 0.68mi |
| 5778 Greenwood Cir Naples, FL | 3.0 | 2.0 | 1450 | $4,000 | $2.76 | 24d | 1 | 0.70mi |
| 5419 Rattlesnake Hammock Rd Unit 307F Naples, FL | 2.0 | 2.0 | 1071 | $1,950 | $1.82 | 15d | 1 | 0.72mi |
| 4556 Andover Way Unit E104 Naples, FL | 2.0 | 2.0 | 1072 | $5,000 | $4.66 | 15d | 1 | 0.73mi |
| 4556 Andover Way Unit E106 Naples, FL | 2.0 | 2.0 | 1172 | $1,900 | $1.62 | 15d | 1 | 0.73mi |
| 190 Pebble Beach Blvd #301 Naples, FL | 2.0 | 2.0 | 954 | $1,700 | $1.78 | 24d | 1 | 0.73mi |
| 248 Pebble Beach Cir Unit G201 Naples, FL | 2.0 | 2.0 | 1163 | $2,300 | $1.98 | 24d | 1 | 0.74mi |
| 232 Pebble Beach Blvd #104 Naples, FL | 3.0 | 2.0 | 1298 | $1,975 | $1.52 | 24d | 1 | 0.74mi |
| 332 Charlemagne Blvd Unit H103 Naples, FL | 2.0 | 2.0 | 1082 | $3,495 | $3.23 | 24d | 1 | 0.79mi |
| 332 Charlemagne Blvd Unit H101 Naples, FL | 2.0 | 2.0 | 1082 | $3,500 | $3.23 | 24d | 1 | 0.79mi |
| 4410 Chantelle Dr Unit H-205 Naples, FL | 2.0 | 2.0 | 1349 | $3,500 | $2.59 | 15d | 1 | 0.86mi |
| 360 Charlemagne Blvd Unit D105 Naples, FL | 2.0 | 2.0 | 1082 | $3,200 | $2.96 | 24d | 1 | 0.87mi |
HOA detail condo
- Monthly dues
- $489 · $5,868/yr
- Assessments
- None detected in remarks — confirm with the listing agent.
Listing history 5 events
-
2026-04-21status Pending
-
2026-04-09$249,900 Active
-
2000-06-06soldstatus $77,000
-
1988-08-01soldstatus $73,000
-
1988-06-01soldstatus $62,000
ⓘ Source: listings_history table (triggers on properties + properties_extension) + one-shot
backfill from property_details.listing_events for pre-trigger history.
Tax reassessment forecast FL · Resets to sale price
- Current annual tax
- $1,106 · $92/mo
- Projected year-2 tax
- $2,074 · $173/mo
- Expected delta
- +$968/yr (+$81/mo · 87.6%)
ⓘ Screening estimate from a state-policy table — verify with the county assessor before closing.
Climate risk First Street
- Flood 8/10 Severe FEMA zone X (shaded) · 97% chance over 30 yrs
- Wildfire 2/10 Low
- Heat 10/10 Extreme 7 d/yr ≥108°F today · 30 d/yr by 30 yrs out
- Wind 10/10 Extreme 99% chance of damaging wind over 30 yrs
- Air quality 2/10 Low 2 unhealthy d/yr today · 2 by 30 yrs out
Nearby sold comps map
Loading sold comps map…
Walkable amenities ~0.75 mi
Loading nearby amenities…
Taxation est. · year 1
- Rental income
- $41,077
- − Mortgage interest
- −$13,998
- − Property taxes
- −$1,106
- − Insurance
- −$2,047
- − Repairs & maintenance
- −$3,286
- − Management
- −$3,286
- − HOA
- −$5,868
- − Depreciation
- −$7,270
- Taxable income
- $4,216
- Est. tax owed @ 24.0%
- −$1,012
- After-tax cash flow
- $6,692/yr
For passive investors: Depreciation is non-cash, so a rental often shows a tax loss while cash-flowing — sheltering income. Rental losses are passive: they offset passive income freely, and up to $25,000/yr can offset ordinary (W-2) income if you actively participate and your MAGI is under $100k (phasing out to $0 by $150k); unused losses carry forward. On sale, claimed depreciation is recaptured at up to 25%, and gains may owe capital-gains tax (a 1031 exchange can defer both). Figures are a year-1 estimate at your 24.0% rate — not tax advice; consult a CPA.
Schools (NCES district)
- District
- Collier
- NCES district ID
- 1200330
- Math proficiency
- 60% ▼ -4.00%
- Reading proficiency
- 56% ▼ -2.00%
- Median HH income
- $58,275
- Composite
- 50.23/100
- National rank
- #1892
- State rank
- #16 of 73 in FL
Livability — Lely
- Score
- 66/100
- State rank
- #586
- US rank
- #11224
Category grades
Schools grade is shown separately in the Schools card above.
Census & demographics
- Census place
- Lely, FL
- County
- Collier County · 396,295 people
- Metro
- Naples-Marco Island, FL
- Population (ZIP)
- 26,056
- Household income
- $81,674
- Rent vs Own
- Severe rent burden
- 954.0
Population outlook (Collier County) Hauer SSP2
- Today (2025)
- 420,858 people
- By 2030
- 450,054 · +6.9%
- By 2040
- 502,232 · +19.3%
- By 2050
- 544,932 · +29.5%
- By 2075
- 627,203 · +49.0%
- By 2100
- 659,015 · +56.6%
Race, ethnicity, and origin ACS 2023
- Neighborhood character
- Diverse neighborhood (Simpson 0.59)
- Race & ethnicity
- White 56% Hispanic / Latino 28% Black 12% Two or more races 11% Asian 2%
- Hispanic origin (detail)
- Mexican 17% Puerto Rican 3% Cuban 2%
- Common ancestry
- Hispanic 10% Romanian 3% Lithuanian 2%
- Foreign-born
- 26% · Canada, Jamaica, Vietnam
- Languages at home
- 63% English-only · Spanish 24% French/Haitian/Cajun 9% Other Indo-European 2%
Political lean MEDSL · Collier
- 2024 margin
- Solid R (+33.1) · D 33.1% · R 66.2%
- 2008→2024 swing
- -10.6pp toward R · 2008: -22.5pp · 2024: -33.1pp
- All cycles
- 2024: R+33.1 2020: R+24.7 2016: R+26.0 2012: R+30.1 2008: R+22.5
Not yet ingested
- Civics
- —
Market trends
- HPI YoY
- ▼ -194.86%
- Current HPI
- 279.4232
- Rent YoY
- ▲ 5.59%
- Metro
- Naples-Marco Island, FL
- State GDP YoY
- ▲ 3.28%
- F500 in state
- 36
Industry mix (Fortune 500 HQ in FL)
| Industry | F500 HQs | Revenue |
|---|---|---|
| Industrial Technology | 2 | $29B |
|
||
| Insurance | 2 | $17B |
|
||
| Retail | 1 | $60B |
|
||
| Technology Distribution | 1 | $58B |
|
||
| Homebuilding | 1 | $35B |
|
||
| Technology Manufacturing | 1 | $35B |
|
||
Price history
+303.1% since first listed5 events — show timeline
- 2026-04-21 Pending — NAPLESMLS
- 2026-04-09 Listed $249,900 NAPLESMLS
- 2000-06-06 Sold (Public Records) $77,000 Public Records
- 1988-08-01 Sold (Public Records) $73,000 Public Records
- 1988-06-01 Sold (Public Records) $62,000 Public Records
Property tax history
+0.1%/yrLatest (2025): $1,106 · +7.4% YoY. Source: county tax records.
Cash-flow waterfall
monthlySold comps — $/sqft
last 12 mo · ≤1 miLoading sold comps…