 🏗️ New Construction
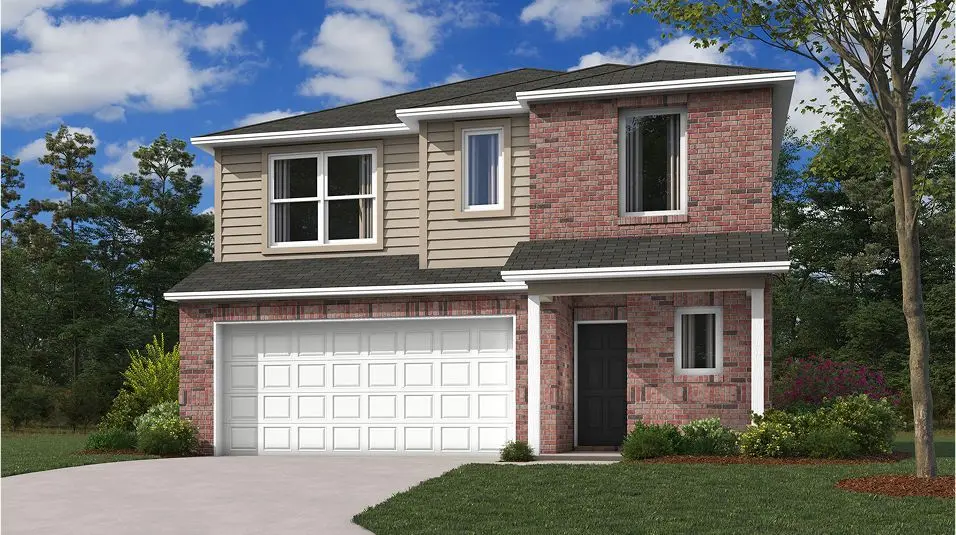
RC Manchester Plan · Todd Mission, TX
Flood risk No data
- FEMA flood zone
- —
- Chance of flooding over 30 yrs
- —
- Est. flood insurance / yr
- —
Fire risk No data
- Est. fire insurance / yr
- —
Heat risk No data
- Hot days now (above threshold)
- —
- Hot days in 30 yrs
- —
Wind risk No data
- Chance of severe wind over 30 yrs
- —
Air-quality risk No data
- Unhealthy air days now
- —
- Unhealthy air days in 30 yrs
- —
Risk factors via First Street. Map © Google.
Why this score? — see what drove the D grade
The composite is a weighted blend of 9 inputs, each scored 0–100. Each bar is that input's sub-score; the figure is the points it added to the 100-point composite (weight × sub-score).
- Cash flow +13.7/30.0
- ARV discount +7.5/15.0
- Condition / age +4.8/5.0
- DSCR +4.1/10.0
- Schools +3.9/10.0
- 1% rule +3.8/10.0
- Livability +3.4/5.0
- Rent growth +2.6/5.0
- Appreciation +0.0/10.0
$269,990
🖨 Deal sheet (PDF) 📄 Offer letter ✓ Due diligence
Listing remarks MLS
This new two-story home is designed for gracious living. Down the hallway is a modern kitchen with a center island, which enjoys direct access to the cozy dining area, welcoming family room and rear patio. On the same level is the owner's suite with an attached bathroom and walk-in closet. Occupying the top floor are three remaining bedrooms, a multipurpose loft and a flex room to provide additional living space.
Key facts
- Cozy dining area
- Family room
- Modern kitchen
Tags
Neighborhood map
What this means for you Summary
Snapshot
- This is a 4-bed/2.5-bath single-family listed at $270k. Condition is rated excellent.
Deal economics
- At list price, monthly cash flow is $19 ($234/yr) — positive.
- To cash-flow at today's rent, offer at most $268k (0.6% below list).
- To meet the 1% rule (rent ≥ 1% of price), the offer needs to be $235k (13.0% below list).
- Recommended offer: $235k (13.0% below list) — sets the bar for 1% rule.
- Cap rate 6.4% vs local median 2.9% in Todd Mission — top-decile yield for the area; either an underpriced asset or a hidden risk that comps aren't pricing in. Stress-test before assuming the spread holds.
Location & tenants
- Location reads 67/100 on livability (#549 in TX) — a middle-class / working-renter tenant base. Strengths: employment A+, cost of living A+, housing A+; Watch: schools F, amenities F, commute F.
- Magnolia ISD (rural): math 42% / reading 45% proficiency, ranked #247 of 826 in TX (top 30%) — families likely to look elsewhere, expect single-tenant / working-renter base with shorter leases.
- Market conditions: Rents flat; 2300 active listings in the ZIP; high-income renter base; 13,259 units permitted in Montgomery County in 2024 (1,402 in 5+ unit buildings).
Forward outlook
- Local home prices are declining (-3.0%/yr); year-one equity from $2k of loan paydown is wiped out by about $8k of value loss. Plan a longer hold.
- Montgomery County population projected at +65% by 2050 — long-run rental-demand tailwind backs the buy-and-hold thesis.
Negotiation context
- It's been on market 381 days — a 12% lower offer ($238k) is reasonable based on typical stale-listing flexibility.
Questions for the listing agent
- It's been on market 381 days. Have you received any prior offers? Is the seller open to a 13% concession, seller financing, or rate buy-down credit?
- Why hasn't it sold? Are there any deal-killer items the seller is aware of (foundation, flood, title, zoning, code violations)?
- Is there a deadline driving the sale (1031 exchange, divorce, estate, relocation)? That informs how much negotiation room exists.
- Schools are F-rated, which usually means shorter tenancies and higher turnover. Who's the typical renter profile here, and what's been the actual vacancy rate?
- The area grade is low — what's the realistic commute time and amenity access for the typical tenant pool here? Any planned neighborhood developments (good or bad) we should know about?
- What's the average days-on-market for RENTAL listings here right now (not sales)? A rising rental-DOM trend means longer vacancies and softer asking-rent achievability than the comps imply.
- What's the recent tenant-quality profile in this submarket — average credit score on applications, eviction rate, late-payment / NSF rate, and stable-employment percentage? A property-management company in the area should have these aggregated.
- How much new for-sale + rental construction is in the pipeline within 1–3 miles? Heavy new supply typically softens prices + rents 12–24 months out; constrained supply supports both.
Investment metrics
- 1% rule
- 0.88% ✗
- Cap rate
- 6.38%
- Cash-on-cash
- 0.31%
- DSCR
- 1.01
- GRM
- 9.4
CMA / ARV
- ARV (median comp)
- $265,553
- List price
- $269,990
- Delta
- 1.67%
- Verdict
- FAIR
- Comps
- 20 within 1.0 mi
Show comp detail 12 sales within ~0.75 mi
| Address | Dist | Beds/Ba | Sqft | Sold | Price | $/sf | Match |
|---|---|---|---|---|---|---|---|
| 25433 Carnation Ct | 0.07mi | 4/2.5 | 2,197 (-6%) | 4mo | $274,990 | $125 | 83 |
| 25308 Leather Leaf Ct | 0.09mi | 4/2.5 | 2,197 (-6%) | 3mo | $274,990 | $125 | 83 |
| 25291 Leather Leaf Ct | 0.14mi | 4/2.5 | 2,197 (-6%) | 3mo | $274,990 | $125 | 81 |
| 25227 Leather Leaf Ct | 0.21mi | 4/2.5 | 2,203 (-6%) | 1mo | $272,000 | $123 | 79 |
| 25522 Blossom Ct | 0.09mi | 4/3.0 | 2,084 (-11%) | 2mo | $295,848 | $142 | 74 |
| 25243 Leather Leaf Ct | 0.19mi | 4/2.5 | 2,101 (-10%) | 1mo | $265,000 | $126 | 73 |
| 25460 Blossom Ct | 0.22mi | 4/3.0 | 2,120 (-10%) | 0mo | $259,900 | $123 | 72 |
| 25323 Yellowbells Pl | 0.23mi | 4/3.0 | 2,125 (-9%) | 1mo | $312,923 | $147 | 71 |
| 25319 Yellowbells Pl | 0.24mi | 4/2.5 | 2,049 (-13%) | 2mo | $279,135 | $136 | 67 |
| 25415 Blossom Ct | 0.32mi | 4/3.0 | 2,120 (-10%) | 3mo | $269,900 | $127 | 65 |
| 25140 Gold Dust Dr | 0.33mi | 4/2.5 | 2,109 (-10%) | 4mo | $270,990 | $128 | 65 |
| 25435 Blossom Ct | 0.27mi | 4/2.5 | 2,641 (+13%) | 4mo | $289,900 | $110 | 63 |
Match score weights: distance 35% · size 25% · config 20% · recency 20%. Top-matched comps best support the ARV.
Projected returns pro-forma
-3.0% appreciation · 0.4% rent growth · sell at horizon
- IRR
- -18.8%
- Equity multiple
- 0.36×
- Total profit
- $-47,741
- Equity at exit
- $39,595
- IRR
- -17.6%
- Equity multiple
- 0.15×
- Total profit
- $-63,149
- Equity at exit
- $22,960
Cash invested: $74,355 (down + closing). Projections, not guarantees.
Landlord ↔ Tenant lean methodology
- Overall (STATE)
- 87 Strongly Landlord-Friendly
- State Texas
- 87 Strongly Landlord-Friendly · R+5
- County
- — inherits STATE
- City
- — inherits STATE
ZIP-level market 77316
- Home prices YoY
- -10.7%
- Rents YoY
- 0.4%
- Active inventory
- 2300
- Price-to-rent
- 9.6×
Monthly cashflow live
- Estimated rent
- $2,348 medium interval (Pro) →
- Mortgage (P&I)
- −$1,393
- Tax est. 1.5%
- −$332 /mo · $3,983/yr
- Insurance
- −$111
- HOA
- −$0
- Vacancy / Maint / Mgmt
- −$493
- Net cashflow
- $19
Break-even live
Sensitivity live
| Price | -10% $203 | -5% $111 | +0% $19 | +5% $-72 | +10% $-164 |
|---|---|---|---|---|---|
| Rent | -10% $-166 | -5% $-73 | +0% $19 | +5% $112 | +10% $205 |
| Rate | -1.0pp $153 | -0.5pp $87 | base $19 | +0.5pp $-49 | +1.0pp $-119 |
UW: 25.0% down · 7.5% · 30yr · 1.5% tax · 5.0% vac · 8.0% maint · 8.0% mgmt
Financing live
Cash to close
- Down payment
- $66,388
- Closing costs
- $7,967
- Reserves months
- —
- Total cash needed
- —
Loan-product check · same deal, 3 products live
Conventional
25% down · 7.5% · 30yr
- Down + closing
- —
- Monthly P&I
- —
- Monthly cashflow
- —
- DSCR
- —
- Eligible?
- —
Personal DTI + credit; lowest rate.
DSCR
20% down · 8.5% · 30yr
- Down + closing
- —
- Monthly P&I
- —
- Monthly cashflow
- —
- DSCR
- —
- Eligible?
- —
No personal income docs; deal must DSCR.
Hard money
10% down · 12.0% · 12mo
- Down + closing
- —
- Monthly P&I
- —
- Monthly cashflow
- —
- DSCR
- —
- Eligible?
- —
Short-term bridge; refi at stabilization.
Listing history 15 events
-
2026-06-21days on market $269,990 Active 381 DOM
-
2026-06-18days on market $269,990 Active 378 DOM
-
2026-06-17days on market $269,990 Active 377 DOM
-
2026-06-16days on market $269,990 Active 376 DOM
-
2026-06-15days on market $269,990 Active 375 DOM
-
2026-06-13days on market $269,990 Active 373 DOM
-
2026-06-09days on market $269,990 Active 369 DOM
-
2026-06-08days on market $269,990 Active 368 DOM
-
2026-06-07days on market $269,990 Active 367 DOM
-
2026-06-04days on market $269,990 Active 364 DOM
-
2026-06-03days on market $269,990 Active 363 DOM
-
2026-06-02days on market $269,990 Active 362 DOM
-
2026-06-01days on market $269,990 Active 361 DOM
-
2026-05-31days on market $269,990 Active 360 DOM
-
2025-06-05$269,990 Active 416-char remark
Show marketing remark (416 chars)
This new two-story home is designed for gracious living. Down the hallway is a modern kitchen with a center island, which enjoys direct access to the cozy dining area, welcoming family room and rear patio. On the same level is the owner's suite with an attached bathroom and walk-in closet. Occupying the top floor are three remaining bedrooms, a multipurpose loft and a flex room to provide additional living space.
ⓘ Source: listings_history table (triggers on properties + properties_extension) + one-shot
backfill from property_details.listing_events for pre-trigger history.
Nearby sold comps map
Loading sold comps map…
Walkable amenities ~0.75 mi
Loading nearby amenities…
Taxation est. · year 1
- Rental income
- $28,172
- − Mortgage interest
- −$14,875
- − Property taxes
- −$3,983
- − Insurance
- −$1,328
- − Repairs & maintenance
- −$2,254
- − Management
- −$2,254
- − Depreciation
- −$7,725
- Taxable loss
- −$4,247
- Est. tax savings @ 24.0%
- +$1,019
- After-tax cash flow
- $1,253/yr
For passive investors: Depreciation is non-cash, so a rental often shows a tax loss while cash-flowing — sheltering income. Rental losses are passive: they offset passive income freely, and up to $25,000/yr can offset ordinary (W-2) income if you actively participate and your MAGI is under $100k (phasing out to $0 by $150k); unused losses carry forward. On sale, claimed depreciation is recaptured at up to 25%, and gains may owe capital-gains tax (a 1031 exchange can defer both). Figures are a year-1 estimate at your 24.0% rate — not tax advice; consult a CPA.
Condition & rehab AI · 3 photos
This two-story home is in excellent condition with no visible repairs needed. It offers a modern kitchen, two bathrooms, and a well-maintained exterior. Upgrades such as painting and landscaping would further enhance its value.
Value-add opportunities
- Both Painting exterior and interior — Enhances curb appeal and interior aesthetics
- Both Landscaping improvements — Enhances curb appeal and adds value
- Both New flooring in entryway — Improves first impression and adds value
Renovation cost estimate screening
Value-add ROI direction
- Both Painting exterior and interior — Enhances curb appeal and interior aesthetics ↑
- Both Landscaping improvements — Enhances curb appeal and adds value ↑
- Both New flooring in entryway — Improves first impression and adds value ↑
ⓘ Cost ranges are severity-bucket heuristics (US national rule-of-thumb). Get contractor quotes + a written scope before underwriting a rehab budget.
Schools (NCES district)
- District
- Magnolia ISD
- NCES district ID
- 4828740
- Math proficiency
- 42% ▼ -7.00%
- Reading proficiency
- 45% ▼ -4.00%
- Median HH income
- $71,692
- Composite
- 39.46/100
- National rank
- #3958
- State rank
- #247 of 826 in TX
Livability — Todd Mission
- Score
- 67/100
- State rank
- #549
- US rank
- #10627
Category grades
Schools grade is shown separately in the Schools card above.
Census & demographics
- County
- Montgomery County · 663,713 people
- Metro
- Houston-The Woodlands-Sugar Land, TX
- Population (ZIP)
- 34,694
- Household income
- $124,055
- Rent vs Own
- Severe rent burden
- 273.0
Population outlook (Montgomery County) Hauer SSP2
- Today (2025)
- 713,896 people
- By 2030
- 805,263 · +12.8%
- By 2040
- 992,708 · +39.1%
- By 2050
- 1,179,590 · +65.2%
- By 2075
- 1,628,084 · +128.1%
- By 2100
- 1,937,880 · +171.5%
Race, ethnicity, and origin ACS 2023
- Neighborhood character
- Predominantly White (80%)
- Race & ethnicity
- White 80% Hispanic / Latino 14% Two or more races 11% Black 1% Asian 1%
- Hispanic origin (detail)
- Mexican 9%
- Common ancestry
- Lithuanian 6% Slovak 3% Romanian 3%
- Foreign-born
- 6% · Canada
- Languages at home
- 90% English-only · Spanish 8%
Political lean MEDSL · Montgomery
- 2024 margin
- Solid R (+45.5) · D 26.8% · R 72.3%
- 2008→2024 swing
- +7.2pp toward D · 2008: -52.7pp · 2024: -45.5pp
- All cycles
- 2024: R+45.5 2020: R+43.8 2016: R+51.4 2012: R+60.7 2008: R+52.7
Not yet ingested
- Civics
- —
Market trends
- HPI YoY
- ▼ -31.44%
- Current HPI
- 262.6973
- Rent YoY
- ▲ 0.40%
- Metro
- Houston-The Woodlands-Sugar Land, TX
- State GDP YoY
- ▲ 3.95%
- F500 in state
- 110
Industry mix (Fortune 500 HQ in TX)
| Industry | F500 HQs | Revenue |
|---|---|---|
| Energy | 16 | $1,198B |
|
||
| Technology | 5 | $198B |
|
||
| Engineering / Construction | 4 | $72B |
|
||
| Energy Services | 3 | $60B |
|
||
| Utilities | 3 | $41B |
|
||
| Healthcare | 2 | $330B |
|
||
Price history
1 event — show timeline
- 2025-06-05 Listed $269,990 Zillow
Cash-flow waterfall
monthlySold comps — $/sqft
last 12 mo · ≤1 miLoading sold comps…