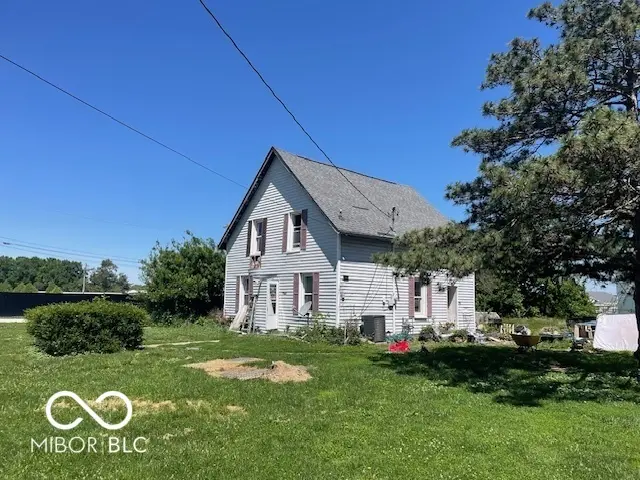
760 Hamilton Ave · Franklin, IN
Flood risk 1/10 · Minimal
- FEMA flood zone
- X (shaded)
- Chance of flooding over 30 yrs
- 0.0%
- Est. flood insurance / yr
- $473 – $860
Fire risk 1/10 · Minimal
- Est. fire insurance / yr
- $717 – $1,331
Heat risk 4/10 · Minor
- Hot days now (above 102°F)
- 7 days/yr
- Hot days in 30 yrs
- 19 days/yr
Wind risk 2/10 · Minimal
- Chance of severe wind over 30 yrs
- 1.0%
Air-quality risk 2/10 · Minimal
- Unhealthy air days now
- 1 days/yr
- Unhealthy air days in 30 yrs
- 2 days/yr
Risk factors via First Street. Map © Google.
Why this score? — see what drove the B grade
The composite is a weighted blend of 9 inputs, each scored 0–100. Each bar is that input's sub-score; the figure is the points it added to the 100-point composite (weight × sub-score).
- Cash flow +30.0/30.0
- 1% rule +10.0/10.0
- DSCR +10.0/10.0
- ARV discount +7.5/15.0
- Rent growth +3.7/5.0
- Schools +3.5/10.0
- Livability +3.2/5.0
- Condition / age +2.5/5.0
- Appreciation +0.0/10.0
$100,000
🖨 Deal sheet 📄 Offer letter ✓ Due diligence
Listing remarks MLS
Traditional home in Franklin. 2 bdrm. with possibility of 3rd Bdrm in Bonus Rm. This fixer-upper has already had lots of work. new roof and water heater. Huge lot, Lrg area to Park with room to build garage.Nice community with Great schools!
Key facts
- 0.49 acre lot
- Garage
- Built 1930
Property features AI
Finance
- HOA & community: Not a low-maintenance lifestyle community
Exterior
- Parking: Assigned parking outside; No additional parking features listed
- Utilities: Public water; Municipal sewer connected; 200+ amp electric service; Natural gas connected; Cable available; No solid waste service listed
- Home design: Single-family residence; Two levels; Fixer condition; Approximately 1/2 to 1 acre lot
- Construction: Vinyl siding; Concrete perimeter foundation
- Exterior features: Storage; Corner lot with mature and small trees; Not in a subdivision; No fence
Interior
- Kitchen: Electric cooktop; Electric oven; Refrigerator
- Bedrooms: Primary bedroom with a split layout; Three bedrooms on the upper level; Bedroom 2 (12 x 12) — Upper; Bedroom 3 (12 x 13) — Upper
- Bathrooms: One full bath (upper) with tub and shower; One half bath on the main level
- Heating & cooling: Forced air heating (electric and natural gas); Central air conditioning
- Interior features: Cellar basement; Fireplace in family room; Smoke alarm; Satellite dish
- Laundry & utility: Laundry room on the upper level; Gas water heater
Neighborhood map
What this means for you Summary
Snapshot
- This is a 3-bed/1.0-bath single-family listed at $100k.
Deal economics
- At list price, monthly cash flow is $641 ($8k/yr) — positive.
- The deal already cash-flows at list — no discount required.
- Meets the 1% rule at list price ($2k rent vs $100k).
- Cap rate 14.0% vs local median 4.0% in Franklin — top-decile yield for the area; either an underpriced asset or a hidden risk that comps aren't pricing in. Stress-test before assuming the spread holds.
Location & tenants
- Location reads 65/100 on livability (#351 in IN) — a middle-class / working-renter tenant base. Strengths: crime A+, cost of living A+, housing A+; Watch: amenities F, commute F, health & safety F.
- Franklin Community School Corporation (suburban): math 36% / reading 44% proficiency, ranked #133 of 301 in IN (top 44%) — families likely to look elsewhere, expect single-tenant / working-renter base with shorter leases.
- Zoned schools: Franklin Community High School (math 29% / reading 69%, grade D, #136 of 369 statewide, top 37%, 1,610 students, 41% FRL).
- Market conditions: Rents rising fast (+4.7%/yr); 278 active listings in the ZIP; 13 comparable units currently listed for rent nearby; rentals at typical pace (median 15d on market — plan ~3-4 weeks tenant-placement turnaround); solid renter incomes; 1,133 units permitted in Johnson County in 2024 (0 in 5+ unit buildings).
Forward outlook
- Local home prices are declining (-3.0%/yr); year-one equity from $691 of loan paydown is wiped out by about $3k of value loss. Plan a longer hold.
- Johnson County population projected at +26% by 2050 — long-run rental-demand tailwind backs the buy-and-hold thesis.
- At projected returns (-3.0% appreciation + 4.7% rent growth), your $28k cash investment doubles in ~5 years — after that, you're playing with house money.
Negotiation context
- Only 1 days on market — expect competitive offers; lowballing is unlikely to land.
- 5 sale attempts since 26y ago with the ask held roughly flat each time — persistent listings suggest the price (not the market) is what's stuck; bring a comps-based counter.
- Current owner paid $34k; list at $100k implies a 194% gain — meaningful room to come down on a strong offer.
Risks & watch-outs
- Watch-outs: property tax is 3.0% of price; built in 1930 — expect roof / HVAC / electrical / plumbing capex.
Questions for the listing agent
- Built in 1930 — when were the roof, HVAC, electrical panel, plumbing, and water heater last replaced?
- Property tax is high relative to price — has the assessment been appealed recently, and will the sale trigger a re-assessment?
- Is there a deadline driving the sale (1031 exchange, divorce, estate, relocation)? That informs how much negotiation room exists.
- Schools are D-rated, which usually means shorter tenancies and higher turnover. Who's the typical renter profile here, and what's been the actual vacancy rate?
- What's the average days-on-market for RENTAL listings here right now (not sales)? A rising rental-DOM trend means longer vacancies and softer asking-rent achievability than the comps imply.
- What's the recent tenant-quality profile in this submarket — average credit score on applications, eviction rate, late-payment / NSF rate, and stable-employment percentage? A property-management company in the area should have these aggregated.
- How much new for-sale + rental construction is in the pipeline within 1–3 miles? Heavy new supply typically softens prices + rents 12–24 months out; constrained supply supports both.
Investment metrics
- 1% rule
- 1.85% ✓
- Cap rate
- 13.98%
- Cash-on-cash
- 27.46%
- DSCR
- 2.22
- GRM
- 4.5
CMA / ARV
- ARV (on-the-fly)
- $298,080
- Comps found
- 12
Show comp detail 12 sales within ~0.75 mi
| Address | Dist | Beds/Ba | Sqft | Sold | Price | $/sf | Match |
|---|---|---|---|---|---|---|---|
| 351 Cincinnati St | 0.34mi | 3/1.0 | 1,530 (-6%) | 5mo | $174,900 | $114 | 71 |
| 601 Duane St | 0.39mi | 3/2.5 | 1,548 (-4%) | 1mo | $238,000 | $154 | 67 |
| 911 Cass Dr | 0.53mi | 3/2.0 | 1,618 (-0%) | 7mo | $270,000 | $167 | 65 |
| 1102 E Jefferson St | 0.62mi | 3/1.0 | 1,660 (+2%) | 3mo | $305,000 | $184 | 65 |
| 41 N Middleton Dr | 0.64mi | 3/2.0 | 1,600 (-1%) | 2mo | $239,000 | $149 | 62 |
| 70 Herriott St | 0.67mi | 2/1.0 (-1) | 1,620 (0%) | 2mo | $125,000 | $77 | 62 |
| 599 E Adams St | 0.47mi | 3/2.0 | 1,803 (+11%) | 0mo | $294,900 | $164 | 55 |
| 1110 Hillview Dr | 0.40mi | 3/1.5 | 1,398 (-14%) | 2mo | $313,000 | $224 | 55 |
| 1130 E Adams Dr | 0.47mi | 3/2.0 | 1,441 (-11%) | 6mo | $294,900 | $205 | 50 |
| 1240 Hillview Dr | 0.52mi | 2/2.5 (-1) | 1,769 (+9%) | 2mo | $381,000 | $215 | 48 |
| 1210 E Adams Dr | 0.54mi | 3/1.5 | 1,816 (+12%) | 8mo | $365,000 | $201 | 46 |
| 1118 Orchard Ln | 0.68mi | 3/1.5 | 1,420 (-12%) | 1mo | $283,000 | $199 | 45 |
Match score weights: distance 35% · size 25% · config 20% · recency 20%. Top-matched comps best support the ARV.
Projected returns pro-forma
-3.0% appreciation · 4.68% rent growth · sell at horizon
- IRR
- 23.6%
- Equity multiple
- 2.00×
- Total profit
- $27,887
- Equity at exit
- $14,910
- IRR
- 32.7%
- Equity multiple
- 4.24×
- Total profit
- $90,734
- Equity at exit
- $8,646
Cash invested: $28,000 (down + closing). Projections, not guarantees.
Landlord ↔ Tenant lean methodology
- Overall (STATE)
- 90 Strongly Landlord-Friendly
- State Indiana
- 90 Strongly Landlord-Friendly · R+11
- County
- — inherits STATE
- City
- — inherits STATE
ZIP-level market 46131
- Home prices YoY
- -27.8%
- Rents YoY
- 4.7%
- Active inventory
- 278
- Price-to-rent
- 4.5×
Monthly cashflow live
- Estimated rent
- $1,845 high interval (Pro) →
- Mortgage (P&I)
- −$524
- Tax from tax record
- −$251 /mo · $3,009/yr
- Insurance
- −$42
- HOA
- −$0
- Vacancy / Maint / Mgmt
- −$387
- Net cashflow
- $641
Break-even live
UW: 25.0% down · 7.5% · 30yr · 1.5% tax · 5.0% vac · 8.0% maint · 8.0% mgmt
Financing live
Cash to close
- Down payment
- $25,000
- Closing costs
- $3,000
- Reserves months
- —
- Total cash needed
- —
Loan-product check · same deal, 3 products live
Conventional
25% down · 7.5% · 30yr
- Down + closing
- —
- Monthly P&I
- —
- Monthly cashflow
- —
- DSCR
- —
- Eligible?
- —
Personal DTI + credit; lowest rate.
DSCR
20% down · 8.5% · 30yr
- Down + closing
- —
- Monthly P&I
- —
- Monthly cashflow
- —
- DSCR
- —
- Eligible?
- —
No personal income docs; deal must DSCR.
Hard money
10% down · 12.0% · 12mo
- Down + closing
- —
- Monthly P&I
- —
- Monthly cashflow
- —
- DSCR
- —
- Eligible?
- —
Short-term bridge; refi at stabilization.
Rent comps 13 comps
| Address | Beds | Baths | Sqft | Rent | $/sqft | DOM | Units | Dist |
|---|---|---|---|---|---|---|---|---|
| 7505 Founders Way Franklin, IN | 1.0–3.0 | 1.0–2.0 | 1045 | $2,038 | $1.95 | 1d | 16 | 0.31mi |
| 954 Brookstone Dr Franklin, IN | 4.0 | 2.5 | 2230 | $1,750 | $0.78 | 7d | 1 | 0.61mi |
| 954 Brookstone Dr Franklin, IN | 4.0 | 3.0 | 2230 | $1,750 | $0.78 | 14d | 1 | 0.61mi |
| 978 Brookstone Dr Franklin, IN | 3.0 | 2.5 | 2230 | $1,876 | $0.84 | 43d | 1 | 0.61mi |
| 399 N Main St Unit 2 Franklin, IN | 2.0 | 2.0 | 1177 | $1,150 | $0.98 | 23d | 1 | 0.66mi |
| 399 N Main St Unit 1 Franklin, IN | 2.0 | 2.0 | 1177 | $1,150 | $0.98 | 43d | 1 | 0.66mi |
| 312 Carriage Ln Franklin, IN | 2.0 | 2.5 | 1908 | $1,700 | $0.89 | 16d | 1 | 0.70mi |
| 2108 Bridlewood Dr Franklin, IN | 3.0 | 2.0 | 1510 | $1,762 | $1.17 | 1d | 1 | 0.76mi |
| 1541 Brookfield Cir Franklin, IN | 2.0 | 1.5 | 1297 | $1,595 | $1.23 | 1d | 1 | 0.78mi |
| 1600 Traditions Ct Franklin, IN | 2.0–4.0 | 2.0 | 1190 | $1,692 | $1.42 | 1d | 5 | 0.81mi |
| 150 S Main St Franklin, IN | 3.0 | 2.0 | 1500 | $2,400 | $1.60 | 43d | 1 | 0.94mi |
| 2230 Cedarmill Dr Franklin, IN | 3.0 | 2.5 | 2067 | $1,900 | $0.92 | 43d | 1 | 1.03mi |
| 1905 Chambers Dr Franklin, IN | 3.0 | 2.0 | 1216 | $1,899 | $1.56 | 1d | 1 | 1.42mi |
Listing history 2 events
-
2026-06-07remarks 88-char remark
-
2026-06-07$100,000 Pending 1 DOM
ⓘ Source: listings_history table (triggers on properties + properties_extension) + one-shot
backfill from property_details.listing_events for pre-trigger history.
Tax reassessment forecast IN · Partial reset (capped growth)
- Current annual tax
- $3,009 · $251/mo
- Projected year-2 tax
- $3,009 · $251/mo
- Expected delta
- $0/yr ($0/mo · 0.0%)
ⓘ Screening estimate from a state-policy table — verify with the county assessor before closing.
Climate risk First Street
- Flood 1/10 Low FEMA zone X (shaded) · 0% chance over 30 yrs
- Wildfire 1/10 Low
- Heat 4/10 Moderate 7 d/yr ≥102°F today · 19 d/yr by 30 yrs out
- Wind 2/10 Low 100% chance of damaging wind over 30 yrs
- Air quality 2/10 Low 1 unhealthy d/yr today · 2 by 30 yrs out
Nearby sold comps map
Loading sold comps map…
Walkable amenities ~0.75 mi
Loading nearby amenities…
Taxation est. · year 1
- Rental income
- $22,142
- − Mortgage interest
- −$5,602
- − Property taxes
- −$3,009
- − Insurance
- −$500
- − Repairs & maintenance
- −$1,771
- − Management
- −$1,771
- − Depreciation
- −$2,909
- Taxable income
- $6,579
- Est. tax owed @ 24.0%
- −$1,579
- After-tax cash flow
- $6,111/yr
For passive investors: Depreciation is non-cash, so a rental often shows a tax loss while cash-flowing — sheltering income. Rental losses are passive: they offset passive income freely, and up to $25,000/yr can offset ordinary (W-2) income if you actively participate and your MAGI is under $100k (phasing out to $0 by $150k); unused losses carry forward. On sale, claimed depreciation is recaptured at up to 25%, and gains may owe capital-gains tax (a 1031 exchange can defer both). Figures are a year-1 estimate at your 24.0% rate — not tax advice; consult a CPA.
Schools (NCES district)
- District
- Franklin Community School Corporation
- NCES district ID
- 1803690
- Math proficiency
- 36% ▼ -11.00%
- Reading proficiency
- 44% ▼ -8.00%
- Median HH income
- $54,855
- Composite
- 34.93/100
- National rank
- #5066
- State rank
- #133 of 301 in IN
Livability — Franklin
- Score
- 65/100
- State rank
- #351
- US rank
- #13428
Category grades
Schools grade is shown separately in the Schools card above.
Census & demographics
- Census place
- Franklin, IN
- County
- Johnson County · 154,261 people
- City population
- 34,647
- Metro
- Indianapolis-Carmel-Anderson, IN
- Population (ZIP)
- 34,647
- Household income
- $85,076
- Rent vs Own
- Severe rent burden
- 984.0
Population outlook (Johnson County) Hauer SSP2
- Today (2025)
- 170,080 people
- By 2030
- 179,983 · +5.8%
- By 2040
- 198,580 · +16.8%
- By 2050
- 214,661 · +26.2%
- By 2075
- 247,990 · +45.8%
- By 2100
- 257,821 · +51.6%
Race, ethnicity, and origin ACS 2023
- Neighborhood character
- Predominantly White (92%)
- Race & ethnicity
- White 92% Two or more races 4% Hispanic / Latino 2% Black 2%
- Common ancestry
- Slovak 2% Italian 1% Serbian 1%
- Foreign-born
- 2% · Canada
- Languages at home
- 97% English-only · Spanish 2% Russian/Polish/Slavic 1% Other Asian/Pacific 1%
Political lean MEDSL · Johnson
- 2024 margin
- Solid R (+34.3) · D 32.0% · R 66.3% · Other 1.7%
- 2008→2024 swing
- -8.9pp toward R · 2008: -25.5pp · 2024: -34.3pp
- All cycles
- 2024: R+34.3 2020: R+34.1 2016: R+42.5 2012: R+38.5 2008: R+25.5
Not yet ingested
- Civics
- —
Market trends
- HPI YoY
- ▼ -90.53%
- Current HPI
- 235.0009
- Rent YoY
- ▲ 4.68%
- Metro
- Indianapolis-Carmel-Anderson, IN
- State GDP YoY
- ▲ 2.90%
- F500 in state
- 18
Industry mix (Fortune 500 HQ in IN)
| Industry | F500 HQs | Revenue |
|---|---|---|
| Industrial Machinery | 2 | $37B |
|
||
| Healthcare | 1 | $177B |
|
||
| Pharmaceuticals | 1 | $45B |
|
||
| Metals / Steel | 1 | $18B |
|
||
| Agriculture | 1 | $17B |
|
||
| Packaging | 1 | $12B |
|
||
Price history
+3.2% since first listed13 events — show timeline
- 2026-06-05 Pending — MIBOR as Distributed by MLS Grid
- 2026-06-04 Listed $100,000 MIBOR as Distributed by MLS Grid
- 2013-03-07 Listing Removed — MIBOR as Distributed by MLS Grid
- 2013-03-04 Sold (MLS) $34,000 MIBOR as Distributed by MLS Grid
- 2012-12-27 Listed $38,000 MIBOR as Distributed by MLS Grid
- 2011-07-22 Listing Removed — MIBOR as Distributed by MLS Grid
- 2011-07-22 Sold (Public Records) $15,000 Public Records
- 2011-07-20 Sold (MLS) $15,000 MIBOR as Distributed by MLS Grid
- 2010-11-17 Listed $34,000 MIBOR as Distributed by MLS Grid
- 2010-06-11 Listing Removed — MIBOR as Distributed by MLS Grid
- 2009-07-13 Listed $59,000 MIBOR as Distributed by MLS Grid
- 2001-01-26 Listing Removed — MIBOR as Distributed by MLS Grid
- 2000-08-26 Listed $96,900 MIBOR as Distributed by MLS Grid
Property tax history
+7.7%/yrLatest (2024): $3,009 · -0.6% YoY. Source: county tax records.
Cash-flow waterfall
monthlySold comps — $/sqft
last 12 mo · ≤1 miLoading sold comps…