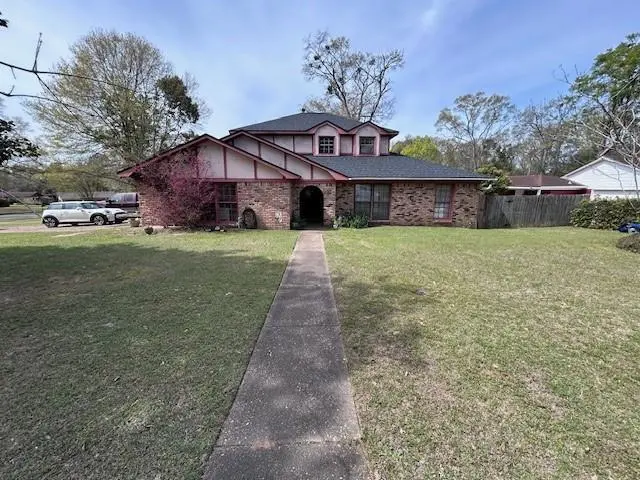
2592 Wagon Tongue Dr · Mobile, AL
Flood risk 1/10 · Minimal
- FEMA flood zone
- X (unshaded)
- Chance of flooding over 30 yrs
- 0.0%
- Est. flood insurance / yr
- $507 – $1,088
Fire risk 4/10 · Minor
- Est. fire insurance / yr
- $916 – $1,700
Heat risk 9/10 · Severe
- Hot days now (above 105°F)
- 7 days/yr
- Hot days in 30 yrs
- 21 days/yr
Wind risk 9/10 · Severe
- Chance of severe wind over 30 yrs
- 99.0%
Air-quality risk 1/10 · Minimal
- Unhealthy air days now
- 0 days/yr
- Unhealthy air days in 30 yrs
- 0 days/yr
Risk factors via First Street. Map © Google.
Why this score? — see what drove the B+ grade
The composite is a weighted blend of 9 inputs, each scored 0–100. Each bar is that input's sub-score; the figure is the points it added to the 100-point composite (weight × sub-score).
- Cash flow +30.0/30.0
- ARV discount +15.0/15.0
- DSCR +10.0/10.0
- 1% rule +9.1/10.0
- Livability +3.8/5.0
- Condition / age +2.5/5.0
- Rent growth +2.4/5.0
- Schools +2.3/10.0
- Appreciation +0.0/10.0
$189,900
🖨 Deal sheet 📄 Offer letter ✓ Due diligence
Listing remarks
Investor special in the heart of Carriage Hills! This 2500 sq ft 2-story home sits on a corner lot and features a fenced in back yard with a saltwater pool and storage shed. Roof and AC are approx 2 years old, this property needs flooring, paint and cosmetic updates to kitchen and baths to make this property shine! Side entry double garage! A great opportunity to make it your own!
Key facts
- Saltwater pool
- Storage shed
- Fenced in back yard
Tags
Neighborhood map
What this means for you Summary
Snapshot
- This is a 4-bed/2.5-bath single-family listed at $190k.
Deal economics
- At list price, monthly cash flow is $802 ($10k/yr) — positive.
- The deal already cash-flows at list — no discount required.
- Meets the 1% rule at list price ($3k rent vs $190k).
- Cap rate 11.4% vs local median 4.9% in Mobile — top-decile yield for the area; either an underpriced asset or a hidden risk that comps aren't pricing in. Stress-test before assuming the spread holds.
Location & tenants
- Location reads 75/100 on livability (#20 in AL, #4,262 nationally) — a middle-class / working-renter tenant base. Strengths: commute A+, cost of living A+, housing A+; Watch: crime F, employment D-.
- Mobile County (urban): math 15% / reading 39% proficiency, ranked #81 of 129 in AL (top 63%) — low school quality limits family demand, transient renter base, plan for 1-2y turnover; 67% free/reduced lunch — lower-income household profile, screen leases tightly.
- Zoned schools: Olive J Dodge Elementary School (math 6% / reading 35%, grade F, #453 of 627 statewide, top 72%, 875 students, 67% FRL); Wp Davidson High School (math 36% / reading 41%, grade F, #37 of 305 statewide, top 12%, 1,535 students, 61% FRL) — zoned schools at 64% FRL track the district average.
- Market conditions: Rents soft (-0.4%/yr); 551 active listings in the ZIP; 2 comparable units currently listed for rent nearby; solid renter incomes; 1,678 units permitted in Mobile County in 2024 (264 in 5+ unit buildings).
- This rent runs 42% of the median local income ($76k/yr) — at the standard rent-burdened threshold; future hikes will face affordability resistance.
Forward outlook
- Local home prices are declining (-3.0%/yr); year-one equity from $1k of loan paydown is wiped out by about $6k of value loss. Plan a longer hold.
- Mobile County population projected to shrink 8% by 2050 — rents likely to lag national; underwrite the cash flow, not the appreciation.
- At projected returns (-3.0% appreciation + 0.0% rent growth), your $53k cash investment doubles in ~9 years — after that, you're playing with house money.
Negotiation context
- Only 6 days on market — expect competitive offers; lowballing is unlikely to land.
Risks & watch-outs
- Climate carrying-cost: severe wind risk, 99% chance of damaging wind over 30y; extreme-heat days projected 7→21/yr by 2055 (HVAC capex compounding) — expect insurance premiums to compound above CPI over the hold.
Questions for the listing agent
- Built in 1975 — when were the roof, HVAC, electrical panel, plumbing, and water heater last replaced?
- Is there a deadline driving the sale (1031 exchange, divorce, estate, relocation)? That informs how much negotiation room exists.
- Schools are D-rated, which usually means shorter tenancies and higher turnover. Who's the typical renter profile here, and what's been the actual vacancy rate?
- Crime grade is F in this area — have there been break-ins, vandalism, or insurance claims at this property in the last 3 years? What carrier currently insures it and at what premium?
- What's the average days-on-market for RENTAL listings here right now (not sales)? A rising rental-DOM trend means longer vacancies and softer asking-rent achievability than the comps imply.
- What's the recent tenant-quality profile in this submarket — average credit score on applications, eviction rate, late-payment / NSF rate, and stable-employment percentage? A property-management company in the area should have these aggregated.
- How much new for-sale + rental construction is in the pipeline within 1–3 miles? Heavy new supply typically softens prices + rents 12–24 months out; constrained supply supports both.
Investment metrics
- 1% rule
- 1.41% ✓
- Cap rate
- 11.36%
- Cash-on-cash
- 18.09%
- DSCR
- 1.80
- GRM
- 5.9
CMA / ARV
- ARV (on-the-fly)
- $346,800
- Comps found
- 12
Show comp detail 12 sales within ~0.75 mi
| Address | Dist | Beds/Ba | Sqft | Sold | Price | $/sf | Match |
|---|---|---|---|---|---|---|---|
| 2592 Wagon Tongue Dr | 0.00mi | 4/2.5 | 2,550 (0%) | 0mo | $166,000 | $65 | 100 |
| 2700 Old Dobbin Dr E | 0.17mi | 4/2.5 | 2,265 (-11%) | 8mo | $250,000 | $110 | 67 |
| 7024 Doppel Ln | 0.61mi | 5/2.5 (+1) | 2,528 (-1%) | 2mo | $345,000 | $136 | 64 |
| 6386 Oakleigh Way | 0.45mi | 3/2.5 (-1) | 2,473 (-3%) | 8mo | $368,000 | $149 | 62 |
| 7165 Londonderry Dr | 0.69mi | 4/3.0 | 2,491 (-2%) | 4mo | $410,000 | $165 | 59 |
| 6609 Footmans Ct | 0.40mi | 4/2.0 | 2,247 (-12%) | 4mo | $229,900 | $102 | 56 |
| 2720 Weston Dr | 0.72mi | 4/3.0 | 2,431 (-5%) | 4mo | $466,750 | $192 | 53 |
| 2116 Dorchester Dr | 0.69mi | 3/2.5 (-1) | 2,479 (-3%) | 7mo | $321,000 | $129 | 52 |
| 6415 Falconwood Ct | 0.66mi | 4/3.5 | 2,642 (+4%) | 10mo | $302,000 | $114 | 51 |
| 2825 Weston Dr | 0.72mi | 4/3.0 | 2,350 (-8%) | 3mo | $459,319 | $195 | 49 |
| 2212 Fieldstone Ct | 0.67mi | 4/2.5 | 2,783 (+9%) | 12mo | $378,000 | $136 | 43 |
| 2305 Cedar Ky | 0.64mi | 4/2.0 | 2,254 (-12%) | 8mo | $270,000 | $120 | 42 |
Match score weights: distance 35% · size 25% · config 20% · recency 20%. Top-matched comps best support the ARV.
Projected returns pro-forma
-3.0% appreciation · 0.0% rent growth · sell at horizon
- IRR
- 6.2%
- Equity multiple
- 1.23×
- Total profit
- $12,483
- Equity at exit
- $28,315
- IRR
- 12.8%
- Equity multiple
- 1.87×
- Total profit
- $46,471
- Equity at exit
- $16,419
Cash invested: $53,172 (down + closing). Projections, not guarantees.
Landlord ↔ Tenant lean methodology
- Overall (STATE)
- 90 Strongly Landlord-Friendly
- State Alabama
- 90 Strongly Landlord-Friendly · R+15
- County
- — inherits STATE
- City
- — inherits STATE
ZIP-level market 36695
- Home prices YoY
- -30.9%
- Rents YoY
- -0.4%
- Active inventory
- 551
- Price-to-rent
- 5.9×
Monthly cashflow live
- Estimated rent
- $2,676 medium interval (Pro) →
- Mortgage (P&I)
- −$996
- Tax est. 1.5%
- −$237 /mo · $2,848/yr
- Insurance
- −$79
- HOA
- −$0
- Vacancy / Maint / Mgmt
- −$562
- Net cashflow
- $802
Break-even live
UW: 25.0% down · 7.5% · 30yr · 1.5% tax · 5.0% vac · 8.0% maint · 8.0% mgmt
Financing live
Cash to close
- Down payment
- $47,475
- Closing costs
- $5,697
- Reserves months
- —
- Total cash needed
- —
Loan-product check · same deal, 3 products live
Conventional
25% down · 7.5% · 30yr
- Down + closing
- —
- Monthly P&I
- —
- Monthly cashflow
- —
- DSCR
- —
- Eligible?
- —
Personal DTI + credit; lowest rate.
DSCR
20% down · 8.5% · 30yr
- Down + closing
- —
- Monthly P&I
- —
- Monthly cashflow
- —
- DSCR
- —
- Eligible?
- —
No personal income docs; deal must DSCR.
Hard money
10% down · 12.0% · 12mo
- Down + closing
- —
- Monthly P&I
- —
- Monthly cashflow
- —
- DSCR
- —
- Eligible?
- —
Short-term bridge; refi at stabilization.
Rent comps 2 comps
| Address | Beds | Baths | Sqft | Rent | $/sqft | DOM | Units | Dist |
|---|---|---|---|---|---|---|---|---|
| 2004 Pine Needle Dr E Mobile, AL | 5.0 | 2.5 | 2900 | $3,800 | $1.31 | 43d | 1 | 1.15mi |
| 1997 Bradshire Dr Mobile, AL | 4.0 | 3.0 | 2834 | $2,200 | $0.78 | 43d | 1 | 1.21mi |
Listing history 2 events
-
2026-03-26status Pending
-
2026-03-20$189,900 Active
ⓘ Source: listings_history table (triggers on properties + properties_extension) + one-shot
backfill from property_details.listing_events for pre-trigger history.
Climate risk First Street
- Flood 1/10 Low FEMA zone X (unshaded) · 0% chance over 30 yrs
- Wildfire 4/10 Moderate
- Heat 9/10 Extreme 7 d/yr ≥105°F today · 21 d/yr by 30 yrs out
- Wind 9/10 Extreme 99% chance of damaging wind over 30 yrs
- Air quality 1/10 Low 0 unhealthy d/yr today · 0 by 30 yrs out
Nearby sold comps map
Loading sold comps map…
Walkable amenities ~0.75 mi
Loading nearby amenities…
Taxation est. · year 1
- Rental income
- $32,111
- − Mortgage interest
- −$10,637
- − Property taxes
- −$2,848
- − Insurance
- −$950
- − Repairs & maintenance
- −$2,569
- − Management
- −$2,569
- − Depreciation
- −$5,524
- Taxable income
- $7,014
- Est. tax owed @ 24.0%
- −$1,683
- After-tax cash flow
- $7,936/yr
For passive investors: Depreciation is non-cash, so a rental often shows a tax loss while cash-flowing — sheltering income. Rental losses are passive: they offset passive income freely, and up to $25,000/yr can offset ordinary (W-2) income if you actively participate and your MAGI is under $100k (phasing out to $0 by $150k); unused losses carry forward. On sale, claimed depreciation is recaptured at up to 25%, and gains may owe capital-gains tax (a 1031 exchange can defer both). Figures are a year-1 estimate at your 24.0% rate — not tax advice; consult a CPA.
Schools (NCES district)
- District
- Mobile County
- NCES district ID
- 0102370
- Math proficiency
- 15% ▼ -28.00%
- Reading proficiency
- 39% ▬ 0.00%
- Median HH income
- $42,455
- Composite
- 22.9/100
- National rank
- #8002
- State rank
- #81 of 129 in AL
Livability — Mobile
- Score
- 75/100
- State rank
- #20
- US rank
- #4262
Category grades
Schools grade is shown separately in the Schools card above.
Census & demographics
- Census place
- Mobile, AL
- County
- Mobile County · 246,577 people
- City population
- 205,729
- Metro
- Mobile, AL
- Population (ZIP)
- 52,690
- Household income
- $76,040
- Rent vs Own
- Severe rent burden
- 1619.0
Population outlook (Mobile County) Hauer SSP2
- Today (2025)
- 415,303 people
- By 2030
- 411,755 · -0.9%
- By 2040
- 399,670 · -3.8%
- By 2050
- 382,616 · -7.9%
- By 2075
- 337,353 · -18.8%
- By 2100
- 283,391 · -31.8%
Race, ethnicity, and origin ACS 2023
- Neighborhood character
- Predominantly White (67%)
- Race & ethnicity
- White 67% Black 23% Two or more races 5% Hispanic / Latino 5% Asian 2%
- Common ancestry
- Lithuanian 3% Italian 2% Slovak 1%
- Foreign-born
- 5% · Canada, Vietnam, China
- Languages at home
- 94% English-only · Spanish 2% Vietnamese 1% Arabic 1%
Political lean MEDSL · Mobile
- 2024 margin
- R (+16.4) · D 41.3% · R 57.7%
- 2008→2024 swing
- -7.7pp toward R · 2008: -8.7pp · 2024: -16.4pp
- All cycles
- 2024: R+16.4 2020: R+11.9 2016: R+13.9 2012: R+9.3 2008: R+8.7
Not yet ingested
- Civics
- —
Market trends
- HPI YoY
- ▼ -86.28%
- Current HPI
- 193.1651
- Rent YoY
- ▼ -0.41%
- Metro
- Mobile, AL
- State GDP YoY
- ▲ 2.94%
- F500 in state
- 4
Industry mix (Fortune 500 HQ in AL)
| Industry | F500 HQs | Revenue |
|---|---|---|
| Financial Services | 1 | $8B |
|
||
| Healthcare | 1 | $5B |
|
||
Price history
2 events — show timeline
- 2026-03-26 Pending — GCMLS AL
- 2026-03-20 Listed $189,900 GCMLS AL
Cash-flow waterfall
monthlySold comps — $/sqft
last 12 mo · ≤1 miLoading sold comps…