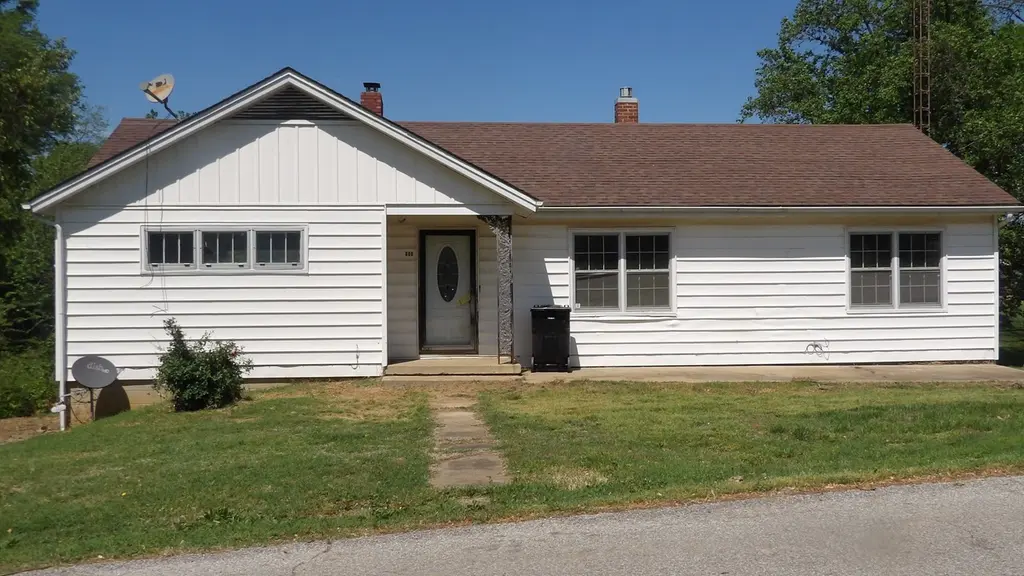
606 Bohn St · Rosiclare, IL
Flood risk 4/10 · Minor
- FEMA flood zone
- X (unshaded)
- Chance of flooding over 30 yrs
- 0.22%
- Est. flood insurance / yr
- $473 – $860
Fire risk 1/10 · Minimal
- Est. fire insurance / yr
- $804 – $1,492
Heat risk 5/10 · Moderate
- Hot days now (above 107°F)
- 7 days/yr
- Hot days in 30 yrs
- 21 days/yr
Wind risk 3/10 · Minor
- Chance of severe wind over 30 yrs
- 5.0%
Air-quality risk 2/10 · Minimal
- Unhealthy air days now
- 1 days/yr
- Unhealthy air days in 30 yrs
- 2 days/yr
Risk factors via First Street. Map © Google.
Why this score? — see what drove the B- grade
The composite is a weighted blend of 9 inputs, each scored 0–100. Each bar is that input's sub-score; the figure is the points it added to the 100-point composite (weight × sub-score).
- Cash flow +30.0/30.0
- 1% rule +10.0/10.0
- DSCR +10.0/10.0
- Appreciation +5.0/10.0
- Livability +3.6/5.0
- ARV discount +2.9/15.0
- Rent growth +2.5/5.0
- Condition / age +2.2/5.0
- Schools +1.0/10.0
$44,900
🖨 Deal sheet 📄 Offer letter ✓ Due diligence
Listing remarks MLS
2 Bdrm home with full basement that adds additional living space. There is an additional bathroom in the basement as well as an area that could be a 3rd bedroom or family room or rec room etc. See Addendum for instructions on submitting offers and any fees associated with such. and buyer's agents see broker to broker comments.
Key facts
- 0.48 acre lot
- 2 parking spots
- Built 1960
Neighborhood map
What this means for you Summary
Snapshot
- This is a 2-bed/2.0-bath single-family listed at $45k. Condition is rated fair.
Deal economics
- At list price, monthly cash flow is $479 ($6k/yr) — positive.
- The deal already cash-flows at list — no discount required.
- Meets the 1% rule at list price ($999 rent vs $45k).
- Recommended offer: $44k (3.0% below list) — sets the bar for market timing.
Location & tenants
- Location reads 72/100 on livability (#320 in IL) — a middle-class / working-renter tenant base. Strengths: cost of living A+, housing A+, health & safety A+; Watch: schools F, amenities F, commute F.
- Hardin County CUSD 1 (rural): math 7% / reading 17% proficiency, ranked #564 of 620 in IL (top 91%) — low school quality limits family demand, transient renter base, plan for 1-2y turnover.
- Market conditions: 9 active listings in the ZIP.
Forward outlook
- In year one you build about $2k of equity ($310 loan paydown + $1k appreciation (3.0% local appreciation)).
- Hardin County population projected at -26% by 2050 — secular population decline; favor cash flow + early exit over multi-decade hold.
- At projected returns (3.0% appreciation + 3.0% rent growth), your $13k cash investment doubles in ~2 years — after that, you're playing with house money.
Negotiation context
- It's been on market 58 days — a 3% lower offer ($44k) is reasonable based on typical stale-listing flexibility.
Risks & watch-outs
- Climate carrying-cost: extreme-heat days projected 7→21/yr by 2055 (HVAC capex compounding) — expect insurance premiums to compound above CPI over the hold.
Questions for the listing agent
- It's been on market 58 days. Have you received any prior offers? Is the seller open to a 3% concession, seller financing, or rate buy-down credit?
- Have any recent inspections been done? Can we get a copy of the seller's disclosures and any deferred-maintenance estimates?
- Built in 1960 — when were the roof, HVAC, electrical panel, plumbing, and water heater last replaced?
- Is there a deadline driving the sale (1031 exchange, divorce, estate, relocation)? That informs how much negotiation room exists.
- Schools are F-rated, which usually means shorter tenancies and higher turnover. Who's the typical renter profile here, and what's been the actual vacancy rate?
- What's the average days-on-market for RENTAL listings here right now (not sales)? A rising rental-DOM trend means longer vacancies and softer asking-rent achievability than the comps imply.
- What's the recent tenant-quality profile in this submarket — average credit score on applications, eviction rate, late-payment / NSF rate, and stable-employment percentage? A property-management company in the area should have these aggregated.
- How much new for-sale + rental construction is in the pipeline within 1–3 miles? Heavy new supply typically softens prices + rents 12–24 months out; constrained supply supports both.
Investment metrics
- 1% rule
- 2.23% ✓
- Cap rate
- 19.10%
- Cash-on-cash
- 45.73%
- DSCR
- 3.03
- GRM
- 3.7
CMA / ARV
- ARV (median comp)
- $40,723
- List price
- $44,900
- Delta
- 10.26%
- Verdict
- OVERPRICED
- Comps
- 12 within 1.0 mi
Show comp detail 4 sales within ~0.75 mi
| Address | Dist | Beds/Ba | Sqft | Sold | Price | $/sf | Match |
|---|---|---|---|---|---|---|---|
| 711 Mclean St | 0.21mi | 3/1.0 (+1) | 1,062 (-6%) | 8mo | $39,600 | $37 | 65 |
| 711 Mclean St | 0.21mi | 3/1.0 (+1) | 1,062 (-6%) | 8mo | $39,600 | $37 | 65 |
| 326 Charles St | 0.18mi | 2/1.0 | 1,060 (-6%) | 16mo | $63,500 | $60 | 65 |
| 825 3rd St | 0.29mi | 2/1.0 | 1,200 (+6%) | 19mo | $69,000 | $58 | 56 |
Match score weights: distance 35% · size 25% · config 20% · recency 20%. Top-matched comps best support the ARV.
Projected returns pro-forma
3.0% appreciation · 3.0% rent growth · sell at horizon
- IRR
- 51.0%
- Equity multiple
- 3.86×
- Total profit
- $35,939
- Equity at exit
- $20,189
- IRR
- 50.7%
- Equity multiple
- 7.78×
- Total profit
- $85,201
- Equity at exit
- $31,114
Cash invested: $12,572 (down + closing). Projections, not guarantees.
Landlord ↔ Tenant lean methodology
- Overall (STATE)
- 43 Moderately Tenant-Leaning
- State Illinois
- 43 Moderately Tenant-Leaning · D+7
- County
- — inherits STATE
- City
- — inherits STATE
ZIP-level market 62982
- Active inventory
- 9
- Price-to-rent
- 3.7×
Monthly cashflow live
- Estimated rent
- $999 medium interval (Pro) →
- Mortgage (P&I)
- −$235
- Tax est. 1.5%
- −$56 /mo · $674/yr
- Insurance
- −$19
- HOA
- −$0
- Vacancy / Maint / Mgmt
- −$210
- Net cashflow
- $479
Break-even live
UW: 25.0% down · 7.5% · 30yr · 1.5% tax · 5.0% vac · 8.0% maint · 8.0% mgmt
Financing live
Cash to close
- Down payment
- $11,225
- Closing costs
- $1,347
- Reserves months
- —
- Total cash needed
- —
Loan-product check · same deal, 3 products live
Conventional
25% down · 7.5% · 30yr
- Down + closing
- —
- Monthly P&I
- —
- Monthly cashflow
- —
- DSCR
- —
- Eligible?
- —
Personal DTI + credit; lowest rate.
DSCR
20% down · 8.5% · 30yr
- Down + closing
- —
- Monthly P&I
- —
- Monthly cashflow
- —
- DSCR
- —
- Eligible?
- —
No personal income docs; deal must DSCR.
Hard money
10% down · 12.0% · 12mo
- Down + closing
- —
- Monthly P&I
- —
- Monthly cashflow
- —
- DSCR
- —
- Eligible?
- —
Short-term bridge; refi at stabilization.
Listing history 17 events
-
2026-06-18days on market $44,900 Active 58 DOM
-
2026-06-17days on market $44,900 Active 57 DOM
-
2026-06-16days on market $44,900 Active 56 DOM
-
2026-06-15days on market $44,900 Active 55 DOM
-
2026-06-13days on market $44,900 Active 53 DOM
-
2026-06-12days on market $44,900 Active 52 DOM
-
2026-06-09days on market $44,900 Active 49 DOM
-
2026-06-08days on market $44,900 Active 48 DOM
-
2026-06-07days on market $44,900 Active 47 DOM
-
2026-06-05days on market $44,900 Active 45 DOM
-
2026-06-04days on market $44,900 Active 43 DOM
-
2026-06-02days on market $44,900 Active 42 DOM
-
2026-06-01days on market $44,900 Active 41 DOM
-
2026-05-31days on market $44,900 Active 40 DOM
-
2026-05-31days on market $44,900 Active 39 DOM
-
2026-04-20$49,900 Active 331-char remark
Show marketing remark (331 chars)
2 Bdrm home with full basement that adds additional living space. There is an additional bathroom in the basement as well as an area that could be a 3rd bedroom or family room or rec room etc. See Addendum for instructions on submitting offers and any fees associated with such. and buyer's agents see broker to broker comments.
-
2021-08-06historical
ⓘ Source: listings_history table (triggers on properties + properties_extension) + one-shot
backfill from property_details.listing_events for pre-trigger history.
Climate risk First Street
- Flood 4/10 Moderate FEMA zone X (unshaded) · 22% chance over 30 yrs
- Wildfire 1/10 Low
- Heat 5/10 Major 7 d/yr ≥107°F today · 21 d/yr by 30 yrs out
- Wind 3/10 Moderate 5% chance of damaging wind over 30 yrs
- Air quality 2/10 Low 1 unhealthy d/yr today · 2 by 30 yrs out
Nearby sold comps map
Loading sold comps map…
Walkable amenities ~0.75 mi
Loading nearby amenities…
Taxation est. · year 1
- Rental income
- $11,991
- − Mortgage interest
- −$2,515
- − Property taxes
- −$674
- − Insurance
- −$224
- − Repairs & maintenance
- −$959
- − Management
- −$959
- − Depreciation
- −$1,306
- Taxable income
- $5,353
- Est. tax owed @ 24.0%
- −$1,285
- After-tax cash flow
- $4,465/yr
For passive investors: Depreciation is non-cash, so a rental often shows a tax loss while cash-flowing — sheltering income. Rental losses are passive: they offset passive income freely, and up to $25,000/yr can offset ordinary (W-2) income if you actively participate and your MAGI is under $100k (phasing out to $0 by $150k); unused losses carry forward. On sale, claimed depreciation is recaptured at up to 25%, and gains may owe capital-gains tax (a 1031 exchange can defer both). Figures are a year-1 estimate at your 24.0% rate — not tax advice; consult a CPA.
Condition & rehab AI · 12 photos
This home requires moderate renovations to update the kitchen and bathrooms, replace worn flooring, and repair the basement walls. These updates would significantly increase its resale and rental value.
Repairs flagged
- Major kitchen cabinets — severely dated and worn
- Major bathroom fixtures — dated and worn
- Major flooring — worn and in need of replacement
- Major basement walls — peeling paint and potential structural issues
Value-add opportunities
- Resale update kitchen cabinets and countertops — modernizing the kitchen would attract more buyers
- Resale update bathroom fixtures and tile — modernizing the bathrooms would attract more buyers
- Both replace worn flooring — new flooring would improve both resale and rental value
- Both repair and paint basement walls — improving the basement would make it more attractive for potential buyers and renters
Renovation cost estimate screening
| Repair item | Severity | Est. cost |
|---|---|---|
| kitchen cabinets · severely dated and worn | Major | $15,000–50,000 |
| bathroom fixtures · dated and worn | Major | $15,000–50,000 |
| flooring · worn and in need of replacement | Major | $15,000–50,000 |
| basement walls · peeling paint and potential structural issues | Major | $15,000–50,000 |
| Total estimated repair cost · 4 items | $60,000–200,000 |
Value-add ROI direction
- Resale update kitchen cabinets and countertops — modernizing the kitchen would attract more buyers ↑
- Resale update bathroom fixtures and tile — modernizing the bathrooms would attract more buyers ↑
- Both replace worn flooring — new flooring would improve both resale and rental value ↑
- Both repair and paint basement walls — improving the basement would make it more attractive for potential buyers and renters ↑
ⓘ Cost ranges are severity-bucket heuristics (US national rule-of-thumb). Get contractor quotes + a written scope before underwriting a rehab budget.
Schools (NCES district)
- District
- Hardin County CUSD 1
- NCES district ID
- 1718200
- Math proficiency
- 7% ▼ -6.00%
- Reading proficiency
- 17% ▼ -6.00%
- Median HH income
- $37,617
- Composite
- 10.06/100
- National rank
- #9807
- State rank
- #564 of 620 in IL
Livability — Rosiclare
- Score
- 72/100
- State rank
- #320
- US rank
- #6346
Category grades
Schools grade is shown separately in the Schools card above.
Census & demographics
- Census place
- Rosiclare, IL
- Population (ZIP)
- 1,017
Population outlook (Hardin County) Hauer SSP2
- Today (2025)
- 3,760 people
- By 2030
- 3,548 · -5.6%
- By 2040
- 3,134 · -16.6%
- By 2050
- 2,786 · -25.9%
- By 2075
- 2,118 · -43.7%
- By 2100
- 1,578 · -58.0%
Race, ethnicity, and origin ACS 2023
- Neighborhood character
- Predominantly White (95%)
- Race & ethnicity
- White 95% Hispanic / Latino 3%
- Common ancestry
- Romanian 3% Lithuanian 1% Scotch-Irish 1%
- Foreign-born
- 1% · Canada
- Languages at home
- 98% English-only · Spanish 2%
Political lean MEDSL · Hardin
- 2024 margin
- Solid R (+61.8) · D 18.6% · R 80.3% · Other 1.1%
- 2008→2024 swing
- -42.3pp toward R · 2008: -19.4pp · 2024: -61.8pp
- All cycles
- 2024: R+61.8 2020: R+57.4 2016: R+57.7 2012: R+34.0 2008: R+19.4
Not yet ingested
- Civics
- —
Market trends
- HPI YoY
- —
- Current HPI
- —
- Rent YoY
- —
- Metro
- —
- State GDP YoY
- ▲ 1.59%
- F500 in state
- 60
Industry mix (Fortune 500 HQ in IL)
| Industry | F500 HQs | Revenue |
|---|---|---|
| Insurance | 4 | $201B |
|
||
| Consumer Goods | 4 | $87B |
|
||
| Industrial Machinery | 3 | $64B |
|
||
| Healthcare | 2 | $55B |
|
||
| Retail / Pharmacy | 1 | $148B |
|
||
| Agriculture / Food | 1 | $86B |
|
||
Price history
2 events — show timeline
- 2026-04-20 Listed $49,900 MRED as Distributed by MLS Grid
- 2021-08-06 Listing Removed — RMLSA as Distributed by MLS Grid
Cash-flow waterfall
monthlySold comps — $/sqft
last 12 mo · ≤1 miLoading sold comps…