308 E 13th · Town of Pecos, TX
Flood risk 1/10 · Minimal
- FEMA flood zone
- X
- Chance of flooding over 30 yrs
- 0.0%
- Est. flood insurance / yr
- $507 – $1,088
Fire risk 6/10 · Moderate
- Est. fire insurance / yr
- $1,222 – $2,270
Heat risk 7/10 · Major
- Hot days now (above 105°F)
- 7 days/yr
- Hot days in 30 yrs
- 21 days/yr
Wind risk 1/10 · Minimal
- Chance of severe wind over 30 yrs
- —
Air-quality risk 1/10 · Minimal
- Unhealthy air days now
- 0 days/yr
- Unhealthy air days in 30 yrs
- 0 days/yr
Risk factors via First Street. Map © Google.
Why this score? — see what drove the B grade
The composite is a weighted blend of 9 inputs, each scored 0–100. Each bar is that input's sub-score; the figure is the points it added to the 100-point composite (weight × sub-score).
- Cash flow +30.0/30.0
- 1% rule +10.0/10.0
- DSCR +10.0/10.0
- ARV discount +7.5/15.0
- Appreciation +4.5/10.0
- Rent growth +2.5/5.0
- Schools +2.5/10.0
- Livability +2.5/5.0
- Condition / age +2.5/5.0
$156,000
🖨 Deal sheet (PDF) 📄 Offer letter ✓ Due diligence
Listing remarks
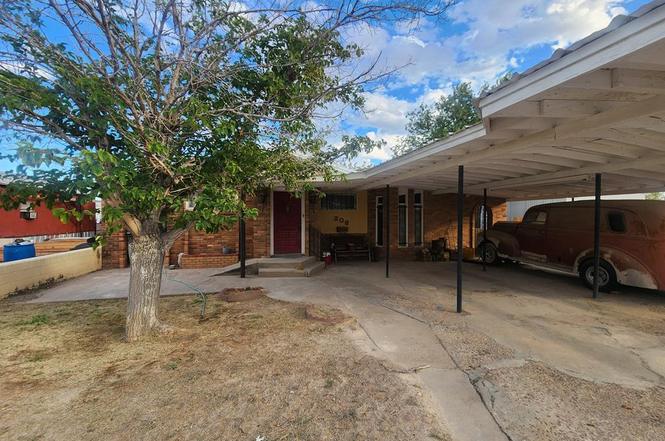
Charming single-family home located east side of town! This 1,000 square foot residence offers a cozy and inviting living space. The property features a practical layout, perfect for those looking for a manageable and comfortable home. While the home needs some TLC, it offers great potential for customization and improvement. This is an excellent opportunity for first-time homebuyers or investors looking to add value. Don't miss the chance to make this home your own!
Key facts
- 5,532 sq ft lot
- Parking
- Built 1960
Property features AI
Exterior
- Parking: Carport (covered parking for 1 vehicle); 1 total parking space
- Utilities: Public water; Public sewer; Propane
- Home design: Single-family residence; Residential property
- Construction: Brick veneer exterior; Metal roof; Slab and pier/pillar foundation; Built with workshop (other structure)
- Exterior features: Patio; Workshop; Paved road access; Solar panels
Interior
- Kitchen: Electric cooktop; Water heater
- Flooring: Carpet; Vinyl
- Bathrooms: 2 full bathrooms
- Heating & cooling: Window air conditioning units; No central heating
- Interior features: Breakfast bar; Blinds
- Laundry & utility: Washer hookup
Neighborhood map
What this means for you Summary
Snapshot
- This is a 3-bed/2.0-bath single-family listed at $156k.
Deal economics
- At list price, monthly cash flow is $1k ($13k/yr) — positive.
- The deal already cash-flows at list — no discount required.
- Meets the 1% rule at list price ($3k rent vs $156k).
- Recommended offer: $137k (12.0% below list) — sets the bar for market timing.
Location & tenants
- Location reads: area grade B — affects rentability + tenant quality, not the cash-flow math above.
- Pecos-Barstow-Toyah ISD (town): math 28% / reading 30% proficiency, ranked #652 of 826 in TX (top 79%) — low school quality limits family demand, transient renter base, plan for 1-2y turnover; 66% free/reduced lunch — lower-income household profile, screen leases tightly.
- Zoned schools: Austin El (math 22% / reading 32%, grade F, #2,791 of 4,322 statewide, top 68%, 644 students, 80% FRL); Crockett Middle (math 30% / reading 29%, grade F, #1,077 of 1,662 statewide, top 66%, 635 students, 77% FRL); Pecos H S (math 12% / reading 25%, grade F, #1,436 of 1,632 statewide, top 88%, 766 students, 54% FRL) — zoned schools at 70% FRL track the district average.
- Market conditions: 92 active listings in the ZIP; 1 comparable units currently listed for rent nearby; 22 units permitted in Reeves County in 2024 (0 in 5+ unit buildings).
Forward outlook
- Local home prices are declining (-1.1%/yr); year-one equity from $1k of loan paydown is wiped out by about $2k of value loss. Plan a longer hold.
- Reeves County population projected at +45% by 2050 — long-run rental-demand tailwind backs the buy-and-hold thesis.
- At projected returns (-1.1% appreciation + 3.0% rent growth), your $44k cash investment doubles in ~4 years — after that, you're playing with house money.
Negotiation context
- It's been on market 583 days — a 12% lower offer ($137k) is reasonable based on typical stale-listing flexibility.
- 2 sale attempts since 2y ago; this cycle's ask has dropped $34k (18%) from the opening price — seller is motivated, your offer sets the floor, not the list.
Risks & watch-outs
- Climate carrying-cost: major wildfire risk; extreme-heat days projected 7→21/yr by 2055 (HVAC capex compounding) — expect insurance premiums to compound above CPI over the hold.
Questions for the listing agent
- It's been on market 583 days. Have you received any prior offers? Is the seller open to a 12% concession, seller financing, or rate buy-down credit?
- Built in 1960 — when were the roof, HVAC, electrical panel, plumbing, and water heater last replaced?
- Why hasn't it sold? Are there any deal-killer items the seller is aware of (foundation, flood, title, zoning, code violations)?
- Is there a deadline driving the sale (1031 exchange, divorce, estate, relocation)? That informs how much negotiation room exists.
- What's the average days-on-market for RENTAL listings here right now (not sales)? A rising rental-DOM trend means longer vacancies and softer asking-rent achievability than the comps imply.
- What's the recent tenant-quality profile in this submarket — average credit score on applications, eviction rate, late-payment / NSF rate, and stable-employment percentage? A property-management company in the area should have these aggregated.
- How much new for-sale + rental construction is in the pipeline within 1–3 miles? Heavy new supply typically softens prices + rents 12–24 months out; constrained supply supports both.
Investment metrics
- 1% rule
- 1.79% ✓
- Cap rate
- 14.92%
- Cash-on-cash
- 30.80%
- DSCR
- 2.37
- GRM
- 4.6
CMA / ARV
No comps found within radius.
Projected returns pro-forma
-1.09% appreciation · 3.0% rent growth · sell at horizon
- IRR
- 29.3%
- Equity multiple
- 2.35×
- Total profit
- $59,082
- Equity at exit
- $36,991
- IRR
- 34.3%
- Equity multiple
- 4.56×
- Total profit
- $155,660
- Equity at exit
- $38,279
Cash invested: $43,680 (down + closing). Projections, not guarantees.
Landlord ↔ Tenant lean methodology
- Overall (STATE)
- 87 Strongly Landlord-Friendly
- State Texas
- 87 Strongly Landlord-Friendly · R+5
- County
- — inherits STATE
- City
- — inherits STATE
ZIP-level market 79772
- Home prices YoY
- -0.7%
- Active inventory
- 92
- Price-to-rent
- 4.6×
Monthly cashflow live
- Estimated rent
- $2,800 medium interval (Pro) →
- Mortgage (P&I)
- −$818
- Tax from tax record
- −$208 /mo · $2,494/yr
- Insurance
- −$65
- HOA
- −$0
- Vacancy / Maint / Mgmt
- −$588
- Net cashflow
- $1,121
Break-even live
Sensitivity live
| Price | -10% $1,209 | -5% $1,165 | +0% $1,121 | +5% $1,077 | +10% $1,033 |
|---|---|---|---|---|---|
| Rent | -10% $900 | -5% $1,011 | +0% $1,121 | +5% $1,232 | +10% $1,342 |
| Rate | -1.0pp $1,200 | -0.5pp $1,161 | base $1,121 | +0.5pp $1,081 | +1.0pp $1,040 |
UW: 25.0% down · 7.5% · 30yr · 1.5% tax · 5.0% vac · 8.0% maint · 8.0% mgmt
Financing live
Cash to close
- Down payment
- $39,000
- Closing costs
- $4,680
- Reserves months
- —
- Total cash needed
- —
Loan-product check · same deal, 3 products live
Conventional
25% down · 7.5% · 30yr
- Down + closing
- —
- Monthly P&I
- —
- Monthly cashflow
- —
- DSCR
- —
- Eligible?
- —
Personal DTI + credit; lowest rate.
DSCR
20% down · 8.5% · 30yr
- Down + closing
- —
- Monthly P&I
- —
- Monthly cashflow
- —
- DSCR
- —
- Eligible?
- —
No personal income docs; deal must DSCR.
Hard money
10% down · 12.0% · 12mo
- Down + closing
- —
- Monthly P&I
- —
- Monthly cashflow
- —
- DSCR
- —
- Eligible?
- —
Short-term bridge; refi at stabilization.
Rent comps 1 comps
| Address | Beds | Baths | Sqft | Rent | $/sqft | DOM | Units | Dist |
|---|---|---|---|---|---|---|---|---|
| 1523 Mimosa St Pecos, TX | 3.0 | 2.0 | 2206 | $2,800 | $1.27 | 45d | 1 | 0.69mi |
Listing history 17 events
-
2026-06-21days on market $156,000 Active 583 DOM
-
2026-06-21days on market $156,000 Active 582 DOM
-
2026-06-18days on market $156,000 Active 580 DOM
-
2026-06-17days on market $156,000 Active 579 DOM
-
2026-06-16days on market $156,000 Active 578 DOM
-
2026-06-15days on market $156,000 Active 577 DOM
-
2026-06-15days on market $156,000 Active 576 DOM
-
2026-06-13days on market $156,000 Active 575 DOM
-
2026-06-12days on market $156,000 Active 574 DOM
-
2026-06-10days on market $156,000 Active 571 DOM
-
2026-06-08days on market $156,000 Active 570 DOM
-
2026-06-08days on market $156,000 Active 569 DOM
-
2026-06-07days on market $156,000 Active 568 DOM
-
2026-06-03days on market $156,000 Active 565 DOM
-
2026-06-02days on market $156,000 Active 564 DOM
-
2026-06-01days on market $156,000 Active 563 DOM
-
2026-05-31days on market $156,000 Active 562 DOM
ⓘ Source: listings_history table (triggers on properties + properties_extension) + one-shot
backfill from property_details.listing_events for pre-trigger history.
Tax reassessment forecast TX · Resets to sale price
- Current annual tax
- $2,494 · $208/mo
- Projected year-2 tax
- $2,855 · $238/mo
- Expected delta
- +$361/yr (+$30/mo · 14.5%)
ⓘ Screening estimate from a state-policy table — verify with the county assessor before closing.
Climate risk First Street
- Flood 1/10 Low FEMA zone X · 0% chance over 30 yrs
- Wildfire 6/10 Major
- Heat 7/10 Severe 7 d/yr ≥105°F today · 21 d/yr by 30 yrs out
- Wind 1/10 Low
- Air quality 1/10 Low 0 unhealthy d/yr today · 0 by 30 yrs out
Nearby sold comps map
Loading sold comps map…
Walkable amenities ~0.75 mi
Loading nearby amenities…
Taxation est. · year 1
- Rental income
- $33,600
- − Mortgage interest
- −$8,738
- − Property taxes
- −$2,494
- − Insurance
- −$780
- − Repairs & maintenance
- −$2,688
- − Management
- −$2,688
- − Depreciation
- −$4,538
- Taxable income
- $11,674
- Est. tax owed @ 24.0%
- −$2,802
- After-tax cash flow
- $10,652/yr
For passive investors: Depreciation is non-cash, so a rental often shows a tax loss while cash-flowing — sheltering income. Rental losses are passive: they offset passive income freely, and up to $25,000/yr can offset ordinary (W-2) income if you actively participate and your MAGI is under $100k (phasing out to $0 by $150k); unused losses carry forward. On sale, claimed depreciation is recaptured at up to 25%, and gains may owe capital-gains tax (a 1031 exchange can defer both). Figures are a year-1 estimate at your 24.0% rate — not tax advice; consult a CPA.
Schools (NCES district)
- District
- Pecos-Barstow-Toyah ISD
- NCES district ID
- 4834550
- Math proficiency
- 28% ▼ -7.00%
- Reading proficiency
- 30% ▲ 1.00%
- Median HH income
- $41,982
- Composite
- 24.61/100
- National rank
- #7632
- State rank
- #652 of 826 in TX
Livability — Town of Pecos
No livability data for this city. (Only ~50 U.S. cities are tracked.)
Census & demographics
- Census place
- Town of Pecos, TX
- City population
- 12,547
- Population (ZIP)
- 12,547
Population outlook (Reeves County) Hauer SSP2
- Today (2025)
- 17,069 people
- By 2030
- 18,407 · +7.8%
- By 2040
- 21,342 · +25.0%
- By 2050
- 24,701 · +44.7%
- By 2075
- 32,688 · +91.5%
- By 2100
- 36,117 · +111.6%
Race, ethnicity, and origin ACS 2023
- Neighborhood character
- Predominantly Hispanic (85%)
- Race & ethnicity
- Hispanic / Latino 85% Two or more races 22% White 12% Black 2% Native American 1%
- Hispanic origin (detail)
- Mexican 78%
- Common ancestry
- Iranian 1% Serbian 1%
- Foreign-born
- 19% · Canada
- Languages at home
- 38% English-only · Spanish 62%
Political lean MEDSL · Reeves
- 2024 margin
- Solid R (+36.9) · D 31.1% · R 68.0%
- 2008→2024 swing
- -42.2pp toward R · 2008: 5.2pp · 2024: -36.9pp
- All cycles
- 2024: R+36.9 2020: R+23.3 2016: D+7.6 2012: D+16.2 2008: D+5.2
Not yet ingested
- Civics
- —
Market trends
- HPI YoY
- ▼ -1.09%
- Current HPI
- 147.9377
- Rent YoY
- —
- Metro
- —
- State GDP YoY
- ▲ 3.95%
- F500 in state
- 110
Industry mix (Fortune 500 HQ in TX)
| Industry | F500 HQs | Revenue |
|---|---|---|
| Energy | 16 | $1,198B |
|
||
| Technology | 5 | $198B |
|
||
| Engineering / Construction | 4 | $72B |
|
||
| Energy Services | 3 | $60B |
|
||
| Utilities | 3 | $41B |
|
||
| Healthcare | 2 | $330B |
|
||
Price history
-17.9% since first listed8 events — show timeline
- 2026-05-28 Relisted — ODMLS
- 2026-05-28 Price Changed $156,000 ODMLS
- 2026-03-01 Delisted — ODMLS
- 2025-09-19 Price Changed $170,000 ODMLS
- 2025-06-12 Price Changed $178,000 ODMLS
- 2024-11-15 Price Changed $185,000 ODMLS
- 2024-08-20 Listed $190,000 ODMLS
- 2018-12-28 Sold (Public Records) — Public Records
Property tax history
+6.2%/yrLatest (2025): $2,494 · +25.9% YoY. Source: county tax records.
Cash-flow waterfall
monthlySold comps — $/sqft
last 12 mo · ≤1 miLoading sold comps…