 🏷️ Likely Rental
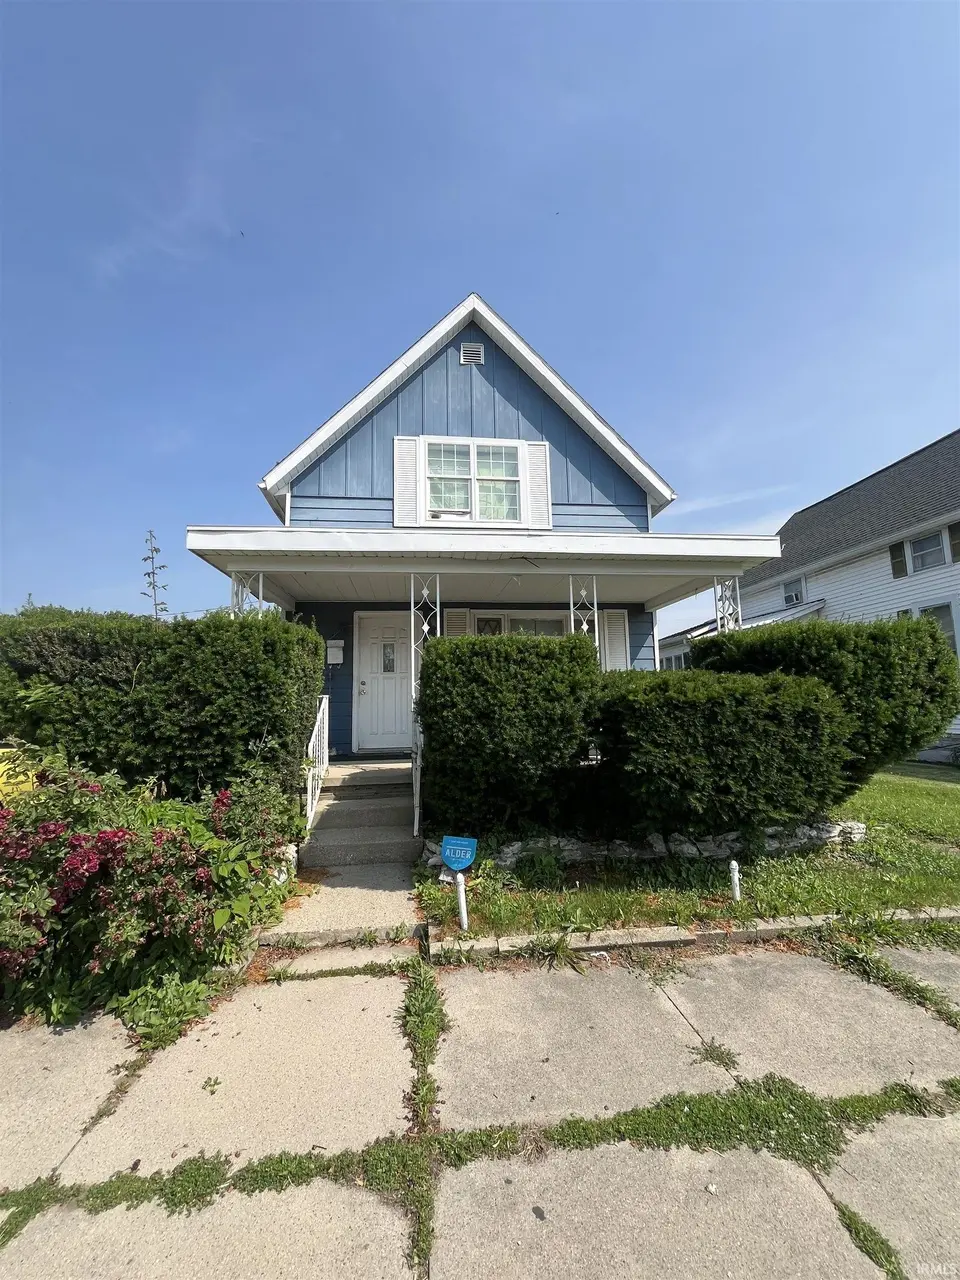
320 E Main St · Peru, IN
Flood risk 5/10 · Moderate
- FEMA flood zone
- X (shaded)
- Chance of flooding over 30 yrs
- 0.27%
- Est. flood insurance / yr
- $473 – $860
Fire risk 1/10 · Minimal
- Est. fire insurance / yr
- $717 – $1,331
Heat risk 3/10 · Minor
- Hot days now (above 102°F)
- 7 days/yr
- Hot days in 30 yrs
- 16 days/yr
Wind risk 2/10 · Minimal
- Chance of severe wind over 30 yrs
- —
Air-quality risk 2/10 · Minimal
- Unhealthy air days now
- 1 days/yr
- Unhealthy air days in 30 yrs
- 2 days/yr
Risk factors via First Street. Map © Google.
Why this score? — see what drove the B+ grade
The composite is a weighted blend of 9 inputs, each scored 0–100. Each bar is that input's sub-score; the figure is the points it added to the 100-point composite (weight × sub-score).
- Cash flow +30.0/30.0
- ARV discount +15.0/15.0
- 1% rule +10.0/10.0
- DSCR +10.0/10.0
- Livability +3.9/5.0
- Schools +3.0/10.0
- Rent growth +2.5/5.0
- Condition / age +2.5/5.0
- Appreciation +0.0/10.0
$64,995
🖨 Deal sheet 📄 Offer letter ✓ Due diligence
Listing remarks MLS
Here's what we know. .. this house has three bedrooms, one bath, detached one car garage, covered porch and it's blue. This is a project opportunity. We will do our best to get you inside the home, but we do not have inside photos at this time as it is tenant occupied and we are respecting the tenant rights by not posting inside photos. All showings will require a 48 hours notice and we will do our best to notify the tenant to get you inside access.
Key facts
- Covered porch
- 4,792 sq ft lot
- Garage
Tags
Neighborhood map
What this means for you Summary
Snapshot
- This is a 3-bed/1.5-bath single-family listed at $65k.
Deal economics
- At list price, monthly cash flow is $537 ($6k/yr) — positive.
- The deal already cash-flows at list — no discount required.
- Meets the 1% rule at list price ($1k rent vs $65k).
- Recommended offer: $57k (12.0% below list) — sets the bar for market timing.
- Cap rate 16.2% vs local median 6.1% in Peru — top-decile yield for the area; either an underpriced asset or a hidden risk that comps aren't pricing in. Stress-test before assuming the spread holds.
Location & tenants
- Location reads 77/100 on livability (#35 in IN, #2,834 nationally) — a middle-class / working-renter tenant base. Strengths: amenities A+, cost of living A+, housing A+; Watch: crime D+, schools D, commute F.
- Peru Community Schools (town): math 31% / reading 42% proficiency, ranked #192 of 301 in IN (top 64%) — families likely to look elsewhere, expect single-tenant / working-renter base with shorter leases.
- Market conditions: 129 active listings in the ZIP; 35 units permitted in Miami County in 2024 (0 in 5+ unit buildings).
Forward outlook
- Local home prices are declining (-3.0%/yr); year-one equity from $449 of loan paydown is wiped out by about $2k of value loss. Plan a longer hold.
- Miami County population projected at -12% by 2050 — secular population decline; favor cash flow + early exit over multi-decade hold.
- At projected returns (-3.0% appreciation + 3.0% rent growth), your $18k cash investment doubles in ~4 years — after that, you're playing with house money.
Negotiation context
- It's been on market 365 days — a 12% lower offer ($57k) is reasonable based on typical stale-listing flexibility.
Risks & watch-outs
- Watch-outs: built in 1900 — expect roof / HVAC / electrical / plumbing capex.
- Climate carrying-cost: moderate flood risk — expect insurance premiums to compound above CPI over the hold.
Questions for the listing agent
- It's been on market 365 days. Have you received any prior offers? Is the seller open to a 12% concession, seller financing, or rate buy-down credit?
- Built in 1900 — when were the roof, HVAC, electrical panel, plumbing, and water heater last replaced?
- Why hasn't it sold? Are there any deal-killer items the seller is aware of (foundation, flood, title, zoning, code violations)?
- Is there a deadline driving the sale (1031 exchange, divorce, estate, relocation)? That informs how much negotiation room exists.
- Schools are D-rated, which usually means shorter tenancies and higher turnover. Who's the typical renter profile here, and what's been the actual vacancy rate?
- Crime grade is D in this area — have there been break-ins, vandalism, or insurance claims at this property in the last 3 years? What carrier currently insures it and at what premium?
- What's the average days-on-market for RENTAL listings here right now (not sales)? A rising rental-DOM trend means longer vacancies and softer asking-rent achievability than the comps imply.
- What's the recent tenant-quality profile in this submarket — average credit score on applications, eviction rate, late-payment / NSF rate, and stable-employment percentage? A property-management company in the area should have these aggregated.
- How much new for-sale + rental construction is in the pipeline within 1–3 miles? Heavy new supply typically softens prices + rents 12–24 months out; constrained supply supports both.
Investment metrics
- 1% rule
- 1.92% ✓
- Cap rate
- 16.20%
- Cash-on-cash
- 35.38%
- DSCR
- 2.57
- GRM
- 4.3
CMA / ARV
- ARV (median comp)
- $123,662
- List price
- $64,995
- Delta
- -47.44%
- Verdict
- UNDERPRICED
- Comps
- 20 within 1.0 mi
Show comp detail 12 sales within ~0.75 mi
| Address | Dist | Beds/Ba | Sqft | Sold | Price | $/sf | Match |
|---|---|---|---|---|---|---|---|
| 374 E Main St | 0.10mi | 3/1.0 | 1,540 (+4%) | 7mo | $100,000 | $65 | 82 |
| 276 E 3rd St | 0.11mi | 3/1.5 | 1,584 (+7%) | 10mo | $185,000 | $117 | 75 |
| 401 E Main St | 0.14mi | 2/1.0 (-1) | 1,594 (+7%) | 5mo | $170,000 | $107 | 70 |
| 310 Columbia Ave | 0.35mi | 3/2.0 | 1,312 (-12%) | 0mo | $159,900 | $122 | 62 |
| 269 E 8th St | 0.20mi | 3/2.0 | 1,306 (-12%) | 10mo | $184,900 | $142 | 61 |
| 16 S Tippecanoe St | 0.25mi | 3/1.0 | 1,295 (-13%) | 5mo | $60,000 | $46 | 61 |
| 119 Daniel St | 0.44mi | 3/2.0 | 1,422 (-4%) | 13mo | $157,500 | $111 | 60 |
| 565 E 2nd St | 0.55mi | 3/2.0 | 1,612 (+9%) | 6mo | $195,000 | $121 | 53 |
| 126 E 8th St | 0.40mi | 3/1.0 | 1,296 (-13%) | 8mo | $139,900 | $108 | 51 |
| 568 Madison Ave | 0.70mi | 2/1.5 (-1) | 1,510 (+2%) | 13mo | $163,000 | $108 | 49 |
| 135 E 3rd St | 0.34mi | 2/1.0 (-1) | 1,673 (+13%) | 12mo | $83,000 | $50 | 45 |
| 63 W 6th St | 0.73mi | 3/1.5 | 1,362 (-8%) | 10mo | $55,000 | $40 | 44 |
Match score weights: distance 35% · size 25% · config 20% · recency 20%. Top-matched comps best support the ARV.
Projected returns pro-forma
-3.0% appreciation · 3.0% rent growth · sell at horizon
- IRR
- 31.0%
- Equity multiple
- 2.30×
- Total profit
- $23,657
- Equity at exit
- $9,691
- IRR
- 38.2%
- Equity multiple
- 4.55×
- Total profit
- $64,676
- Equity at exit
- $5,620
Cash invested: $18,199 (down + closing). Projections, not guarantees.
Landlord ↔ Tenant lean methodology
- Overall (STATE)
- 90 Strongly Landlord-Friendly
- State Indiana
- 90 Strongly Landlord-Friendly · R+11
- County
- — inherits STATE
- City
- — inherits STATE
ZIP-level market 46970
- Home prices YoY
- -8.8%
- Active inventory
- 129
- Price-to-rent
- 4.3×
Monthly cashflow live
- Estimated rent
- $1,248 medium interval (Pro) →
- Mortgage (P&I)
- −$341
- Tax est. 1.5%
- −$81 /mo · $975/yr
- Insurance
- −$27
- HOA
- −$0
- Vacancy / Maint / Mgmt
- −$262
- Net cashflow
- $537
Break-even live
UW: 25.0% down · 7.5% · 30yr · 1.5% tax · 5.0% vac · 8.0% maint · 8.0% mgmt
Financing live
Cash to close
- Down payment
- $16,249
- Closing costs
- $1,950
- Reserves months
- —
- Total cash needed
- —
Loan-product check · same deal, 3 products live
Conventional
25% down · 7.5% · 30yr
- Down + closing
- —
- Monthly P&I
- —
- Monthly cashflow
- —
- DSCR
- —
- Eligible?
- —
Personal DTI + credit; lowest rate.
DSCR
20% down · 8.5% · 30yr
- Down + closing
- —
- Monthly P&I
- —
- Monthly cashflow
- —
- DSCR
- —
- Eligible?
- —
No personal income docs; deal must DSCR.
Hard money
10% down · 12.0% · 12mo
- Down + closing
- —
- Monthly P&I
- —
- Monthly cashflow
- —
- DSCR
- —
- Eligible?
- —
Short-term bridge; refi at stabilization.
Listing history 16 events
-
2026-06-18days on market $64,995 Active 365 DOM
-
2026-06-17days on market $64,995 Active 364 DOM
-
2026-06-16days on market $64,995 Active 363 DOM
-
2026-06-15days on market $64,995 Active 362 DOM
-
2026-06-14days on market $64,995 Active 360 DOM
-
2026-06-12days on market $64,995 Active 359 DOM
-
2026-06-09days on market $64,995 Active 356 DOM
-
2026-06-08days on market $64,995 Active 355 DOM
-
2026-06-07days on market $64,995 Active 354 DOM
-
2026-06-07days on market $64,995 Active 353 DOM
-
2026-06-03days on market $64,995 Active 350 DOM
-
2026-06-02days on market $64,995 Active 349 DOM
-
2026-06-01days on market $64,995 Active 348 DOM
-
2026-05-31days on market $64,995 Active 347 DOM
-
2026-05-31days on market $64,995 Active 346 DOM
-
2025-06-18$64,995 Active 453-char remark
Show marketing remark (453 chars)
Here's what we know. .. this house has three bedrooms, one bath, detached one car garage, covered porch and it's blue. This is a project opportunity. We will do our best to get you inside the home, but we do not have inside photos at this time as it is tenant occupied and we are respecting the tenant rights by not posting inside photos. All showings will require a 48 hours notice and we will do our best to notify the tenant to get you inside access.
ⓘ Source: listings_history table (triggers on properties + properties_extension) + one-shot
backfill from property_details.listing_events for pre-trigger history.
Climate risk First Street
- Flood 5/10 Major FEMA zone X (shaded) · 27% chance over 30 yrs
- Wildfire 1/10 Low
- Heat 3/10 Moderate 7 d/yr ≥102°F today · 16 d/yr by 30 yrs out
- Wind 2/10 Low
- Air quality 2/10 Low 1 unhealthy d/yr today · 2 by 30 yrs out
Nearby sold comps map
Loading sold comps map…
Walkable amenities ~0.75 mi
Loading nearby amenities…
Taxation est. · year 1
- Rental income
- $14,972
- − Mortgage interest
- −$3,641
- − Property taxes
- −$975
- − Insurance
- −$325
- − Repairs & maintenance
- −$1,198
- − Management
- −$1,198
- − Depreciation
- −$1,891
- Taxable income
- $5,745
- Est. tax owed @ 24.0%
- −$1,379
- After-tax cash flow
- $5,059/yr
For passive investors: Depreciation is non-cash, so a rental often shows a tax loss while cash-flowing — sheltering income. Rental losses are passive: they offset passive income freely, and up to $25,000/yr can offset ordinary (W-2) income if you actively participate and your MAGI is under $100k (phasing out to $0 by $150k); unused losses carry forward. On sale, claimed depreciation is recaptured at up to 25%, and gains may owe capital-gains tax (a 1031 exchange can defer both). Figures are a year-1 estimate at your 24.0% rate — not tax advice; consult a CPA.
Schools (NCES district)
- District
- Peru Community Schools
- NCES district ID
- 1808850
- Math proficiency
- 31% ▼ -9.00%
- Reading proficiency
- 42% ▼ -2.00%
- Median HH income
- $35,624
- Composite
- 30.18/100
- National rank
- #6316
- State rank
- #192 of 301 in IN
Livability — Peru
- Score
- 77/100
- State rank
- #35
- US rank
- #2834
Category grades
Schools grade is shown separately in the Schools card above.
Census & demographics
- Census place
- Peru, IN
- County
- Miami County · 23,020 people
- City population
- 23,020
- Metro
- Peru, IN
- Population (ZIP)
- 23,020
- Household income
- $57,842
- Rent vs Own
- Severe rent burden
- 498.0
Population outlook (Miami County) Hauer SSP2
- Today (2025)
- 34,421 people
- By 2030
- 33,571 · -2.5%
- By 2040
- 31,919 · -7.3%
- By 2050
- 30,313 · -11.9%
- By 2075
- 26,202 · -23.9%
- By 2100
- 20,856 · -39.4%
Race, ethnicity, and origin ACS 2023
- Neighborhood character
- Predominantly White (87%)
- Race & ethnicity
- White 87% Two or more races 6% Hispanic / Latino 4% Black 3%
- Common ancestry
- Iranian 2% Romanian 2% Slovak 2%
- Foreign-born
- 1% · Canada
- Languages at home
- 97% English-only · Spanish 2% German/W. Germanic 0%
Political lean MEDSL · Miami
- 2024 margin
- Solid R (+54.5) · D 21.8% · R 76.3% · Other 1.9%
- 2008→2024 swing
- -35.1pp toward R · 2008: -19.5pp · 2024: -54.5pp
- All cycles
- 2024: R+54.5 2020: R+53.1 2016: R+53.6 2012: R+30.9 2008: R+19.5
Not yet ingested
- Civics
- —
Market trends
- HPI YoY
- ▼ -24.29%
- Current HPI
- 252.7166
- Rent YoY
- —
- Metro
- Peru, IN
- State GDP YoY
- ▲ 2.90%
- F500 in state
- 18
Industry mix (Fortune 500 HQ in IN)
| Industry | F500 HQs | Revenue |
|---|---|---|
| Industrial Machinery | 2 | $37B |
|
||
| Healthcare | 1 | $177B |
|
||
| Pharmaceuticals | 1 | $45B |
|
||
| Metals / Steel | 1 | $18B |
|
||
| Agriculture | 1 | $17B |
|
||
| Packaging | 1 | $12B |
|
||
Price history
1 event — show timeline
- 2025-06-18 Listed $64,995 IRMLS
Cash-flow waterfall
monthlySold comps — $/sqft
last 12 mo · ≤1 miLoading sold comps…