701 S 9th St · Thayer, MO
Flood risk 1/10 · Minimal
- FEMA flood zone
- X (unshaded)
- Chance of flooding over 30 yrs
- 0.0%
- Est. flood insurance / yr
- $507 – $1,088
Fire risk 5/10 · Moderate
- Est. fire insurance / yr
- $1,054 – $1,958
Heat risk 6/10 · Moderate
- Hot days now (above 108°F)
- 7 days/yr
- Hot days in 30 yrs
- 21 days/yr
Wind risk 2/10 · Minimal
- Chance of severe wind over 30 yrs
- 3.0%
Air-quality risk 1/10 · Minimal
- Unhealthy air days now
- 0 days/yr
- Unhealthy air days in 30 yrs
- 0 days/yr
Risk factors via First Street. Map © Google.
Why this score? — see what drove the B- grade
The composite is a weighted blend of 9 inputs, each scored 0–100. Each bar is that input's sub-score; the figure is the points it added to the 100-point composite (weight × sub-score).
- Cash flow +30.0/30.0
- DSCR +10.0/10.0
- 1% rule +8.0/10.0
- ARV discount +7.5/15.0
- Schools +4.2/10.0
- Livability +3.0/5.0
- Rent growth +2.5/5.0
- Condition / age +2.5/5.0
- Appreciation +0.0/10.0
$77,500
🖨 Deal sheet (PDF) 📄 Offer letter ✓ Due diligence
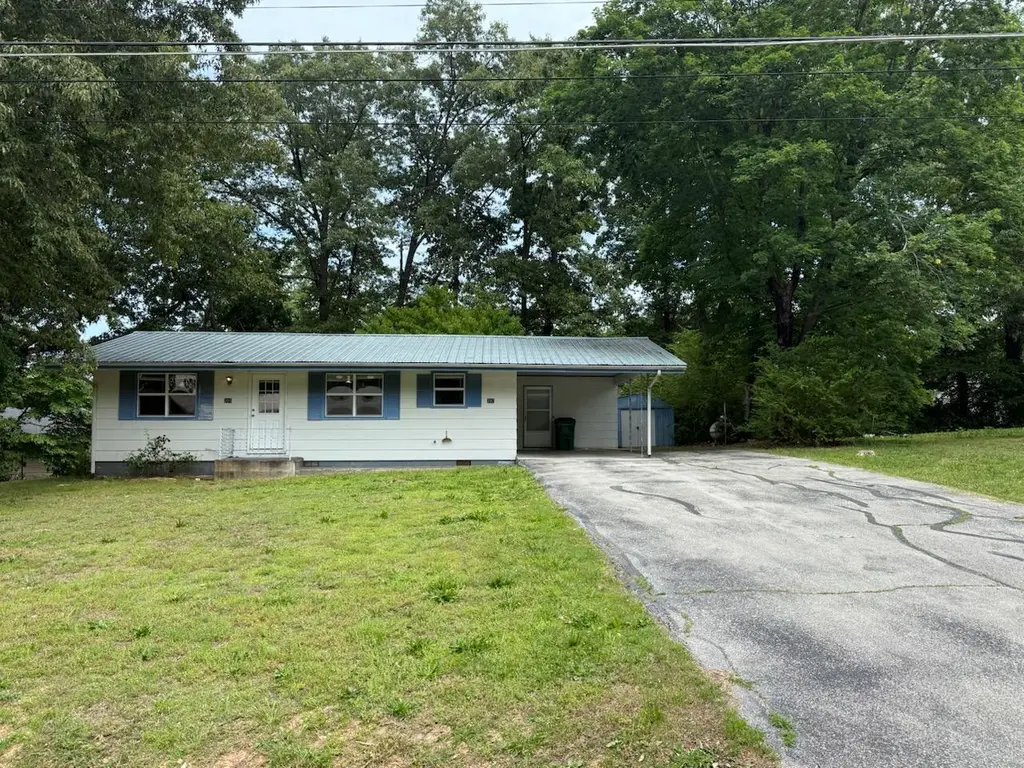
Listing remarks
Neat, clean & move in ready! Check out this newly listed home with new carpet, metal roof, vinyl thermal pane windows, and central heat & air! Home sits on nice level lot with paved driveway and storage shed with cement floor in the back yard! Call today for more information!
Key facts
- Central heat
- Metal roof
- New carpet
Tags
Property features AI
Exterior
- Parking: 1-car garage
- Utilities: Public water; Public sewer; Propane service
- Home design: Single-family residence; One story
- Construction: Frame construction; Metal roof
- Exterior features: Level lot; Publicly maintained asphalt roads; City street frontage; Shed(s)
Interior
- Kitchen: Electric oven; Free-standing electric oven; Dishwasher; Refrigerator
- Bedrooms: Bedrooms on main level
- Flooring: Carpet
- Bathrooms: 1 full bathroom
- Heating & cooling: Central heating (electric); Ceiling fan(s)
- Interior features: Insulated double-pane windows; Carpet flooring
- Laundry & utility: Laundry on main level
Neighborhood map
What this means for you Summary
Snapshot
- This is a 3-bed/1.0-bath other listed at $78k.
Deal economics
- At list price, monthly cash flow is $324 ($4k/yr) — positive.
- The deal already cash-flows at list — no discount required.
- Meets the 1% rule at list price ($1k rent vs $78k).
- Recommended offer: $76k (1.5% below list) — sets the bar for market timing.
- Cap rate 11.3% vs local median 4.1% in Thayer — top-decile yield for the area; either an underpriced asset or a hidden risk that comps aren't pricing in. Stress-test before assuming the spread holds.
Location & tenants
- Location reads 59/100 on livability (#530 in MO) — a working-class tenant base; expect higher turnover. Strengths: crime A+, cost of living A+, housing A+; Watch: amenities F, commute F, employment F.
- Thayer R-II (rural): math 51% / reading 52% proficiency, ranked #42 of 324 in MO (top 13%) — acceptable for families but not a draw, mixed tenant base, ~2y average lease.
- Zoned schools: Thayer Elem. (math 62% / reading 57%, grade B-, #124 of 1,115 statewide, top 13%, 419 students, 62% FRL); Thayer Sr. High (math 42% / reading 47%, grade F, #179 of 521 statewide, top 39%, 343 students, 50% FRL).
- Market conditions: 59 active listings in the ZIP; 5 units permitted in Oregon County in 2024 (0 in 5+ unit buildings).
Forward outlook
- Local home prices are declining (-3.0%/yr); year-one equity from $536 of loan paydown is wiped out by about $2k of value loss. Plan a longer hold.
- Oregon County population projected at -12% by 2050 — secular population decline; favor cash flow + early exit over multi-decade hold.
- At projected returns (-3.0% appreciation + 3.0% rent growth), your $22k cash investment doubles in ~7 years — after that, you're playing with house money.
Negotiation context
- It's been on market 16 days — a 2% lower offer ($76k) is reasonable based on typical stale-listing flexibility.
Risks & watch-outs
- Climate carrying-cost: moderate wildfire risk; extreme-heat days projected 7→21/yr by 2055 (HVAC capex compounding) — expect insurance premiums to compound above CPI over the hold.
Questions for the listing agent
- Is there a deadline driving the sale (1031 exchange, divorce, estate, relocation)? That informs how much negotiation room exists.
- What's the average days-on-market for RENTAL listings here right now (not sales)? A rising rental-DOM trend means longer vacancies and softer asking-rent achievability than the comps imply.
- What's the recent tenant-quality profile in this submarket — average credit score on applications, eviction rate, late-payment / NSF rate, and stable-employment percentage? A property-management company in the area should have these aggregated.
- How much new for-sale + rental construction is in the pipeline within 1–3 miles? Heavy new supply typically softens prices + rents 12–24 months out; constrained supply supports both.
Investment metrics
- 1% rule
- 1.30% ✓
- Cap rate
- 11.31%
- Cash-on-cash
- 17.92%
- DSCR
- 1.80
- GRM
- 6.4
CMA / ARV
No comps found within radius.
Projected returns pro-forma
-3.0% appreciation · 3.0% rent growth · sell at horizon
- IRR
- 9.4%
- Equity multiple
- 1.37×
- Total profit
- $8,054
- Equity at exit
- $11,556
- IRR
- 18.6%
- Equity multiple
- 2.54×
- Total profit
- $33,485
- Equity at exit
- $6,701
Cash invested: $21,700 (down + closing). Projections, not guarantees.
Landlord ↔ Tenant lean methodology
- Overall (STATE)
- 81 Strongly Landlord-Friendly
- State Missouri
- 81 Strongly Landlord-Friendly · R+10
- County
- — inherits STATE
- City
- — inherits STATE
ZIP-level market 65791
- Home prices YoY
- -10.5%
- Active inventory
- 59
- Price-to-rent
- 6.4×
Monthly cashflow live
- Estimated rent
- $1,004 medium interval (Pro) →
- Mortgage (P&I)
- −$406
- Tax from tax record
- −$31 /mo · $368/yr
- Insurance
- −$32
- HOA
- −$0
- Vacancy / Maint / Mgmt
- −$211
- Net cashflow
- $324
Break-even live
Sensitivity live
| Price | -10% $368 | -5% $346 | +0% $324 | +5% $302 | +10% $280 |
|---|---|---|---|---|---|
| Rent | -10% $245 | -5% $284 | +0% $324 | +5% $364 | +10% $403 |
| Rate | -1.0pp $363 | -0.5pp $344 | base $324 | +0.5pp $304 | +1.0pp $284 |
UW: 25.0% down · 7.5% · 30yr · 1.5% tax · 5.0% vac · 8.0% maint · 8.0% mgmt
Financing live
Cash to close
- Down payment
- $19,375
- Closing costs
- $2,325
- Reserves months
- —
- Total cash needed
- —
Loan-product check · same deal, 3 products live
Conventional
25% down · 7.5% · 30yr
- Down + closing
- —
- Monthly P&I
- —
- Monthly cashflow
- —
- DSCR
- —
- Eligible?
- —
Personal DTI + credit; lowest rate.
DSCR
20% down · 8.5% · 30yr
- Down + closing
- —
- Monthly P&I
- —
- Monthly cashflow
- —
- DSCR
- —
- Eligible?
- —
No personal income docs; deal must DSCR.
Hard money
10% down · 12.0% · 12mo
- Down + closing
- —
- Monthly P&I
- —
- Monthly cashflow
- —
- DSCR
- —
- Eligible?
- —
Short-term bridge; refi at stabilization.
Listing history 13 events
-
2026-06-22days on market $77,500 Active 16 DOM
-
2026-06-21days on market $77,500 Active 15 DOM
-
2026-06-21days on market $77,500 Active 14 DOM
-
2026-06-18days on market $77,500 Active 12 DOM
-
2026-06-17days on market $77,500 Active 11 DOM
-
2026-06-16days on market $77,500 Active 10 DOM
-
2026-06-15days on market $77,500 Active 9 DOM
-
2026-06-13days on market $77,500 Active 7 DOM
-
2026-06-12days on market $77,500 Active 6 DOM
-
2026-06-09days on market $77,500 Active 3 DOM
-
2026-06-09status $77,500 Active 2 DOM
-
2026-05-29status Pending
-
2026-05-27$77,500 Active
ⓘ Source: listings_history table (triggers on properties + properties_extension) + one-shot
backfill from property_details.listing_events for pre-trigger history.
Tax reassessment forecast MO · Resets to sale price
- Current annual tax
- $368 · $31/mo
- Projected year-2 tax
- $752 · $63/mo
- Expected delta
- +$384/yr (+$32/mo · 104.2%)
ⓘ Screening estimate from a state-policy table — verify with the county assessor before closing.
Climate risk First Street
- Flood 1/10 Low FEMA zone X (unshaded) · 0% chance over 30 yrs
- Wildfire 5/10 Major
- Heat 6/10 Major 7 d/yr ≥108°F today · 21 d/yr by 30 yrs out
- Wind 2/10 Low 3% chance of damaging wind over 30 yrs
- Air quality 1/10 Low 0 unhealthy d/yr today · 0 by 30 yrs out
Nearby sold comps map
Loading sold comps map…
Walkable amenities ~0.75 mi
Loading nearby amenities…
Taxation est. · year 1
- Rental income
- $12,052
- − Mortgage interest
- −$4,341
- − Property taxes
- −$368
- − Insurance
- −$388
- − Repairs & maintenance
- −$964
- − Management
- −$964
- − Depreciation
- −$2,255
- Taxable income
- $2,772
- Est. tax owed @ 24.0%
- −$665
- After-tax cash flow
- $3,223/yr
For passive investors: Depreciation is non-cash, so a rental often shows a tax loss while cash-flowing — sheltering income. Rental losses are passive: they offset passive income freely, and up to $25,000/yr can offset ordinary (W-2) income if you actively participate and your MAGI is under $100k (phasing out to $0 by $150k); unused losses carry forward. On sale, claimed depreciation is recaptured at up to 25%, and gains may owe capital-gains tax (a 1031 exchange can defer both). Figures are a year-1 estimate at your 24.0% rate — not tax advice; consult a CPA.
Schools (NCES district)
- District
- Thayer R-II
- NCES district ID
- 2930270
- Math proficiency
- 51% ▼ -8.00%
- Reading proficiency
- 52% ▼ -6.00%
- Median HH income
- $31,092
- Composite
- 42.22/100
- National rank
- #3284
- State rank
- #42 of 324 in MO
Livability — Thayer
- Score
- 59/100
- State rank
- #530
- US rank
- #19863
Category grades
Schools grade is shown separately in the Schools card above.
Census & demographics
- Census place
- Thayer, MO
- Population (ZIP)
- 4,172
Population outlook (Oregon County) Hauer SSP2
- Today (2025)
- 10,607 people
- By 2030
- 10,352 · -2.4%
- By 2040
- 9,829 · -7.3%
- By 2050
- 9,286 · -12.5%
- By 2075
- 8,392 · -20.9%
- By 2100
- 7,136 · -32.7%
Race, ethnicity, and origin ACS 2023
- Neighborhood character
- Predominantly White (94%)
- Race & ethnicity
- White 94% Two or more races 5% Hispanic / Latino 1%
- Common ancestry
- Serbian 2% Slovak 2% Portuguese 1%
- Foreign-born
- 0%
Political lean MEDSL · Oregon
- 2024 margin
- Solid R (+69.1) · D 15.1% · R 84.2%
- 2008→2024 swing
- -50.8pp toward R · 2008: -18.3pp · 2024: -69.1pp
- All cycles
- 2024: R+69.1 2020: R+63.8 2016: R+60.1 2012: R+33.2 2008: R+18.3
Not yet ingested
- Civics
- —
Market trends
- HPI YoY
- ▼ -23.09%
- Current HPI
- 196.3094
- Rent YoY
- —
- Metro
- —
- State GDP YoY
- ▲ 1.84%
- F500 in state
- 20
Industry mix (Fortune 500 HQ in MO)
| Industry | F500 HQs | Revenue |
|---|---|---|
| Healthcare | 1 | $163B |
|
||
| Insurance | 1 | $21B |
|
||
| Industrial Technology | 1 | $17B |
|
||
| Retail | 1 | $16B |
|
||
| Industrial Distribution | 1 | $10B |
|
||
| Utilities | 1 | $9B |
|
||
Price history
2 events — show timeline
- 2026-05-29 Pending — SOMO
- 2026-05-27 Listed $77,500 SOMO
Property tax history
+1.7%/yrLatest (2025): $368 · +9.0% YoY. Source: county tax records.
Cash-flow waterfall
monthlySold comps — $/sqft
last 12 mo · ≤1 miLoading sold comps…