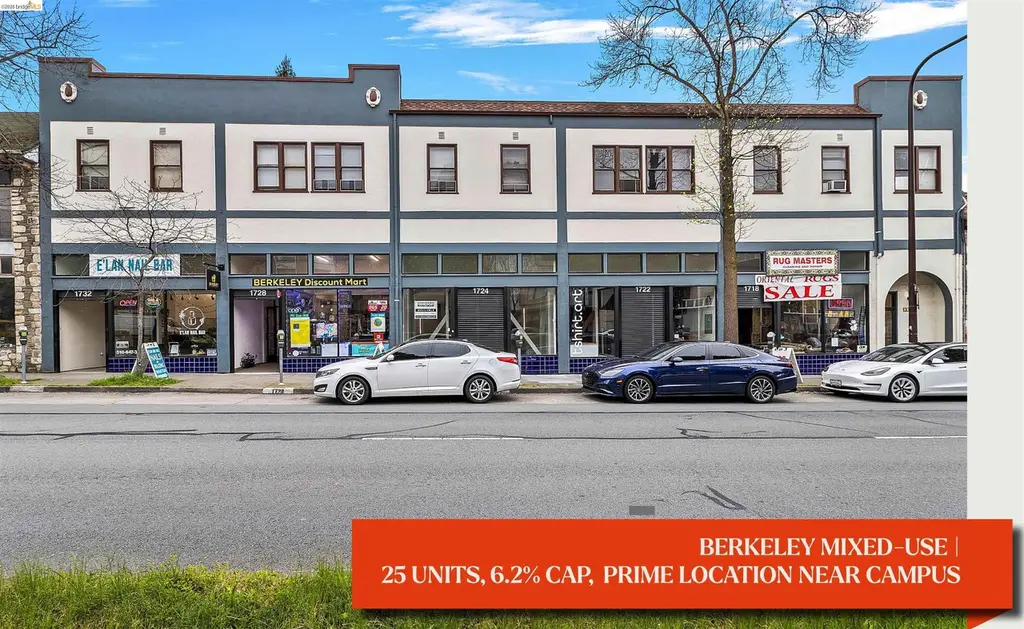
 25-Plex
1732 University Ave · Berkeley, CA
Flood risk No data
- FEMA flood zone
- —
- Chance of flooding over 30 yrs
- —
- Est. flood insurance / yr
- —
Fire risk No data
- Est. fire insurance / yr
- —
Heat risk No data
- Hot days now (above threshold)
- —
- Hot days in 30 yrs
- —
Wind risk No data
- Chance of severe wind over 30 yrs
- —
Air-quality risk No data
- Unhealthy air days now
- —
- Unhealthy air days in 30 yrs
- —
Risk factors via First Street. Map © Google.
Why this score? — see what drove the A- grade
The composite is a weighted blend of 9 inputs, each scored 0–100. Each bar is that input's sub-score; the figure is the points it added to the 100-point composite (weight × sub-score).
- Cash flow +30.0/30.0
- ARV discount +13.2/15.0
- 1% rule +10.0/10.0
- DSCR +10.0/10.0
- Schools +5.7/10.0
- Rent growth +4.2/5.0
- Livability +3.9/5.0
- Condition / age +3.8/5.0
- Appreciation +0.0/10.0
$4,200,000
🖨 Deal sheet 📄 Offer letter ✓ Due diligence
Multi-family units
County records classify this as Multi-Family (5+ Unit). Listing-text estimate: 25 units. confirmed
5+ unit building — per-unit beds/baths from public records are typically unavailable; the breakdown below (if shown) is an estimate from the listing text.
Listing remarks MLS
Positioned on Berkeley’s iconic University Avenue just five blocks from UC Berkeley, 1716-1732 University Ave is a 25-unit mixed-use asset offering scale, visibility, and strong in-place performance. The property includes 20 residential units (11 studios and 9 one-bedrooms) and 5 commercial spaces across 17,610 sq ft. A bright, skylit interior courtyard creates a welcoming central space while allowing natural light to flow through the building. Over $2.6M in capital improvements have been completed, including a seismic retrofit and a new roof in 2022. With a Walk Score of 95 and Bike Score of 100, tenants benefit from immediate access to Downtown Berkeley, BART, dining, and retail. Offered at a near 6.5% CAP and approximately $239/sf, this is a rare opportunity to acquire a high-exposure Berkeley asset with both income and long-term upside.
Key facts
- Seismic retrofit
- New roof
- 0.32 acre lot
Tags
Neighborhood map
What this means for you Summary
Snapshot
- This is a 25 × 2-bed/?-bath units multifamily listed at $4.20M. Condition is rated good.
Deal economics
- At list price, monthly cash flow is $33k ($399k/yr) — positive. Per door: $1k/mo.
- The deal already cash-flows at list — no discount required.
- Meets the 1% rule at list price ($79k rent vs $4.20M).
- Recommended offer: $3.95M (6.0% below list) — sets the bar for market timing.
- Cap rate 15.8% vs local median 2.0% in Berkeley — top-decile yield for the area; either an underpriced asset or a hidden risk that comps aren't pricing in. Stress-test before assuming the spread holds.
Location & tenants
- Location reads 77/100 on livability (#74 in CA, #2,860 nationally) — a middle-class / working-renter tenant base. Strengths: schools A+, amenities A+, commute A+; Watch: crime F, cost of living F.
- Berkeley Unified (urban): math 61% / reading 67% proficiency, ranked #175 of 1,400 in CA (top 12%) — acceptable for families but not a draw, mixed tenant base, ~2y average lease.
- Market conditions: Rents rising fast (+6.7%/yr); 56 active listings in the ZIP; high-income renter base; 1,742 units permitted in Alameda County in 2024 (856 in 5+ unit buildings).
- At $78,864/mo this rent would consume 563% of the median local household income ($168k/yr) (locally 473% of renters already pay >50% of income on rent) — very limited rent-growth headroom before tenants either downsize or default.
Forward outlook
- Local home prices are declining (-3.0%/yr); year-one equity from $29k of loan paydown is wiped out by about $126k of value loss. Plan a longer hold.
- Alameda County population projected at +34% by 2050 — long-run rental-demand tailwind backs the buy-and-hold thesis.
- At projected returns (-3.0% appreciation + 6.7% rent growth), your $1.18M cash investment doubles in ~4 years — after that, you're playing with house money.
Negotiation context
- It's been on market 70 days — a 6% lower offer ($3.95M) is reasonable based on typical stale-listing flexibility.
Risks & watch-outs
- Watch-outs: built in 1928 — expect roof / HVAC / electrical / plumbing capex.
Questions for the listing agent
- It's been on market 70 days. Have you received any prior offers? Is the seller open to a 6% concession, seller financing, or rate buy-down credit?
- Can we see the unit-by-unit rent roll, current vacancy, and any below-market leases? What's the average tenancy length?
- What capital expenditures (roof, boiler, parking lot, exteriors) have been made in the last 5 years, and what's planned in the next 2?
- Built in 1928 — when were the roof, HVAC, electrical panel, plumbing, and water heater last replaced?
- Why hasn't it sold? Are there any deal-killer items the seller is aware of (foundation, flood, title, zoning, code violations)?
- Is there a deadline driving the sale (1031 exchange, divorce, estate, relocation)? That informs how much negotiation room exists.
- Schools are A-rated — typically a magnet for longer-tenancy family renters. What's the average tenant stay here, and is there a school-zone premium baked into asking?
- Crime grade is F in this area — have there been break-ins, vandalism, or insurance claims at this property in the last 3 years? What carrier currently insures it and at what premium?
- What's the average days-on-market for RENTAL listings here right now (not sales)? A rising rental-DOM trend means longer vacancies and softer asking-rent achievability than the comps imply.
- What's the recent tenant-quality profile in this submarket — average credit score on applications, eviction rate, late-payment / NSF rate, and stable-employment percentage? A property-management company in the area should have these aggregated.
- How much new apartment / multifamily construction is in the pipeline within 1–3 miles? Heavy new supply (>2% of stock underway) typically softens rents 12–24 months out; light construction supports rent growth.
Investment metrics
- 1% rule
- 1.88% ✓
- Cap rate
- 15.80%
- Cash-on-cash
- 33.96%
- DSCR
- 2.51
- GRM
- 4.4
CMA / ARV
- ARV (median comp)
- $4,808,124
- List price
- $4,200,000
- Delta
- -12.65%
- Verdict
- UNDERPRICED
- Comps
- 6 within 2.0 mi
Projected returns pro-forma
-3.0% appreciation · 6.68% rent growth · sell at horizon
- IRR
- 33.4%
- Equity multiple
- 2.48×
- Total profit
- $1,742,847
- Equity at exit
- $626,234
- IRR
- 42.3%
- Equity multiple
- 5.76×
- Total profit
- $5,591,979
- Equity at exit
- $363,139
Cash invested: $1,176,000 (down + closing). Projections, not guarantees.
Landlord ↔ Tenant lean methodology
- Overall (CITY)
- 0 Strongly Tenant-Friendly
- State California
- 18 Strongly Tenant-Friendly · D+13
- County
- — inherits STATE
- City Berkeley
- 0 Strongly Tenant-Friendly · D+78
ZIP-level market 94705
- Rents YoY
- 6.7%
- Active inventory
- 56
- Price-to-rent
- 111.0×
Monthly cashflow live
- Estimated rent
- $78,864 high interval (Pro) →
- Mortgage (P&I)
- −$22,025
- Tax est. 1.5%
- −$5,250 /mo · $63,000/yr
- Insurance
- −$1,750
- HOA
- −$0
- Vacancy / Maint / Mgmt
- −$16,561
- Net cashflow
- $33,277
Break-even live
25-unit breakdown (identical units grouped — click to expand)
| Units | Beds | Baths | Est. rent |
|---|---|---|---|
| 25× units | 2 | — | $78,875 |
| #1 | 2 | — | $3,155 |
| #2 | 2 | — | $3,155 |
| #3 | 2 | — | $3,155 |
| #4 | 2 | — | $3,155 |
| #5 | 2 | — | $3,155 |
| #6 | 2 | — | $3,155 |
| #7 | 2 | — | $3,155 |
| #8 | 2 | — | $3,155 |
| #9 | 2 | — | $3,155 |
| #10 | 2 | — | $3,155 |
| #11 | 2 | — | $3,155 |
| #12 | 2 | — | $3,155 |
| #13 | 2 | — | $3,155 |
| #14 | 2 | — | $3,155 |
| #15 | 2 | — | $3,155 |
| #16 | 2 | — | $3,155 |
| #17 | 2 | — | $3,155 |
| #18 | 2 | — | $3,155 |
| #19 | 2 | — | $3,155 |
| #20 | 2 | — | $3,155 |
| #21 | 2 | — | $3,155 |
| #22 | 2 | — | $3,155 |
| #23 | 2 | — | $3,155 |
| #24 | 2 | — | $3,155 |
| #25 | 2 | — | $3,155 |
| Total (25 units) | $78,864 | ||
UW: 25.0% down · 7.5% · 30yr · 1.5% tax · 5.0% vac · 8.0% maint · 8.0% mgmt
Financing live
Cash to close
- Down payment
- $1,050,000
- Closing costs
- $126,000
- Reserves months
- —
- Total cash needed
- —
Loan-product check · same deal, 3 products live
Conventional
25% down · 7.5% · 30yr
- Down + closing
- —
- Monthly P&I
- —
- Monthly cashflow
- —
- DSCR
- —
- Eligible?
- —
Personal DTI + credit; lowest rate.
DSCR
20% down · 8.5% · 30yr
- Down + closing
- —
- Monthly P&I
- —
- Monthly cashflow
- —
- DSCR
- —
- Eligible?
- —
No personal income docs; deal must DSCR.
Hard money
10% down · 12.0% · 12mo
- Down + closing
- —
- Monthly P&I
- —
- Monthly cashflow
- —
- DSCR
- —
- Eligible?
- —
Short-term bridge; refi at stabilization.
Listing history 15 events
-
2026-06-18days on market $4,200,000 Active 70 DOM
-
2026-06-17days on market $4,200,000 Active 69 DOM
-
2026-06-16days on market $4,200,000 Active 68 DOM
-
2026-06-15days on market $4,200,000 Active 67 DOM
-
2026-06-13days on market $4,200,000 Active 65 DOM
-
2026-06-13days on market $4,200,000 Active 64 DOM
-
2026-06-09days on market $4,200,000 Active 61 DOM
-
2026-06-08days on market $4,200,000 Active 60 DOM
-
2026-06-07days on market $4,200,000 Active 59 DOM
-
2026-06-04days on market $4,200,000 Active 56 DOM
-
2026-06-03days on market $4,200,000 Active 55 DOM
-
2026-06-02days on market $4,200,000 Active 54 DOM
-
2026-06-01days on market $4,200,000 Active 53 DOM
-
2026-05-31days on market $4,200,000 Active 52 DOM
-
2026-04-09$4,200,000 Active 858-char remark
Show marketing remark (858 chars)
Positioned on Berkeley’s iconic University Avenue just five blocks from UC Berkeley, 1716-1732 University Ave is a 25-unit mixed-use asset offering scale, visibility, and strong in-place performance. The property includes 20 residential units (11 studios and 9 one-bedrooms) and 5 commercial spaces across 17,610 sq ft. A bright, skylit interior courtyard creates a welcoming central space while allowing natural light to flow through the building. Over $2.6M in capital improvements have been completed, including a seismic retrofit and a new roof in 2022. With a Walk Score of 95 and Bike Score of 100, tenants benefit from immediate access to Downtown Berkeley, BART, dining, and retail. Offered at a near 6.5% CAP and approximately $239/sf, this is a rare opportunity to acquire a high-exposure Berkeley asset with both income and long-term upside.
ⓘ Source: listings_history table (triggers on properties + properties_extension) + one-shot
backfill from property_details.listing_events for pre-trigger history.
Nearby sold comps map
Loading sold comps map…
Walkable amenities ~0.75 mi
Loading nearby amenities…
Taxation est. · year 1
- Rental income
- $946,368
- − Mortgage interest
- −$235,265
- − Property taxes
- −$63,000
- − Insurance
- −$21,000
- − Repairs & maintenance
- −$75,709
- − Management
- −$75,709
- − Depreciation
- −$122,182
- Taxable income
- $353,502
- Est. tax owed @ 24.0%
- −$84,840
- After-tax cash flow
- $314,487/yr
For passive investors: Depreciation is non-cash, so a rental often shows a tax loss while cash-flowing — sheltering income. Rental losses are passive: they offset passive income freely, and up to $25,000/yr can offset ordinary (W-2) income if you actively participate and your MAGI is under $100k (phasing out to $0 by $150k); unused losses carry forward. On sale, claimed depreciation is recaptured at up to 25%, and gains may owe capital-gains tax (a 1031 exchange can defer both). Figures are a year-1 estimate at your 24.0% rate — not tax advice; consult a CPA.
Condition & rehab AI · 13 photos
The property is in good condition with minimal repairs needed. Upgrading the exterior, HVAC system, and interior can significantly increase its value.
Value-add opportunities
- Both Paint the exterior walls — Painting the exterior walls can enhance the curb appeal and increase the property's value.
- Both Upgrade the HVAC system — Upgrading the HVAC system can improve energy efficiency and comfort, making the property more attractive to tenants and buyers.
- Both Landscaping improvements — Enhancing the landscaping can improve the property's curb appeal and attract more tenants and buyers.
- Both Update the interior walls and floors — Updating the interior walls and floors can make the property more attractive and increase its value.
- Both Inspect and clean the HVAC system — Maintaining the HVAC system can improve energy efficiency and comfort, making the property more attractive to tenants and buyers.
Renovation cost estimate screening
Value-add ROI direction
- Both Paint the exterior walls — Painting the exterior walls can enhance the curb appeal and increase the property's value. ↑
- Both Upgrade the HVAC system — Upgrading the HVAC system can improve energy efficiency and comfort, making the property more attractive to tenants and buyers. ↑
- Both Landscaping improvements — Enhancing the landscaping can improve the property's curb appeal and attract more tenants and buyers. ↑
- Both Update the interior walls and floors — Updating the interior walls and floors can make the property more attractive and increase its value. ↑
- Both Inspect and clean the HVAC system — Maintaining the HVAC system can improve energy efficiency and comfort, making the property more attractive to tenants and buyers. ↑
ⓘ Cost ranges are severity-bucket heuristics (US national rule-of-thumb). Get contractor quotes + a written scope before underwriting a rehab budget.
Schools (NCES district)
- District
- Berkeley Unified
- NCES district ID
- 0604740
- Math proficiency
- 61% ▲ 2.00%
- Reading proficiency
- 67% ▲ 2.00%
- Median HH income
- $66,202
- Composite
- 57.37/100
- National rank
- #2288
- State rank
- #175 of 1400 in CA
Livability — Berkeley
- Score
- 77/100
- State rank
- #74
- US rank
- #2860
Category grades
Schools grade is shown separately in the Schools card above.
Census & demographics
- Census place
- Berkeley, CA
- County
- Alameda County · 1,614,355 people
- City population
- 121,632
- Metro
- San Francisco-Oakland-Berkeley, CA
- Population (ZIP)
- 13,991
- Household income
- $167,970
- Rent vs Own
- Severe rent burden
- 473.0
Population outlook (Alameda County) Hauer SSP2
- Today (2025)
- 1,928,884 people
- By 2030
- 2,069,146 · +7.3%
- By 2040
- 2,338,405 · +21.2%
- By 2050
- 2,586,608 · +34.1%
- By 2075
- 3,061,911 · +58.7%
- By 2100
- 3,234,133 · +67.7%
Race, ethnicity, and origin ACS 2023
- Neighborhood character
- Predominantly White (70%)
- Race & ethnicity
- White 70% Asian 11% Two or more races 10% Hispanic / Latino 8% Black 4%
- Hispanic origin (detail)
- Mexican 3%
- Common ancestry
- Italian 5% Scotch-Irish 3% Lithuanian 3%
- Foreign-born
- 16% · Canada, China, South Korea
- Languages at home
- 79% English-only · Other Indo-European 5% Spanish 5% French/Haitian/Cajun 3%
Political lean MEDSL · Alameda
- 2024 margin
- Solid D (+53.6) · D 74.6% · R 21.0% · Other 4.4%
- 2008→2024 swing
- -5.9pp toward R · 2008: 59.5pp · 2024: 53.6pp
- All cycles
- 2024: D+53.6 2020: D+62.5 2016: D+64.4 2012: D+59.8 2008: D+59.5
Not yet ingested
- Civics
- —
Market trends
- HPI YoY
- ▼ -708.07%
- Current HPI
- 300.2322
- Rent YoY
- ▲ 6.68%
- Metro
- San Francisco-Oakland-Berkeley, CA
- State GDP YoY
- ▲ 3.21%
- F500 in state
- 116
Industry mix (Fortune 500 HQ in CA)
| Industry | F500 HQs | Revenue |
|---|---|---|
| Technology | 27 | $1,492B |
|
||
| Financial Services | 3 | $174B |
|
||
| Retail | 3 | $44B |
|
||
| Insurance | 3 | $26B |
|
||
| Media / Entertainment | 2 | $115B |
|
||
| Pharmaceuticals / Biotech | 2 | $62B |
|
||
Price history
1 event — show timeline
- 2026-04-09 Listed $4,200,000 bridgeMLS, Bay East AOR, or Contra Costa AOR
Cash-flow waterfall
monthlySold comps — $/sqft
last 12 mo · ≤1 miLoading sold comps…