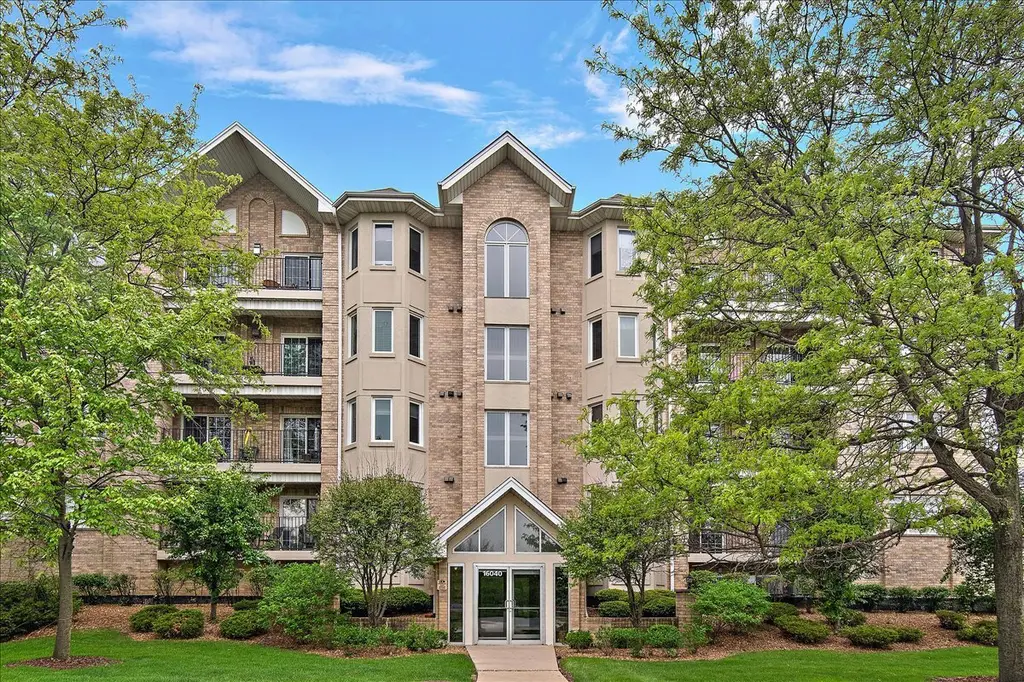
16040 Boardwalk Ln Unit 3D · Orland Park, IL
Flood risk 1/10 · Minimal
- FEMA flood zone
- X (unshaded)
- Chance of flooding over 30 yrs
- 0.0%
- Est. flood insurance / yr
- $507 – $1,088
Fire risk 2/10 · Minimal
- Est. fire insurance / yr
- $804 – $1,492
Heat risk 3/10 · Minor
- Hot days now (above 102°F)
- 7 days/yr
- Hot days in 30 yrs
- 15 days/yr
Wind risk 2/10 · Minimal
- Chance of severe wind over 30 yrs
- —
Air-quality risk 2/10 · Minimal
- Unhealthy air days now
- 1 days/yr
- Unhealthy air days in 30 yrs
- 1 days/yr
Risk factors via First Street. Map © Google.
Why this score? — see what drove the D- grade
The composite is a weighted blend of 9 inputs, each scored 0–100. Each bar is that input's sub-score; the figure is the points it added to the 100-point composite (weight × sub-score).
- Cash flow +12.1/30.0
- ARV discount +7.5/15.0
- Livability +4.2/5.0
- 1% rule +3.8/10.0
- DSCR +3.6/10.0
- Schools +3.4/10.0
- Rent growth +2.5/5.0
- Condition / age +2.5/5.0
- Appreciation +0.0/10.0
$324,900
🖨 Deal sheet (PDF) 📄 Offer letter ✓ Due diligence
Listing remarks
WELCOME TO ORLAND PARK'S FINEST ELEVATOR CONDO BUILDING! SECURITY CAMERA'S! UNIT FACES WEST! BEAUTIFUL SUNSET VIEWS FROM YOUR 4 STORY 20' BALCONY! APPROX. 1650 SQ. FT. OF UPGRADED OPEN SPACE! NEW AIR CONDITIONER APRIL 2026, NEW FURNACE DECEMBER 2024, HOT WATER HEATER 2023, NEW FRIG 2025, OVEN/RANGE & DISHWASHER 2023. NEW ROOF WILL BE INSTALLED ON BUILDING JUNE 2026 (SPECIAL ASSESSMENT PAID IN FULL)! NEW GARAGE DOOR 2025! 2 LARGE BEDROOMS AND 2 FULL BATH! IN UNIT LAUNDRY WITH UTILITY SINK! FIREPLACE! CONDO FEATURES PLENTY OF LIGHT! DOUBLE BALCONY DOORS! PLENTY OF CLOSET SPACE! 16 UNIT BUILDING ( 4 CONDO'S PER FLOOR) ENCLOSED HEATED GARAGE! FURNITURE NEGOTIABLE! WALKING DISTANCE TO SHO
Key facts
- Security cameras
- New furnace
- New air conditioner
Tags
Property features AI
Finance
- Other: Tax exemptions: Homeowner, Senior, Senior Freeze
- HOA & community: Monthly association fee of $329; HOA covers parking, insurance, exterior maintenance, lawn care and snow removal; Pets not allowed
Exterior
- Parking: Attached garage (1-car)
- Utilities: Water: Lake Michigan / Public; Sewer: Public sewer
- Home design: Attached single condo; Entry level: 3rd floor; Disability access available
- Construction: Brick construction; Building approximately 26–30 years old; Building contains 16 units
- Exterior features: Common lot/grounds
Interior
- Kitchen: Kitchen on main level (16 x 13) with ceramic tile flooring
- Bedrooms: Master bedroom on main level (16 x 12) with full bath; Second bedroom on main level (14 x 12); Additional bedrooms listed
- Flooring: Laminate flooring in living areas and bedrooms; Ceramic tile in kitchen and laundry
- Bathrooms: 2 full bathrooms; Features include whirlpool, separate shower, and double sink
- Heating & cooling: Natural gas heating; Central air conditioning; Electric fireplace
- Interior features: Open floorplan; Elevator; Storage; Walk-in closet(s); Drapes; Blinds
- Laundry & utility: In-unit laundry; Washer hookup; Gas dryer hookup; Electric dryer hookup; Laundry sink; Laundry room on main level (8 x 7) with ceramic tile flooring
Neighborhood map
What this means for you Summary
Snapshot
- This is a 2-bed/2.0-bath condo listed at $325k.
Deal economics
- At list price, monthly cash flow is $-73 ($-875/yr) — negative.
- To cash-flow at today's rent, offer at most $312k (4.0% below list).
- To meet the 1% rule (rent ≥ 1% of price), the offer needs to be $286k (12.0% below list).
- Recommended offer: $286k (12.0% below list) — sets the bar for 1% rule.
- Cap rate 6.0% vs local median 4.5% in Orland Park — top-decile yield for the area; either an underpriced asset or a hidden risk that comps aren't pricing in. Stress-test before assuming the spread holds.
Location & tenants
- Location reads 85/100 on livability (#29 in IL, #529 nationally) — a professional / high-income tenant draw. Strengths: crime A+, amenities A+, commute A+.
- Cons Hsd 230 (suburban): math 35% / reading 39% proficiency, ranked #146 of 620 in IL (top 24%) — families likely to look elsewhere, expect single-tenant / working-renter base with shorter leases.
- Zoned schools: Carl Sandburg High School (math 41% / reading 45%, grade F, #72 of 693 statewide, top 10%, 2,894 students, 0% FRL).
- Market conditions: 118 active listings in the ZIP; 10 comparable units currently listed for rent nearby; rentals at typical pace (median 17d on market — plan ~3-4 weeks tenant-placement turnaround); 6,272 units permitted in Cook County in 2024 (4,658 in 5+ unit buildings).
Forward outlook
- Local home prices are declining (-3.0%/yr); year-one equity from $2k of loan paydown is wiped out by about $10k of value loss. Plan a longer hold.
Negotiation context
- It's been on market 20 days — a 2% lower offer ($320k) is reasonable based on typical stale-listing flexibility.
- Current owner paid $160k; list at $325k implies a 103% gain — meaningful room to come down on a strong offer.
Questions for the listing agent
- What do current leases actually rent for vs. the listed asking? Can we see a recent rent roll and the last 12 months of T-12 income?
- What does the HOA fee cover, when was the last increase, and are there any pending special assessments or reserve-fund shortfalls?
- Any open or pending special assessments — roof, HVAC, plumbing, elevator, façade? What's the per-unit balance and payoff schedule, and is the seller paying it off at close or rolling it to the buyer?
- Is there a deadline driving the sale (1031 exchange, divorce, estate, relocation)? That informs how much negotiation room exists.
- The area grade is low — what's the realistic commute time and amenity access for the typical tenant pool here? Any planned neighborhood developments (good or bad) we should know about?
- What's the average days-on-market for RENTAL listings here right now (not sales)? A rising rental-DOM trend means longer vacancies and softer asking-rent achievability than the comps imply.
- What's the recent tenant-quality profile in this submarket — average credit score on applications, eviction rate, late-payment / NSF rate, and stable-employment percentage? A property-management company in the area should have these aggregated.
- How much new apartment / multifamily construction is in the pipeline within 1–3 miles? Heavy new supply (>2% of stock underway) typically softens rents 12–24 months out; light construction supports rent growth.
Investment metrics
- 1% rule
- 0.88% ✗
- Cap rate
- 6.02%
- Cash-on-cash
- -0.96%
- DSCR
- 0.96
- GRM
- 9.5
CMA / ARV
No comps found within radius.
Projected returns pro-forma
-3.0% appreciation · 3.0% rent growth · sell at horizon
- IRR
- -17.8%
- Equity multiple
- 0.37×
- Total profit
- $-57,197
- Equity at exit
- $48,444
- IRR
- -9.9%
- Equity multiple
- 0.39×
- Total profit
- $-55,397
- Equity at exit
- $28,091
Cash invested: $90,972 (down + closing). Projections, not guarantees.
Landlord ↔ Tenant lean methodology
- Overall (STATE)
- 43 Moderately Tenant-Leaning
- State Illinois
- 43 Moderately Tenant-Leaning · D+7
- County
- — inherits STATE
- City
- — inherits STATE
ZIP-level market 60467
- Home prices YoY
- -30.4%
- Active inventory
- 118
- Price-to-rent
- 9.5×
Monthly cashflow live
- Estimated rent
- $2,860 high interval (Pro) →
- Mortgage (P&I)
- −$1,704
- Tax from tax record
- −$164 /mo · $1,965/yr
- Insurance
- −$135
- HOA
- −$329
- Vacancy / Maint / Mgmt
- −$601
- Net cashflow
- $-73
Break-even live
Sensitivity live
| Price | -10% $111 | -5% $19 | +0% $-73 | +5% $-165 | +10% $-257 |
|---|---|---|---|---|---|
| Rent | -10% $-299 | -5% $-186 | +0% $-73 | +5% $40 | +10% $153 |
| Rate | -1.0pp $91 | -0.5pp $10 | base $-73 | +0.5pp $-157 | +1.0pp $-243 |
UW: 25.0% down · 7.5% · 30yr · 1.5% tax · 5.0% vac · 8.0% maint · 8.0% mgmt
Financing live
Cash to close
- Down payment
- $81,225
- Closing costs
- $9,747
- Reserves months
- —
- Total cash needed
- —
Loan-product check · same deal, 3 products live
Conventional
25% down · 7.5% · 30yr
- Down + closing
- —
- Monthly P&I
- —
- Monthly cashflow
- —
- DSCR
- —
- Eligible?
- —
Personal DTI + credit; lowest rate.
DSCR
20% down · 8.5% · 30yr
- Down + closing
- —
- Monthly P&I
- —
- Monthly cashflow
- —
- DSCR
- —
- Eligible?
- —
No personal income docs; deal must DSCR.
Hard money
10% down · 12.0% · 12mo
- Down + closing
- —
- Monthly P&I
- —
- Monthly cashflow
- —
- DSCR
- —
- Eligible?
- —
Short-term bridge; refi at stabilization.
Rent comps 10 comps
| Address | Beds | Baths | Sqft | Rent | $/sqft | DOM | Units | Dist |
|---|---|---|---|---|---|---|---|---|
| 9147 Boardwalk Ter Orland Hills, IL | 3.0 | 2.0 | 2076 | $3,500 | $1.69 | 22d | 1 | 0.55mi |
| 9309 Wherry Ln Orland Park, IL | 2.0 | 2.5 | 1500 | $2,525 | $1.68 | 26d | 1 | 0.71mi |
| 16610 Liberty Cir Unit 1N Orland Park, IL | 2.0 | 2.0 | 1200 | $2,400 | $2.00 | 0d | 1 | 0.86mi |
| 15826 Farm Hill Dr Orland Park, IL | 3.0 | 1.5 | 1500 | $2,500 | $1.67 | 12d | 1 | 0.98mi |
| 16180 Apple Ln #2 Tinley Park, IL | 3.0 | 2.5 | 1250 | $2,900 | $2.32 | 6d | 1 | 1.15mi |
| 15502 Orlan Brook Dr #222 Orland Park, IL | 2.0 | 2.0 | 1069 | $2,700 | $2.53 | 26d | 1 | 1.22mi |
| 15502 Orlan Brook Dr #222 Orland Park, IL | 2.0 | 2.0 | 1069 | $2,500 | $2.34 | 9d | 1 | 1.22mi |
| 16450 Cherry Hill Ave Tinley Park, IL | 3.0 | 2.0 | 1370 | $3,100 | $2.26 | 9d | 1 | 1.23mi |
| 15202 Highland Ave Orland Park, IL | 3.0 | 1.0 | 1300 | $2,699 | $2.08 | 18d | 1 | 1.41mi |
| 15222 Huntington Ct Orland Park, IL | 3.0 | 2.0 | 1858 | $3,500 | $1.88 | 16d | 1 | 1.42mi |
HOA detail condo
- Monthly dues
- $329 · $3,948/yr
- Likely covers
- watersecurity
- ⚠ Special-assessment mentions
-
…WATER HEATER 2023, NEW FRIG 2025, OVEN/RANGE & DISHWASHER 2023. NEW ROOF WILL BE INSTALLED ON BUILDING JUNE 2026 (SPECIAL ASSESSMENT PAID IN FULL)! NEW GARAGE DOOR 2025! 2 LARGE BEDROOMS AND 2 FULL BATH! IN UNIT LAUNDRY WITH UTILITY SINK! FIREPLACE!…
Listing history 4 events
-
2026-05-21status Pending
-
2026-05-04historical Contingent - Continue to Show
-
2026-05-01$324,900 Active
-
1999-11-04soldstatus $160,000
ⓘ Source: listings_history table (triggers on properties + properties_extension) + one-shot
backfill from property_details.listing_events for pre-trigger history.
Tax reassessment forecast IL · Partial reset (capped growth)
- Current annual tax
- $1,965 · $164/mo
- Projected year-2 tax
- $4,670 · $389/mo
- Expected delta
- +$2,705/yr (+$225/mo · 137.6%)
ⓘ Screening estimate from a state-policy table — verify with the county assessor before closing.
Climate risk First Street
- Flood 1/10 Low FEMA zone X (unshaded) · 0% chance over 30 yrs
- Wildfire 2/10 Low
- Heat 3/10 Moderate 7 d/yr ≥102°F today · 15 d/yr by 30 yrs out
- Wind 2/10 Low
- Air quality 2/10 Low 1 unhealthy d/yr today · 1 by 30 yrs out
Nearby sold comps map
Loading sold comps map…
Walkable amenities ~0.75 mi
Loading nearby amenities…
Taxation est. · year 1
- Rental income
- $34,314
- − Mortgage interest
- −$18,199
- − Property taxes
- −$1,965
- − Insurance
- −$1,624
- − Repairs & maintenance
- −$2,745
- − Management
- −$2,745
- − HOA
- −$3,948
- − Depreciation
- −$9,452
- Taxable loss
- −$6,365
- Est. tax savings @ 24.0%
- +$1,528
- After-tax cash flow
- $652/yr
For passive investors: Depreciation is non-cash, so a rental often shows a tax loss while cash-flowing — sheltering income. Rental losses are passive: they offset passive income freely, and up to $25,000/yr can offset ordinary (W-2) income if you actively participate and your MAGI is under $100k (phasing out to $0 by $150k); unused losses carry forward. On sale, claimed depreciation is recaptured at up to 25%, and gains may owe capital-gains tax (a 1031 exchange can defer both). Figures are a year-1 estimate at your 24.0% rate — not tax advice; consult a CPA.
Schools (NCES district)
- District
- Cons Hsd 230
- NCES district ID
- 1708400
- Math proficiency
- 35% ▼ -8.00%
- Reading proficiency
- 39% ▼ -6.00%
- Median HH income
- $73,953
- Composite
- 34.29/100
- National rank
- #5244
- State rank
- #146 of 620 in IL
Livability — Orland Park
- Score
- 85/100
- State rank
- #29
- US rank
- #529
Category grades
Schools grade is shown separately in the Schools card above.
Census & demographics
- Census place
- Orland Park, IL
- City population
- 41,456
- Population (ZIP)
- 24,952
Population outlook (Cook County) Hauer SSP2
- Today (2025)
- 5,347,519 people
- By 2030
- 5,357,703 · +0.2%
- By 2040
- 5,324,924 · -0.4%
- By 2050
- 5,230,762 · -2.2%
- By 2075
- 4,785,735 · -10.5%
- By 2100
- 4,188,836 · -21.7%
Race, ethnicity, and origin ACS 2023
- Neighborhood character
- Predominantly White (83%)
- Race & ethnicity
- White 83% Hispanic / Latino 6% Asian 5% Two or more races 4% Black 4%
- Hispanic origin (detail)
- Mexican 5%
- Common ancestry
- Romanian 15% Armenian 2% Iranian 2%
- Foreign-born
- 14% · Canada, South Korea, China
- Languages at home
- 78% English-only · Arabic 9% Russian/Polish/Slavic 4% Other Indo-European 4%
Political lean MEDSL · Cook
- 2024 margin
- Solid D (+42.0) · D 70.4% · R 28.4% · Other 1.2%
- 2008→2024 swing
- -11.4pp toward R · 2008: 53.4pp · 2024: 42.0pp
- All cycles
- 2024: D+42.0 2020: D+50.3 2016: D+53.0 2012: D+49.4 2008: D+53.4
Not yet ingested
- Civics
- —
Market trends
- HPI YoY
- ▼ -82.13%
- Current HPI
- 188.3676
- Rent YoY
- —
- Metro
- —
- State GDP YoY
- ▲ 1.59%
- F500 in state
- 60
Industry mix (Fortune 500 HQ in IL)
| Industry | F500 HQs | Revenue |
|---|---|---|
| Insurance | 4 | $201B |
|
||
| Consumer Goods | 4 | $87B |
|
||
| Industrial Machinery | 3 | $64B |
|
||
| Healthcare | 2 | $55B |
|
||
| Retail / Pharmacy | 1 | $148B |
|
||
| Agriculture / Food | 1 | $86B |
|
||
Price history
+103.1% since first listed4 events — show timeline
- 2026-05-21 Pending — MRED as Distributed by MLS Grid
- 2026-05-04 Contingent — MRED as Distributed by MLS Grid
- 2026-05-01 Listed $324,900 MRED as Distributed by MLS Grid
- 1999-11-04 Sold (Public Records) $160,000 Public Records
Property tax history
-2.8%/yrLatest (2023): $1,965 · -52.3% YoY. Source: county tax records.
Cash-flow waterfall
monthlySold comps — $/sqft
last 12 mo · ≤1 miLoading sold comps…