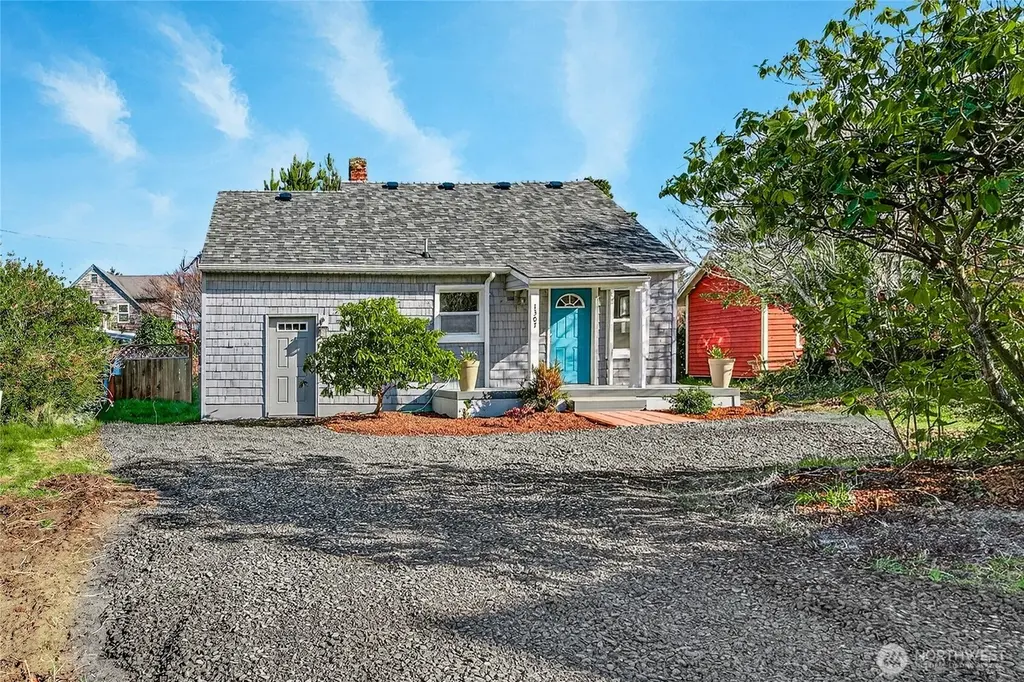
1307 267th Pl · Ocean Park, WA
Flood risk 6/10 · Moderate
- FEMA flood zone
- X (unshaded)
- Chance of flooding over 30 yrs
- 0.74%
- Est. flood insurance / yr
- $507 – $1,088
Fire risk 1/10 · Minimal
- Est. fire insurance / yr
- $604 – $1,122
Heat risk 1/10 · Minimal
- Hot days now (above 74°F)
- 8 days/yr
- Hot days in 30 yrs
- 17 days/yr
Wind risk 1/10 · Minimal
- Chance of severe wind over 30 yrs
- —
Air-quality risk 5/10 · Moderate
- Unhealthy air days now
- 6 days/yr
- Unhealthy air days in 30 yrs
- 6 days/yr
Risk factors via First Street. Map © Google.
Why this score? — see what drove the D grade
The composite is a weighted blend of 9 inputs, each scored 0–100. Each bar is that input's sub-score; the figure is the points it added to the 100-point composite (weight × sub-score).
- Cash flow +15.0/30.0
- ARV discount +7.6/15.0
- DSCR +4.6/10.0
- Schools +3.7/10.0
- Livability +3.6/5.0
- 1% rule +3.0/10.0
- Rent growth +2.5/5.0
- Condition / age +2.5/5.0
- Appreciation +0.0/10.0
$299,000
🖨 Deal sheet (PDF) 📄 Offer letter ✓ Due diligence
Listing remarks MLS
Clam diggers retreat! Cute & Cozy, located on west side of Vernon just 6 blocks north of Bay Avenue in Ocean Park. Sleeps 4 - 6 with rom for RV's
Key facts
- Completely remodeled
- Finished bonus room
- New roof
Tags
Neighborhood map
What this means for you Summary
Snapshot
- This is a 2-bed/2.0-bath single-family listed at $299k.
Deal economics
- At list price, monthly cash flow is $92 ($1k/yr) — positive.
- The deal already cash-flows at list — no discount required.
- To meet the 1% rule (rent ≥ 1% of price), the offer needs to be $239k (20.0% below list).
- Recommended offer: $239k (20.0% below list) — sets the bar for 1% rule.
- Cap rate 6.7% vs local median 4.2% in Ocean Park — top-decile yield for the area; either an underpriced asset or a hidden risk that comps aren't pricing in. Stress-test before assuming the spread holds.
Location & tenants
- Location reads 72/100 on livability (#216 in WA) — a middle-class / working-renter tenant base. Strengths: housing A+, health & safety A+, crime A; Watch: commute D+, employment D+, amenities F.
- Ocean Beach School District (rural): math 34% / reading 50% proficiency, ranked #212 of 291 in WA (top 73%) — families likely to look elsewhere, expect single-tenant / working-renter base with shorter leases.
- Zoned schools: Ocean Park Elementary (196 students, 76% FRL); Hilltop Elementary School (236 students, 70% FRL); Ilwaco High School (296 students, 64% FRL).
- Market conditions: 320 active listings in the ZIP; 2 comparable units currently listed for rent nearby; 90 units permitted in Pacific County in 2024 (0 in 5+ unit buildings).
Forward outlook
- Local home prices are declining (-3.0%/yr); year-one equity from $2k of loan paydown is wiped out by about $9k of value loss. Plan a longer hold.
- Pacific County population projected at -10% by 2050 — secular population decline; favor cash flow + early exit over multi-decade hold.
Negotiation context
- It's been on market 55 days — a 3% lower offer ($290k) is reasonable based on typical stale-listing flexibility.
- 3 sale attempts since 16y ago with the ask held roughly flat each time — persistent listings suggest the price (not the market) is what's stuck; bring a comps-based counter.
- Current owner paid $50k; list at $299k implies a 498% gain — meaningful room to come down on a strong offer.
Risks & watch-outs
- Watch-outs: built in 1945 — expect roof / HVAC / electrical / plumbing capex.
- Climate carrying-cost: major flood risk — expect insurance premiums to compound above CPI over the hold.
Questions for the listing agent
- It's been on market 55 days. Have you received any prior offers? Is the seller open to a 20% concession, seller financing, or rate buy-down credit?
- Built in 1945 — when were the roof, HVAC, electrical panel, plumbing, and water heater last replaced?
- Is there a deadline driving the sale (1031 exchange, divorce, estate, relocation)? That informs how much negotiation room exists.
- Schools are F-rated, which usually means shorter tenancies and higher turnover. Who's the typical renter profile here, and what's been the actual vacancy rate?
- The area grade is low — what's the realistic commute time and amenity access for the typical tenant pool here? Any planned neighborhood developments (good or bad) we should know about?
- What's the average days-on-market for RENTAL listings here right now (not sales)? A rising rental-DOM trend means longer vacancies and softer asking-rent achievability than the comps imply.
- What's the recent tenant-quality profile in this submarket — average credit score on applications, eviction rate, late-payment / NSF rate, and stable-employment percentage? A property-management company in the area should have these aggregated.
- How much new for-sale + rental construction is in the pipeline within 1–3 miles? Heavy new supply typically softens prices + rents 12–24 months out; constrained supply supports both.
Investment metrics
- 1% rule
- 0.80% ✗
- Cap rate
- 6.66%
- Cash-on-cash
- 1.32%
- DSCR
- 1.06
- GRM
- 10.4
CMA / ARV
- ARV (median comp)
- $299,661
- List price
- $299,000
- Delta
- -0.22%
- Verdict
- FAIR
- Comps
- 20 within 1.0 mi
Show comp detail 12 sales within ~0.75 mi
| Address | Dist | Beds/Ba | Sqft | Sold | Price | $/sf | Match |
|---|---|---|---|---|---|---|---|
| 1512 270th Pl | 0.16mi | 2/1.0 | 864 (+0%) | 5mo | $215,000 | $249 | 84 |
| 1215 273rd Pl | 0.30mi | 2/1.5 | 855 (-1%) | 9mo | $355,000 | $415 | 75 |
| 1307 262nd Pl | 0.25mi | 2/1.0 | 840 (-3%) | 7mo | $208,000 | $248 | 74 |
| 1215 274th Pl | 0.36mi | 2/1.0 | 816 (-5%) | 1mo | $350,000 | $429 | 70 |
| 1305 274th Pl | 0.35mi | 2/1.0 | 800 (-7%) | 4mo | $340,000 | $425 | 64 |
| 1310 260TH Pl | 0.38mi | 2/1.0 | 830 (-4%) | 14mo | $348,000 | $419 | 61 |
| 1305 269th Pl | 0.10mi | 1/1.0 (-1) | 960 (+11%) | 14mo | $255,000 | $266 | 56 |
| 26711 Ridge Ave | 0.11mi | 1/1.0 (-1) | 988 (+14%) | 9mo | $275,000 | $278 | 54 |
| 1702 Bay Ave | 0.37mi | 2/1.0 | 736 (-15%) | 4mo | $378,610 | $514 | 51 |
| 27501 U St | 0.50mi | 2/1.0 | 960 (+11%) | 6mo | $225,000 | $234 | 48 |
| 27510 X Ln | 0.67mi | 2/2.0 | 961 (+11%) | 10mo | $330,000 | $343 | 42 |
| 27418 V St | 0.54mi | 1/1.0 (-1) | 952 (+10%) | 9mo | $225,000 | $236 | 41 |
Match score weights: distance 35% · size 25% · config 20% · recency 20%. Top-matched comps best support the ARV.
Projected returns pro-forma
-3.0% appreciation · 3.0% rent growth · sell at horizon
- IRR
- -14.3%
- Equity multiple
- 0.49×
- Total profit
- $-42,721
- Equity at exit
- $44,582
- IRR
- -5.6%
- Equity multiple
- 0.64×
- Total profit
- $-30,181
- Equity at exit
- $25,852
Cash invested: $83,720 (down + closing). Projections, not guarantees.
Landlord ↔ Tenant lean methodology
- Overall (STATE)
- 28 Tenant-Leaning
- State Washington
- 28 Tenant-Leaning · D+8
- County
- — inherits STATE
- City
- — inherits STATE
ZIP-level market 98640
- Home prices YoY
- -26.7%
- Active inventory
- 320
- Price-to-rent
- 10.4×
Monthly cashflow live
- Estimated rent
- $2,392 medium interval (Pro) →
- Mortgage (P&I)
- −$1,568
- Tax from tax record
- −$105 /mo · $1,261/yr
- Insurance
- −$125
- HOA
- −$0
- Vacancy / Maint / Mgmt
- −$502
- Net cashflow
- $92
Break-even live
Sensitivity live
| Price | -10% $261 | -5% $177 | +0% $92 | +5% $7 | +10% $-77 |
|---|---|---|---|---|---|
| Rent | -10% $-97 | -5% $-2 | +0% $92 | +5% $186 | +10% $281 |
| Rate | -1.0pp $243 | -0.5pp $168 | base $92 | +0.5pp $15 | +1.0pp $-64 |
UW: 25.0% down · 7.5% · 30yr · 1.5% tax · 5.0% vac · 8.0% maint · 8.0% mgmt
Financing live
Cash to close
- Down payment
- $74,750
- Closing costs
- $8,970
- Reserves months
- —
- Total cash needed
- —
Loan-product check · same deal, 3 products live
Conventional
25% down · 7.5% · 30yr
- Down + closing
- —
- Monthly P&I
- —
- Monthly cashflow
- —
- DSCR
- —
- Eligible?
- —
Personal DTI + credit; lowest rate.
DSCR
20% down · 8.5% · 30yr
- Down + closing
- —
- Monthly P&I
- —
- Monthly cashflow
- —
- DSCR
- —
- Eligible?
- —
No personal income docs; deal must DSCR.
Hard money
10% down · 12.0% · 12mo
- Down + closing
- —
- Monthly P&I
- —
- Monthly cashflow
- —
- DSCR
- —
- Eligible?
- —
Short-term bridge; refi at stabilization.
Rent comps 2 comps
| Address | Beds | Baths | Sqft | Rent | $/sqft | DOM | Units | Dist |
|---|---|---|---|---|---|---|---|---|
| 24904 J Pl Ocean Park, WA | 2.0 | 1.0 | 900 | $2,900 | $3.22 | 45d | 1 | 0.90mi |
| 29014 S Ln Ocean Park, WA | 2.0 | 1.0 | 924 | $1,700 | $1.84 | 45d | 1 | 1.20mi |
Listing history 20 events
-
2026-05-17price $299,000
-
2026-04-02$314,000 Active
-
2012-11-15historical
-
2012-11-14soldstatus $50,000 Sold 149-char remark
Show marketing remark (149 chars)
Clam diggers retreat! Cute & Cozy, located on west side of Vernon just 6 blocks north of Bay Avenue in Ocean Park. Sleeps 4 - 6 with rom for RV's
-
2012-11-14soldstatus $50,000 Sold
Show marketing remark (149 chars)
Clam diggers retreat! Cute & Cozy, located on west side of Vernon just 6 blocks north of Bay Avenue in Ocean Park. Sleeps 4 - 6 with rom for RV's
-
2012-11-14soldstatus $50,000
Show marketing remark (149 chars)
Clam diggers retreat! Cute & Cozy, located on west side of Vernon just 6 blocks north of Bay Avenue in Ocean Park. Sleeps 4 - 6 with rom for RV's
-
2012-10-26status Pending
Show marketing remark (149 chars)
Clam diggers retreat! Cute & Cozy, located on west side of Vernon just 6 blocks north of Bay Avenue in Ocean Park. Sleeps 4 - 6 with rom for RV's
-
2012-10-26status Pending 149-char remark
Show marketing remark (149 chars)
Clam diggers retreat! Cute & Cozy, located on west side of Vernon just 6 blocks north of Bay Avenue in Ocean Park. Sleeps 4 - 6 with rom for RV's
-
2012-09-20price $64,950
Show marketing remark (149 chars)
Clam diggers retreat! Cute & Cozy, located on west side of Vernon just 6 blocks north of Bay Avenue in Ocean Park. Sleeps 4 - 6 with rom for RV's
-
2012-09-20price $64,950 149-char remark
Show marketing remark (149 chars)
Clam diggers retreat! Cute & Cozy, located on west side of Vernon just 6 blocks north of Bay Avenue in Ocean Park. Sleeps 4 - 6 with rom for RV's
-
2012-08-23price $69,500
-
2012-08-22price $69,500 149-char remark
Show marketing remark (149 chars)
Clam diggers retreat! Cute & Cozy, located on west side of Vernon just 6 blocks north of Bay Avenue in Ocean Park. Sleeps 4 - 6 with rom for RV's
-
2012-03-09price $79,900
Show marketing remark (149 chars)
Clam diggers retreat! Cute & Cozy, located on west side of Vernon just 6 blocks north of Bay Avenue in Ocean Park. Sleeps 4 - 6 with rom for RV's
-
2012-03-09price $79,900 149-char remark
Show marketing remark (149 chars)
Clam diggers retreat! Cute & Cozy, located on west side of Vernon just 6 blocks north of Bay Avenue in Ocean Park. Sleeps 4 - 6 with rom for RV's
-
2011-11-09price $89,000
-
2011-11-08price $89,000 149-char remark
Show marketing remark (149 chars)
Clam diggers retreat! Cute & Cozy, located on west side of Vernon just 6 blocks north of Bay Avenue in Ocean Park. Sleeps 4 - 6 with rom for RV's
-
2011-08-08price $99,500
Show marketing remark (149 chars)
Clam diggers retreat! Cute & Cozy, located on west side of Vernon just 6 blocks north of Bay Avenue in Ocean Park. Sleeps 4 - 6 with rom for RV's
-
2011-08-08price $99,500 149-char remark
Show marketing remark (149 chars)
Clam diggers retreat! Cute & Cozy, located on west side of Vernon just 6 blocks north of Bay Avenue in Ocean Park. Sleeps 4 - 6 with rom for RV's
-
2010-10-14$115,000 Active
Show marketing remark (149 chars)
Clam diggers retreat! Cute & Cozy, located on west side of Vernon just 6 blocks north of Bay Avenue in Ocean Park. Sleeps 4 - 6 with rom for RV's
-
2010-10-14$115,000 Active 149-char remark
Show marketing remark (149 chars)
Clam diggers retreat! Cute & Cozy, located on west side of Vernon just 6 blocks north of Bay Avenue in Ocean Park. Sleeps 4 - 6 with rom for RV's
ⓘ Source: listings_history table (triggers on properties + properties_extension) + one-shot
backfill from property_details.listing_events for pre-trigger history.
Tax reassessment forecast WA · Resets to sale price
- Current annual tax
- $1,261 · $105/mo
- Projected year-2 tax
- $2,930 · $244/mo
- Expected delta
- +$1,669/yr (+$139/mo · 132.3%)
ⓘ Screening estimate from a state-policy table — verify with the county assessor before closing.
Climate risk First Street
- Flood 6/10 Major FEMA zone X (unshaded) · 74% chance over 30 yrs
- Wildfire 1/10 Low
- Heat 1/10 Low 8 d/yr ≥74°F today · 17 d/yr by 30 yrs out
- Wind 1/10 Low
- Air quality 5/10 Major 6 unhealthy d/yr today · 6 by 30 yrs out
Nearby sold comps map
Loading sold comps map…
Walkable amenities ~0.75 mi
Loading nearby amenities…
Taxation est. · year 1
- Rental income
- $28,704
- − Mortgage interest
- −$16,749
- − Property taxes
- −$1,261
- − Insurance
- −$1,495
- − Repairs & maintenance
- −$2,296
- − Management
- −$2,296
- − Depreciation
- −$8,698
- Taxable loss
- −$4,092
- Est. tax savings @ 24.0%
- +$982
- After-tax cash flow
- $2,086/yr
For passive investors: Depreciation is non-cash, so a rental often shows a tax loss while cash-flowing — sheltering income. Rental losses are passive: they offset passive income freely, and up to $25,000/yr can offset ordinary (W-2) income if you actively participate and your MAGI is under $100k (phasing out to $0 by $150k); unused losses carry forward. On sale, claimed depreciation is recaptured at up to 25%, and gains may owe capital-gains tax (a 1031 exchange can defer both). Figures are a year-1 estimate at your 24.0% rate — not tax advice; consult a CPA.
Schools (NCES district)
- District
- Ocean Beach School District
- NCES district ID
- 5306060
- Math proficiency
- 34% ▼ -1.00%
- Reading proficiency
- 50% ▲ 1.00%
- Median HH income
- $38,549
- Composite
- 37.37/100
- National rank
- #8929
- State rank
- #212 of 291 in WA
Livability — Ocean Park
- Score
- 72/100
- State rank
- #216
- US rank
- #6161
Category grades
Schools grade is shown separately in the Schools card above.
Census & demographics
- Census place
- Ocean Park, WA
- Population (ZIP)
- 5,107
Population outlook (Pacific County) Hauer SSP2
- Today (2025)
- 20,636 people
- By 2030
- 20,137 · -2.4%
- By 2040
- 19,041 · -7.7%
- By 2050
- 18,504 · -10.3%
- By 2075
- 17,403 · -15.7%
- By 2100
- 16,241 · -21.3%
Race, ethnicity, and origin ACS 2023
- Neighborhood character
- Predominantly White (88%)
- Race & ethnicity
- White 88% Two or more races 6% Hispanic / Latino 6% Asian 3%
- Hispanic origin (detail)
- Mexican 5%
- Common ancestry
- Portuguese 5% Lithuanian 4% Slovak 4%
- Foreign-born
- 7% · Canada, China
- Languages at home
- 92% English-only · Spanish 4% Chinese 1% German/W. Germanic 1%
Political lean MEDSL · Pacific
- 2024 margin
- Toss-up / Even · D 48.1% · R 49.4% · Other 2.4%
- 2008→2024 swing
- -15.4pp toward R · 2008: 14.1pp · 2024: -1.3pp
- All cycles
- 2024: R+1.3 2020: R+1.1 2016: R+6.9 2012: D+11.4 2008: D+14.1
Not yet ingested
- Civics
- —
Market trends
- HPI YoY
- ▼ -81.15%
- Current HPI
- 222.8758
- Rent YoY
- —
- Metro
- —
- State GDP YoY
- ▲ 4.65%
- F500 in state
- 22
Industry mix (Fortune 500 HQ in WA)
| Industry | F500 HQs | Revenue |
|---|---|---|
| Retail | 2 | $269B |
|
||
| Technology / Retail | 1 | $638B |
|
||
| Technology | 1 | $245B |
|
||
| Telecommunications | 1 | $38B |
|
||
| Food / Beverage | 1 | $36B |
|
||
| Automotive / Trucks | 1 | $34B |
|
||
Price history
+160.0% since first listed20 events — show timeline
- 2026-05-17 Price Changed $299,000 NWMLS as Distributed by MLS Grid
- 2026-04-02 Listed $314,000 NWMLS as Distributed by MLS Grid
- 2012-11-15 Delisted — NWMLS as Distributed by MLS Grid
- 2012-11-14 Sold (Public Records) $50,000 Public Records
- 2012-11-14 Sold (MLS) $50,000 NWMLS as Distributed by MLS Grid
- 2012-11-14 Sold (MLS) $50,000 RMLS
- 2012-10-26 Pending — NWMLS as Distributed by MLS Grid
- 2012-10-26 Pending — RMLS
- 2012-09-20 Price Changed $64,950 NWMLS as Distributed by MLS Grid
- 2012-09-20 Price Changed $64,950 RMLS
- 2012-08-23 Price Changed $69,500 NWMLS as Distributed by MLS Grid
- 2012-08-22 Price Changed $69,500 RMLS
- 2012-03-09 Price Changed $79,900 NWMLS as Distributed by MLS Grid
- 2012-03-09 Price Changed $79,900 RMLS
- 2011-11-09 Price Changed $89,000 NWMLS as Distributed by MLS Grid
- 2011-11-08 Price Changed $89,000 RMLS
- 2011-08-08 Price Changed $99,500 NWMLS as Distributed by MLS Grid
- 2011-08-08 Price Changed $99,500 RMLS
- 2010-10-14 Listed $115,000 NWMLS as Distributed by MLS Grid
- 2010-10-14 Listed $115,000 RMLS
Property tax history
+2.7%/yrLatest (2026): $1,261 · -3.1% YoY. Source: county tax records.
Cash-flow waterfall
monthlySold comps — $/sqft
last 12 mo · ≤1 miLoading sold comps…