 🏗️ New Construction
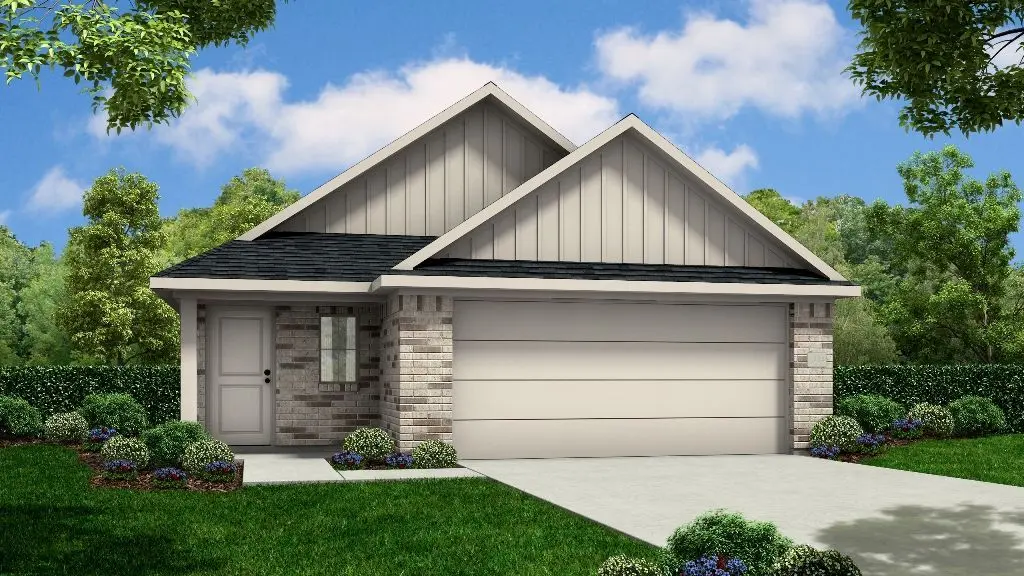
The Blue Jay Plan · Tomball, TX
Flood risk No data
- FEMA flood zone
- —
- Chance of flooding over 30 yrs
- —
- Est. flood insurance / yr
- —
Fire risk No data
- Est. fire insurance / yr
- —
Heat risk No data
- Hot days now (above threshold)
- —
- Hot days in 30 yrs
- —
Wind risk No data
- Chance of severe wind over 30 yrs
- —
Air-quality risk No data
- Unhealthy air days now
- —
- Unhealthy air days in 30 yrs
- —
Risk factors via First Street. Map © Google.
Why this score? — see what drove the D grade
The composite is a weighted blend of 9 inputs, each scored 0–100. Each bar is that input's sub-score; the figure is the points it added to the 100-point composite (weight × sub-score).
- Appreciation +10.0/10.0
- Cash flow +7.8/30.0
- ARV discount +7.5/15.0
- Condition / age +5.0/5.0
- Schools +3.9/10.0
- Livability +3.8/5.0
- Rent growth +2.6/5.0
- 1% rule +2.4/10.0
- DSCR +1.9/10.0
$246,990
🖨 Deal sheet (PDF) 📄 Offer letter ✓ Due diligence
Listing remarks MLS
The efficient layout of the Blue Jay plan features an open concept kitchen, dining, and family room. A convenient pocket office is located at the front of the home separating it from the bedrooms and kitchen/dining area that can be converted into a powder bathroom or additional garage storage space. The three bedrooms and two full baths are located on one side of the home, creating ample room for the spacious family room at the heart of this plan.
Key facts
- 2 garage spots
- Listed 956 days
Neighborhood map
What this means for you Summary
Snapshot
- This is a 3-bed/2.0-bath single-family listed at $247k. Condition is rated excellent.
Deal economics
- At list price, monthly cash flow is $-303 ($-4k/yr) — negative.
- To cash-flow at today's rent, offer at most $234k (5.3% below list).
- To meet the 1% rule (rent ≥ 1% of price), the offer needs to be $205k (17.2% below list).
- Recommended offer: $205k (17.2% below list) — sets the bar for 1% rule.
- Cap rate 5.0% vs local median 2.7% in Tomball — top-decile yield for the area; either an underpriced asset or a hidden risk that comps aren't pricing in. Stress-test before assuming the spread holds.
Location & tenants
- Location reads 75/100 on livability (#155 in TX, #4,239 nationally) — a middle-class / working-renter tenant base. Strengths: cost of living A+, housing A+, health & safety B+; Watch: amenities F, commute F.
- Magnolia ISD (rural): math 42% / reading 45% proficiency, ranked #247 of 826 in TX (top 30%) — families likely to look elsewhere, expect single-tenant / working-renter base with shorter leases.
- Zoned schools: Cedric C Smith (math 48% / reading 42%, grade D-, #1,133 of 4,322 statewide, top 27%, 724 students, 55% FRL); Bear Branch J H (math 44% / reading 46%, grade D, #479 of 1,662 statewide, top 29%, 1,076 students, 37% FRL); Magnolia H S (math 47% / reading 62%, grade C-, #379 of 1,632 statewide, top 26%, 2,248 students, 31% FRL) — zoned schools at 41% FRL track the district average.
- Market conditions: Rents flat; 1622 active listings in the ZIP; 2 comparable units currently listed for rent nearby; high-income renter base; 13,259 units permitted in Montgomery County in 2024 (1,402 in 5+ unit buildings).
Forward outlook
- In year one you build about $30k of equity ($2k loan paydown + $28k appreciation (10.0% local appreciation)).
- Montgomery County population projected at +65% by 2050 — long-run rental-demand tailwind backs the buy-and-hold thesis.
- By year 2, paydown + projected appreciation supports a ~$48k cash-out refi (75% LTV) — recoverable capital for the next deal without selling this one.
Negotiation context
- It's been on market 956 days — a 12% lower offer ($217k) is reasonable based on typical stale-listing flexibility.
Questions for the listing agent
- What do current leases actually rent for vs. the listed asking? Can we see a recent rent roll and the last 12 months of T-12 income?
- It's been on market 956 days. Have you received any prior offers? Is the seller open to a 17% concession, seller financing, or rate buy-down credit?
- Why hasn't it sold? Are there any deal-killer items the seller is aware of (foundation, flood, title, zoning, code violations)?
- Is there a deadline driving the sale (1031 exchange, divorce, estate, relocation)? That informs how much negotiation room exists.
- Schools are B-rated — typically a magnet for longer-tenancy family renters. What's the average tenant stay here, and is there a school-zone premium baked into asking?
- The area grade is low — what's the realistic commute time and amenity access for the typical tenant pool here? Any planned neighborhood developments (good or bad) we should know about?
- What's the average days-on-market for RENTAL listings here right now (not sales)? A rising rental-DOM trend means longer vacancies and softer asking-rent achievability than the comps imply.
- What's the recent tenant-quality profile in this submarket — average credit score on applications, eviction rate, late-payment / NSF rate, and stable-employment percentage? A property-management company in the area should have these aggregated.
- How much new for-sale + rental construction is in the pipeline within 1–3 miles? Heavy new supply typically softens prices + rents 12–24 months out; constrained supply supports both.
Investment metrics
- 1% rule
- 0.74% ✗
- Cap rate
- 4.98%
- Cash-on-cash
- -4.68%
- DSCR
- 0.79
- GRM
- 11.3
CMA / ARV
- ARV (median comp)
- $277,779
- List price
- $246,990
- Delta
- -11.08%
- Verdict
- UNDERPRICED
- Comps
- 20 within 1.0 mi
Show comp detail 12 sales within ~0.75 mi
| Address | Dist | Beds/Ba | Sqft | Sold | Price | $/sf | Match |
|---|---|---|---|---|---|---|---|
| 27076 Badger Way | 0.10mi | 3/2.0 | 1,490 (-1%) | 7mo | $249,243 | $167 | 89 |
| 10010 Cottontail Ct | 0.11mi | 3/2.0 | 1,538 (+2%) | 5mo | $239,990 | $156 | 86 |
| 10033 Swift Fox Ct | 0.13mi | 3/2.0 | 1,693 (+13%) | 3mo | $274,900 | $162 | 70 |
| 10272 Badger Run Ln | 0.45mi | 3/2.0 | 1,427 (-5%) | 3mo | $280,260 | $196 | 69 |
| 10249 Badger Run Ln | 0.42mi | 3/2.0 | 1,566 (+4%) | 7mo | $266,475 | $170 | 68 |
| 10228 Badger Run Ln | 0.42mi | 3/2.0 | 1,427 (-5%) | 7mo | $249,662 | $175 | 66 |
| 10288 Badger Run Ln | 0.44mi | 3/2.5 | 1,597 (+6%) | 5mo | $256,724 | $161 | 62 |
| 27219 Mockingbird Terrace Ln | 0.37mi | 3/2.0 | 1,640 (+9%) | 6mo | $279,725 | $171 | 62 |
| 27398 Axis Deer Trl | 0.39mi | 3/2.0 | 1,350 (-10%) | 6mo | $239,730 | $178 | 60 |
| 27394 Axis Deer Trl | 0.38mi | 3/2.0 | 1,689 (+13%) | 6mo | $262,542 | $155 | 56 |
| 10260 Badger Run Ln | 0.44mi | 4/2.0 (+1) | 1,689 (+13%) | 4mo | $281,125 | $166 | 50 |
| 27390 Axis Deer Trl | 0.38mi | 4/2.0 (+1) | 1,689 (+13%) | 8mo | $277,325 | $164 | 50 |
Match score weights: distance 35% · size 25% · config 20% · recency 20%. Top-matched comps best support the ARV.
Projected returns pro-forma
10.0% appreciation · 0.32% rent growth · sell at horizon
- IRR
- 20.2%
- Equity multiple
- 2.63×
- Total profit
- $126,616
- Equity at exit
- $250,245
- IRR
- 17.9%
- Equity multiple
- 5.86×
- Total profit
- $378,373
- Equity at exit
- $539,663
Cash invested: $77,778 (down + closing). Projections, not guarantees.
Landlord ↔ Tenant lean methodology
- Overall (STATE)
- 87 Strongly Landlord-Friendly
- State Texas
- 87 Strongly Landlord-Friendly · R+5
- County
- — inherits STATE
- City
- — inherits STATE
ZIP-level market 77354
- Home prices YoY
- 2.4%
- Rents YoY
- 0.3%
- Active inventory
- 1622
- Price-to-rent
- 10.1×
Monthly cashflow live
- Estimated rent
- $2,046 medium interval (Pro) →
- Mortgage (P&I)
- −$1,457
- Tax est. 1.5%
- −$347 /mo · $4,167/yr
- Insurance
- −$116
- HOA
- −$0
- Vacancy / Maint / Mgmt
- −$430
- Net cashflow
- $-303
Break-even live
Sensitivity live
| Price | -10% $-111 | -5% $-207 | +0% $-303 | +5% $-399 | +10% $-495 |
|---|---|---|---|---|---|
| Rent | -10% $-465 | -5% $-384 | +0% $-303 | +5% $-223 | +10% $-142 |
| Rate | -1.0pp $-164 | -0.5pp $-233 | base $-303 | +0.5pp $-375 | +1.0pp $-449 |
UW: 25.0% down · 7.5% · 30yr · 1.5% tax · 5.0% vac · 8.0% maint · 8.0% mgmt
Financing live
Cash to close
- Down payment
- $69,445
- Closing costs
- $8,333
- Reserves months
- —
- Total cash needed
- —
Loan-product check · same deal, 3 products live
Conventional
25% down · 7.5% · 30yr
- Down + closing
- —
- Monthly P&I
- —
- Monthly cashflow
- —
- DSCR
- —
- Eligible?
- —
Personal DTI + credit; lowest rate.
DSCR
20% down · 8.5% · 30yr
- Down + closing
- —
- Monthly P&I
- —
- Monthly cashflow
- —
- DSCR
- —
- Eligible?
- —
No personal income docs; deal must DSCR.
Hard money
10% down · 12.0% · 12mo
- Down + closing
- —
- Monthly P&I
- —
- Monthly cashflow
- —
- DSCR
- —
- Eligible?
- —
Short-term bridge; refi at stabilization.
Rent comps 2 comps
| Address | Beds | Baths | Sqft | Rent | $/sqft | DOM | Units | Dist |
|---|---|---|---|---|---|---|---|---|
| 9733 Grosbeak Ln Magnolia, TX | 3.0 | 2.0 | 1302 | $1,798 | $1.38 | 45d | 1 | 0.67mi |
| 9829 Glen Brook Ln Magnolia, TX | 4.0 | 2.0 | 1637 | $1,999 | $1.22 | 4d | 1 | 0.70mi |
Listing history 21 events
-
2026-06-21days on market $246,990 Active 956 DOM
-
2026-06-18days on market $246,990 Active 953 DOM
-
2026-06-17days on market $246,990 Active 952 DOM
-
2026-06-16days on market $246,990 Active 951 DOM
-
2026-06-15days on market $246,990 Active 950 DOM
-
2026-06-13days on market $246,990 Active 948 DOM
-
2026-06-09days on market $246,990 Active 944 DOM
-
2026-06-08days on market $246,990 Active 943 DOM
-
2026-06-07days on market $246,990 Active 942 DOM
-
2026-06-04days on market $246,990 Active 939 DOM
-
2026-06-03days on market $246,990 Active 938 DOM
-
2026-06-02days on market $246,990 Active 937 DOM
-
2026-06-01days on market $246,990 Active 936 DOM
-
2026-05-31days on market $246,990 Active 935 DOM
-
2024-05-20price $246,990 451-char remark
Show marketing remark (451 chars)
The efficient layout of the Blue Jay plan features an open concept kitchen, dining, and family room. A convenient pocket office is located at the front of the home separating it from the bedrooms and kitchen/dining area that can be converted into a powder bathroom or additional garage storage space. The three bedrooms and two full baths are located on one side of the home, creating ample room for the spacious family room at the heart of this plan.
-
2024-04-27price $241,990 451-char remark
Show marketing remark (451 chars)
The efficient layout of the Blue Jay plan features an open concept kitchen, dining, and family room. A convenient pocket office is located at the front of the home separating it from the bedrooms and kitchen/dining area that can be converted into a powder bathroom or additional garage storage space. The three bedrooms and two full baths are located on one side of the home, creating ample room for the spacious family room at the heart of this plan.
-
2024-04-01price $237,990 451-char remark
Show marketing remark (451 chars)
The efficient layout of the Blue Jay plan features an open concept kitchen, dining, and family room. A convenient pocket office is located at the front of the home separating it from the bedrooms and kitchen/dining area that can be converted into a powder bathroom or additional garage storage space. The three bedrooms and two full baths are located on one side of the home, creating ample room for the spacious family room at the heart of this plan.
-
2024-03-04price $234,990 451-char remark
Show marketing remark (451 chars)
The efficient layout of the Blue Jay plan features an open concept kitchen, dining, and family room. A convenient pocket office is located at the front of the home separating it from the bedrooms and kitchen/dining area that can be converted into a powder bathroom or additional garage storage space. The three bedrooms and two full baths are located on one side of the home, creating ample room for the spacious family room at the heart of this plan.
-
2024-02-01price $232,990 451-char remark
Show marketing remark (451 chars)
The efficient layout of the Blue Jay plan features an open concept kitchen, dining, and family room. A convenient pocket office is located at the front of the home separating it from the bedrooms and kitchen/dining area that can be converted into a powder bathroom or additional garage storage space. The three bedrooms and two full baths are located on one side of the home, creating ample room for the spacious family room at the heart of this plan.
-
2023-11-20price $229,990 451-char remark
Show marketing remark (451 chars)
The efficient layout of the Blue Jay plan features an open concept kitchen, dining, and family room. A convenient pocket office is located at the front of the home separating it from the bedrooms and kitchen/dining area that can be converted into a powder bathroom or additional garage storage space. The three bedrooms and two full baths are located on one side of the home, creating ample room for the spacious family room at the heart of this plan.
-
2023-11-08$249,990 Active 451-char remark
Show marketing remark (451 chars)
The efficient layout of the Blue Jay plan features an open concept kitchen, dining, and family room. A convenient pocket office is located at the front of the home separating it from the bedrooms and kitchen/dining area that can be converted into a powder bathroom or additional garage storage space. The three bedrooms and two full baths are located on one side of the home, creating ample room for the spacious family room at the heart of this plan.
ⓘ Source: listings_history table (triggers on properties + properties_extension) + one-shot
backfill from property_details.listing_events for pre-trigger history.
Nearby sold comps map
Loading sold comps map…
Walkable amenities ~0.75 mi
Loading nearby amenities…
Taxation est. · year 1
- Rental income
- $24,550
- − Mortgage interest
- −$15,560
- − Property taxes
- −$4,167
- − Insurance
- −$1,389
- − Repairs & maintenance
- −$1,964
- − Management
- −$1,964
- − Depreciation
- −$8,081
- Taxable loss
- −$8,574
- Est. tax savings @ 24.0%
- +$2,058
- After-tax cash flow
- $-1,584/yr
For passive investors: Depreciation is non-cash, so a rental often shows a tax loss while cash-flowing — sheltering income. Rental losses are passive: they offset passive income freely, and up to $25,000/yr can offset ordinary (W-2) income if you actively participate and your MAGI is under $100k (phasing out to $0 by $150k); unused losses carry forward. On sale, claimed depreciation is recaptured at up to 25%, and gains may owe capital-gains tax (a 1031 exchange can defer both). Figures are a year-1 estimate at your 24.0% rate — not tax advice; consult a CPA.
Condition & rehab AI · 7 photos
The Blue Jay Plan is in excellent condition with no visible repairs or maintenance needed. It offers a good investment opportunity with high potential for both resale and rental value.
Value-add opportunities
- Both Painting exterior and interior — Enhances curb appeal and interior aesthetics
- Both Landscaping improvements — Enhances curb appeal and adds value
- Both New flooring — Improves living space and adds value
- Both New kitchen appliances — Enhances functionality and adds value
Renovation cost estimate screening
Value-add ROI direction
- Both Painting exterior and interior — Enhances curb appeal and interior aesthetics ↑
- Both Landscaping improvements — Enhances curb appeal and adds value ↑
- Both New flooring — Improves living space and adds value ↑
- Both New kitchen appliances — Enhances functionality and adds value ↑
ⓘ Cost ranges are severity-bucket heuristics (US national rule-of-thumb). Get contractor quotes + a written scope before underwriting a rehab budget.
Schools (NCES district)
- District
- Magnolia ISD
- NCES district ID
- 4828740
- Math proficiency
- 42% ▼ -7.00%
- Reading proficiency
- 45% ▼ -4.00%
- Median HH income
- $71,692
- Composite
- 39.46/100
- National rank
- #3958
- State rank
- #247 of 826 in TX
Livability — Tomball
- Score
- 75/100
- State rank
- #155
- US rank
- #4239
Category grades
Schools grade is shown separately in the Schools card above.
Census & demographics
- County
- Montgomery County · 663,713 people
- City population
- 113,991
- Metro
- Houston-The Woodlands-Sugar Land, TX
- Population (ZIP)
- 44,900
- Household income
- $112,504
- Rent vs Own
- Severe rent burden
- 586.0
Population outlook (Montgomery County) Hauer SSP2
- Today (2025)
- 713,896 people
- By 2030
- 805,263 · +12.8%
- By 2040
- 992,708 · +39.1%
- By 2050
- 1,179,590 · +65.2%
- By 2075
- 1,628,084 · +128.1%
- By 2100
- 1,937,880 · +171.5%
Race, ethnicity, and origin ACS 2023
- Neighborhood character
- Predominantly White (66%)
- Race & ethnicity
- White 66% Hispanic / Latino 25% Two or more races 18% Black 3% Asian 1%
- Hispanic origin (detail)
- Mexican 14% Puerto Rican 1%
- Common ancestry
- Lithuanian 4% Slovak 2% Italian 2%
- Foreign-born
- 11% · Canada, Vietnam
- Languages at home
- 83% English-only · Spanish 15% Other Indo-European 1% German/W. Germanic 1%
Political lean MEDSL · Montgomery
- 2024 margin
- Solid R (+45.5) · D 26.8% · R 72.3%
- 2008→2024 swing
- +7.2pp toward D · 2008: -52.7pp · 2024: -45.5pp
- All cycles
- 2024: R+45.5 2020: R+43.8 2016: R+51.4 2012: R+60.7 2008: R+52.7
Not yet ingested
- Civics
- —
Market trends
- HPI YoY
- ▲ 12.09%
- Current HPI
- 512.87
- Rent YoY
- ▲ 0.32%
- Metro
- Houston-The Woodlands-Sugar Land, TX
- State GDP YoY
- ▲ 3.95%
- F500 in state
- 110
Industry mix (Fortune 500 HQ in TX)
| Industry | F500 HQs | Revenue |
|---|---|---|
| Energy | 16 | $1,198B |
|
||
| Technology | 5 | $198B |
|
||
| Engineering / Construction | 4 | $72B |
|
||
| Energy Services | 3 | $60B |
|
||
| Utilities | 3 | $41B |
|
||
| Healthcare | 2 | $330B |
|
||
Price history
-1.2% since first listed7 events — show timeline
- 2024-05-20 Price Changed $246,990 Zillow
- 2024-04-27 Price Changed $241,990 Zillow
- 2024-04-01 Price Changed $237,990 Zillow
- 2024-03-04 Price Changed $234,990 Zillow
- 2024-02-01 Price Changed $232,990 Zillow
- 2023-11-20 Price Changed $229,990 Zillow
- 2023-11-08 Listed $249,990 Zillow
Cash-flow waterfall
monthlySold comps — $/sqft
last 12 mo · ≤1 miLoading sold comps…