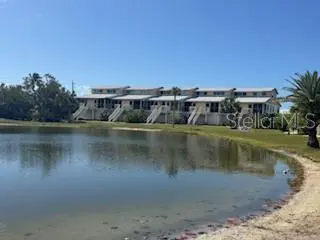
9400 Little Gasparilla Is Unit I-9 · Rotonda, FL
Flood risk 10/10 · Severe
- FEMA flood zone
- AE
- Chance of flooding over 30 yrs
- 0.99%
- Est. flood insurance / yr
- $1,737 – $8,500
Fire risk 1/10 · Minimal
- Est. fire insurance / yr
- $947 – $1,759
Heat risk 10/10 · Severe
- Hot days now (above 107°F)
- 7 days/yr
- Hot days in 30 yrs
- 26 days/yr
Wind risk 10/10 · Severe
- Chance of severe wind over 30 yrs
- 99.0%
Air-quality risk 3/10 · Minor
- Unhealthy air days now
- 2 days/yr
- Unhealthy air days in 30 yrs
- 2 days/yr
Risk factors via First Street. Map © Google.
Why this score? — see what drove the B- grade
The composite is a weighted blend of 9 inputs, each scored 0–100. Each bar is that input's sub-score; the figure is the points it added to the 100-point composite (weight × sub-score).
- Cash flow +24.1/30.0
- 1% rule +9.5/10.0
- DSCR +7.8/10.0
- ARV discount +7.5/15.0
- Schools +4.6/10.0
- Appreciation +4.0/10.0
- Condition / age +3.8/5.0
- Livability +3.4/5.0
- Rent growth +2.5/5.0
$465,000
🖨 Deal sheet 📄 Offer letter ✓ Due diligence
Listing remarks
Little Gasparilla Island is not simply a destination; it is a lifestyle that feels increasingly rare in today's world. Accessible only by a short ferry ride from the mainland, this hidden barrier island invites you to leave behind traffic, schedules, and the constant demands of everyday life. Within minutes, the pace slows, the noise fades, and island living takes over. Here, there are no crowded roads, no high rises, and no rush. Days are spent shelling along miles of uncrowded beaches, fishing Gulf waters, exploring by golf cart, and ending each evening with breathtaking sunsets. Whether you are seeking a winter escape, a peaceful vacation retreat, or an investment property, Little Gaspar
Key facts
- Quartz countertops
- Pristine beaches
- $1,198 HOA
Tags
Property features AI
Finance
- Other: Furnished; Association name: Leslie Phillips
- Financial info: Lease restrictions apply
- HOA & community: Quarterly association fees (association covers guard/24-hour, common area taxes, pool, escrow reserves, insurance, internet, structure & grounds maintenance, management, pest control, sewer, trash); Monthly condo fee amount listed as $1,199 (total monthly fees shown $1,198.67); Total annual HOA/association fees shown as $14,384; Has HOA; Clubhouse; Pool; Deed restrictions; Golf carts allowed; Pets allowed (max ~120 lbs); Full-time management
Exterior
- Parking: No designated parking
- Security: 24-hour guard
- Utilities: Private water; Private sewer; Electricity connected
- Home design: Condominium; Residential property; Two stories; Unit on 1st floor; East-facing
- Construction: Wood siding; Shingle roof; Pillar/post/pier foundation; Completed condition; Built as part of Hideaway Bay Beach (building: HIDEAWAY BAY BEACH)
- Exterior features: Covered patio/porch; Balcony; Fire pit; Outdoor grill; French doors; Sliding doors; Storage
Interior
- Kitchen: Dishwasher; Disposal; Ice maker; Microwave; Range; Refrigerator
- Bedrooms: 2 bedrooms
- Flooring: Tile
- Bathrooms: 2 full bathrooms
- Heating & cooling: Central heating (electric); Central air
- Interior features: Ceiling fans; High ceilings; Open floorplan; Kitchen/family room combo; Solid wood cabinets; Vaulted ceilings; Window treatments; ENERGY STAR qualified windows; Tinted windows; Exhaust fan
- Laundry & utility: Washer hookup; Dryer hookup (electric); Outside laundry area; Electric water heater
Neighborhood map
What this means for you Summary
Snapshot
- This is a 2-bed/2.0-bath condo listed at $465k. Condition is rated good.
Deal economics
- At list price, monthly cash flow is $491 ($6k/yr) — positive.
- The deal already cash-flows at list — no discount required.
- Meets the 1% rule at list price ($7k rent vs $465k).
- Recommended offer: $451k (3.0% below list) — sets the bar for market timing.
- Cap rate 8.7% vs local median 3.1% in Rotonda — top-decile yield for the area; either an underpriced asset or a hidden risk that comps aren't pricing in. Stress-test before assuming the spread holds.
Location & tenants
- Location reads 67/100 on livability (#548 in FL) — a middle-class / working-renter tenant base. Strengths: crime A+, housing A-, cost of living B+; Watch: amenities F, commute F, health & safety D-.
- Charlotte (suburban): math 54% / reading 54% proficiency, ranked #22 of 73 in FL (top 30%) — acceptable for families but not a draw, mixed tenant base, ~2y average lease.
- Zoned schools: Vineland Elementary School (math 74% / reading 67%, grade A-, #333 of 2,144 statewide, top 16%, 579 students, 45% FRL); Lemon Bay High School (math 50% / reading 56%, grade C-, #148 of 667 statewide, top 23%, 1,360 students, 28% FRL) — zoned schools average 37% FRL vs 54% district-wide (17 pts lower); this property's tenant base skews higher-income than the district average.
- Market conditions: 915 active listings in the ZIP; 4 comparable units currently listed for rent nearby; rentals at typical pace (median 21d on market — plan ~3-4 weeks tenant-placement turnaround); 4,585 units permitted in Charlotte County in 2024 (703 in 5+ unit buildings).
Forward outlook
- Local home prices are declining (-1.9%/yr); year-one equity from $3k of loan paydown is wiped out by about $9k of value loss. Plan a longer hold.
- Charlotte County population projected at +24% by 2050 — long-run rental-demand tailwind backs the buy-and-hold thesis.
Negotiation context
- It's been on market 50 days — a 3% lower offer ($451k) is reasonable based on typical stale-listing flexibility.
Risks & watch-outs
- Watch-outs: flood insurance adds $427/mo.
- Climate carrying-cost: in FEMA flood zone AE (mandatory federal flood insurance); severe wind risk, 99% chance of damaging wind over 30y; extreme-heat days projected 7→26/yr by 2055 (HVAC capex compounding) — expect insurance premiums to compound above CPI over the hold.
Questions for the listing agent
- It's been on market 50 days. Have you received any prior offers? Is the seller open to a 3% concession, seller financing, or rate buy-down credit?
- What's the actual annual flood-insurance premium (NFIP or private), and is the property in a SFHA with mandatory coverage?
- What does the HOA fee cover, when was the last increase, and are there any pending special assessments or reserve-fund shortfalls?
- Any open or pending special assessments — roof, HVAC, plumbing, elevator, façade? What's the per-unit balance and payoff schedule, and is the seller paying it off at close or rolling it to the buyer?
- Is there a deadline driving the sale (1031 exchange, divorce, estate, relocation)? That informs how much negotiation room exists.
- Schools are D-rated, which usually means shorter tenancies and higher turnover. Who's the typical renter profile here, and what's been the actual vacancy rate?
- What's the average days-on-market for RENTAL listings here right now (not sales)? A rising rental-DOM trend means longer vacancies and softer asking-rent achievability than the comps imply.
- What's the recent tenant-quality profile in this submarket — average credit score on applications, eviction rate, late-payment / NSF rate, and stable-employment percentage? A property-management company in the area should have these aggregated.
- How much new apartment / multifamily construction is in the pipeline within 1–3 miles? Heavy new supply (>2% of stock underway) typically softens rents 12–24 months out; light construction supports rent growth.
Investment metrics
- 1% rule
- 1.45% ✓
- Cap rate
- 8.66%
- Cash-on-cash
- 8.45%
- DSCR
- 1.38
- GRM
- 5.7
CMA / ARV
No comps found within radius.
Projected returns pro-forma
-1.9% appreciation · 3.0% rent growth · sell at horizon
- IRR
- -4.0%
- Equity multiple
- 0.84×
- Total profit
- $-21,310
- Equity at exit
- $92,397
- IRR
- 4.1%
- Equity multiple
- 1.35×
- Total profit
- $45,596
- Equity at exit
- $80,960
Cash invested: $130,200 (down + closing). Projections, not guarantees.
Landlord ↔ Tenant lean methodology
- Overall (STATE)
- 87 Strongly Landlord-Friendly
- State Florida
- 87 Strongly Landlord-Friendly · R+3
- County
- — inherits STATE
- City
- — inherits STATE
ZIP-level market 33946
- Home prices YoY
- -0.7%
- Active inventory
- 915
- Price-to-rent
- 5.7×
Monthly cashflow live
- Estimated rent
- $6,745 medium interval (Pro) →
- Mortgage (P&I)
- −$2,439
- Tax est. 1.5%
- −$581 /mo · $6,975/yr
- Insurance
- −$194
- Flood insurance flood zone
- −$427 /mo · $5,118/yr
- HOA
- −$1,198
- Vacancy / Maint / Mgmt
- −$1,417
- Net cashflow
- $491
Break-even live
UW: 25.0% down · 7.5% · 30yr · 1.5% tax · 5.0% vac · 8.0% maint · 8.0% mgmt
Financing live
Cash to close
- Down payment
- $116,250
- Closing costs
- $13,950
- Reserves months
- —
- Total cash needed
- —
Loan-product check · same deal, 3 products live
Conventional
25% down · 7.5% · 30yr
- Down + closing
- —
- Monthly P&I
- —
- Monthly cashflow
- —
- DSCR
- —
- Eligible?
- —
Personal DTI + credit; lowest rate.
DSCR
20% down · 8.5% · 30yr
- Down + closing
- —
- Monthly P&I
- —
- Monthly cashflow
- —
- DSCR
- —
- Eligible?
- —
No personal income docs; deal must DSCR.
Hard money
10% down · 12.0% · 12mo
- Down + closing
- —
- Monthly P&I
- —
- Monthly cashflow
- —
- DSCR
- —
- Eligible?
- —
Short-term bridge; refi at stabilization.
Rent comps 4 comps
| Address | Beds | Baths | Sqft | Rent | $/sqft | DOM | Units | Dist |
|---|---|---|---|---|---|---|---|---|
| 9400 Little Gasparilla Unit G9 Placida, FL | 2.0 | 2.0 | 946 | $6,900 | $7.29 | 21d | 1 | 0.03mi |
| 9400 Little Gasparilla Unit F9 Placida, FL | 2.0 | 2.0 | 946 | $6,500 | $6.87 | 21d | 1 | 0.04mi |
| 9400 Little Gasparilla Unit H8 Placida, FL | 2.0 | 2.0 | 946 | $5,850 | $6.18 | 21d | 1 | 0.04mi |
| 9750 Little Gasparilla Placida, FL | 3.0 | 1.5 | 957 | $10,000 | $10.45 | 21d | 1 | 0.33mi |
HOA detail condo
- Monthly dues
- $1,198 · $14,376/yr
- Likely covers
- watergas
- Assessments
- None detected in remarks — confirm with the listing agent.
Listing history 17 events
-
2026-06-18days on market $465,000 Active 50 DOM
-
2026-06-17days on market $465,000 Active 49 DOM
-
2026-06-16days on market $465,000 Active 48 DOM
-
2026-06-15days on market $465,000 Active 47 DOM
-
2026-06-14days on market $465,000 Active 45 DOM
-
2026-06-13days on market $465,000 Active 44 DOM
-
2026-06-10days on market $465,000 Active 42 DOM
-
2026-06-09days on market $465,000 Active 41 DOM
-
2026-06-08days on market $465,000 Active 40 DOM
-
2026-06-07days on market $465,000 Active 39 DOM
-
2026-06-05days on market $465,000 Active 36 DOM
-
2026-06-03days on market $465,000 Active 35 DOM
-
2026-06-02days on market $465,000 Active 34 DOM
-
2026-06-01days on market $465,000 Active 33 DOM
-
2026-05-31days on market $465,000 Active 32 DOM
-
2026-05-30days on market $465,000 Active 31 DOM
-
2026-04-29$465,000 Active
ⓘ Source: listings_history table (triggers on properties + properties_extension) + one-shot
backfill from property_details.listing_events for pre-trigger history.
Climate risk First Street
- Flood 10/10 Extreme FEMA zone AE · 99% chance over 30 yrs
- Wildfire 1/10 Low
- Heat 10/10 Extreme 7 d/yr ≥107°F today · 26 d/yr by 30 yrs out
- Wind 10/10 Extreme 99% chance of damaging wind over 30 yrs
- Air quality 3/10 Moderate 2 unhealthy d/yr today · 2 by 30 yrs out
Nearby sold comps map
Loading sold comps map…
Walkable amenities ~0.75 mi
Loading nearby amenities…
Taxation est. · year 1
- Rental income
- $80,945
- − Mortgage interest
- −$26,047
- − Property taxes
- −$6,975
- − Insurance
- −$7,444
- − Repairs & maintenance
- −$6,476
- − Management
- −$6,476
- − HOA
- −$14,376
- − Depreciation
- −$13,527
- Taxable loss
- −$375
- Est. tax savings @ 24.0%
- +$90
- After-tax cash flow
- $5,980/yr
For passive investors: Depreciation is non-cash, so a rental often shows a tax loss while cash-flowing — sheltering income. Rental losses are passive: they offset passive income freely, and up to $25,000/yr can offset ordinary (W-2) income if you actively participate and your MAGI is under $100k (phasing out to $0 by $150k); unused losses carry forward. On sale, claimed depreciation is recaptured at up to 25%, and gains may owe capital-gains tax (a 1031 exchange can defer both). Figures are a year-1 estimate at your 24.0% rate — not tax advice; consult a CPA.
Condition & rehab AI · 11 photos
This recently updated two-bedroom, two-bath condominium is in good condition with a good ROI potential for both resale and rental.
Value-add opportunities
- Both paint exterior — enhances curb appeal and resale value
- Both trim landscaping — improves curb appeal and rental appeal
Renovation cost estimate screening
Value-add ROI direction
- Both paint exterior — enhances curb appeal and resale value ↑
- Both trim landscaping — improves curb appeal and rental appeal ↑
ⓘ Cost ranges are severity-bucket heuristics (US national rule-of-thumb). Get contractor quotes + a written scope before underwriting a rehab budget.
Schools (NCES district)
- District
- Charlotte
- NCES district ID
- 1200240
- Math proficiency
- 54% ▼ -6.00%
- Reading proficiency
- 54% ▼ -1.00%
- Median HH income
- $44,864
- Composite
- 45.62/100
- National rank
- #2586
- State rank
- #22 of 73 in FL
Livability — Rotonda
- Score
- 67/100
- State rank
- #548
- US rank
- #10359
Category grades
Schools grade is shown separately in the Schools card above.
Census & demographics
- City population
- 10,490
- Population (ZIP)
- 2,745
Population outlook (Charlotte County) Hauer SSP2
- Today (2025)
- 198,646 people
- By 2030
- 210,507 · +6.0%
- By 2040
- 230,857 · +16.2%
- By 2050
- 247,148 · +24.4%
- By 2075
- 281,777 · +41.8%
- By 2100
- 293,609 · +47.8%
Race, ethnicity, and origin ACS 2023
- Neighborhood character
- Predominantly White (95%)
- Race & ethnicity
- White 95% Hispanic / Latino 2% Asian 1% Two or more races 1%
- Common ancestry
- Italian 3% Romanian 2% Russian 2%
- Foreign-born
- 6% · Canada
- Languages at home
- 91% English-only · Russian/Polish/Slavic 5% Spanish 1% French/Haitian/Cajun 1%
Political lean MEDSL · Charlotte
- 2024 margin
- Solid R (+34.0) · D 32.7% · R 66.7%
- 2008→2024 swing
- -26.7pp toward R · 2008: -7.2pp · 2024: -34.0pp
- All cycles
- 2024: R+34.0 2020: R+26.6 2016: R+27.8 2012: R+14.3 2008: R+7.2
Not yet ingested
- Civics
- —
Market trends
- HPI YoY
- ▼ -1.90%
- Current HPI
- 288.559
- Rent YoY
- —
- Metro
- —
- State GDP YoY
- ▲ 3.28%
- F500 in state
- 36
Industry mix (Fortune 500 HQ in FL)
| Industry | F500 HQs | Revenue |
|---|---|---|
| Industrial Technology | 2 | $29B |
|
||
| Insurance | 2 | $17B |
|
||
| Retail | 1 | $60B |
|
||
| Technology Distribution | 1 | $58B |
|
||
| Homebuilding | 1 | $35B |
|
||
| Technology Manufacturing | 1 | $35B |
|
||
Price history
1 event — show timeline
- 2026-04-29 Listed $465,000 Stellar MLS as Distributed by MLS Grid
Cash-flow waterfall
monthlySold comps — $/sqft
last 12 mo · ≤1 miLoading sold comps…