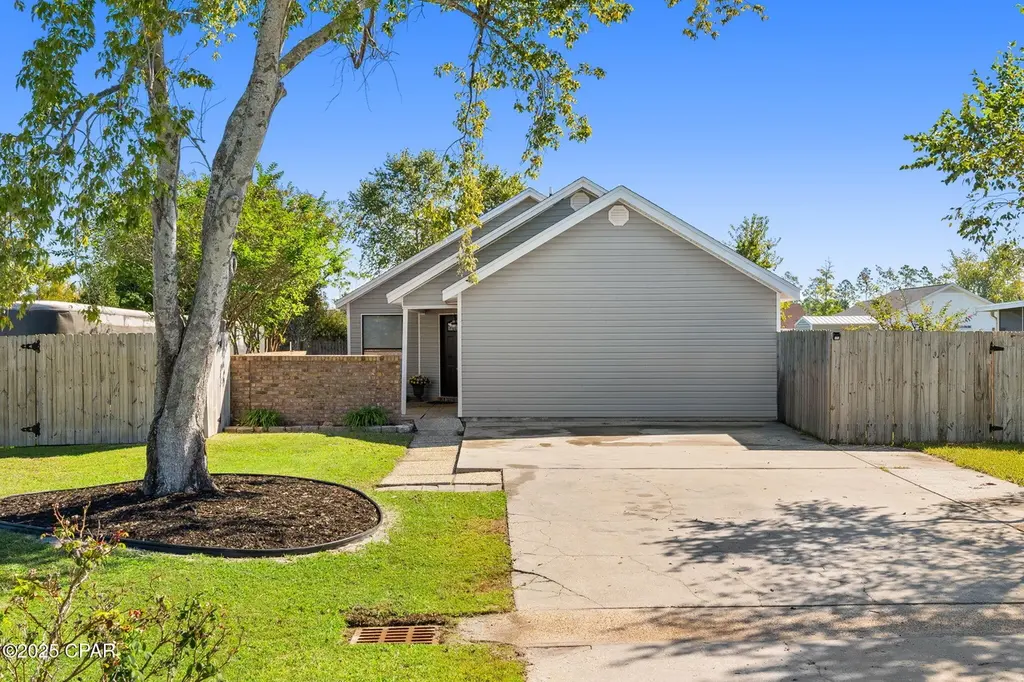
4005 Par Dr · Callaway, FL
Flood risk 5/10 · Moderate
- FEMA flood zone
- X (unshaded)
- Chance of flooding over 30 yrs
- 0.24%
- Est. flood insurance / yr
- $507 – $1,088
Fire risk 6/10 · Moderate
- Est. fire insurance / yr
- $947 – $1,759
Heat risk 10/10 · Severe
- Hot days now (above 104°F)
- 7 days/yr
- Hot days in 30 yrs
- 22 days/yr
Wind risk 10/10 · Severe
- Chance of severe wind over 30 yrs
- 99.0%
Air-quality risk 1/10 · Minimal
- Unhealthy air days now
- 0 days/yr
- Unhealthy air days in 30 yrs
- 0 days/yr
Risk factors via First Street. Map © Google.
Why this score? — see what drove the D grade
The composite is a weighted blend of 9 inputs, each scored 0–100. Each bar is that input's sub-score; the figure is the points it added to the 100-point composite (weight × sub-score).
- Cash flow +18.5/30.0
- DSCR +5.8/10.0
- Schools +4.3/10.0
- 1% rule +3.8/10.0
- Livability +3.2/5.0
- Rent growth +2.8/5.0
- Condition / age +2.5/5.0
- ARV discount +1.1/15.0
- Appreciation +0.0/10.0
$249,900
🖨 Deal sheet (PDF) 📄 Offer letter ✓ Due diligence
Listing remarks MLS
Charming 3BR/2BA Home on a Spacious Cul-de-Sac Lot!Welcome home to 4005 Par Dr, a beautifully maintained 3-bedroom, 2-bath residence located on a quiet cul-de-sac in Panama City. This inviting home offers privacy, comfort, and convenience — perfect for anyone looking to enjoy Florida living at an affordable price. Step inside to find a bright, open floor plan with fresh interior paint and recent updates throughout, giving the home a modern and welcoming feel. The kitchen opens to the dining and living areas, creating a great flow for entertaining or family gatherings. The property features a large fenced-in backyard, ideal for pets, children, or weekend barbecues. The cul-de-sac setting provides minimal traffic and a peaceful atmosphere. Located just 15-20 minutes from shopping, dining, and local amenities, this home offers both tranquility and convenience. Whether you're a first-time homebuyer, downsizing, or looking for an investment opportunity, this home checks all the boxes!
Key facts
- Cul-de-sac lot
- Open floor plan
- Quiet atmosphere
Tags
Neighborhood map
What this means for you Summary
Snapshot
- This is a 3-bed/2.0-bath single-family listed at $250k.
Deal economics
- At list price, monthly cash flow is $237 ($3k/yr) — positive.
- The deal already cash-flows at list — no discount required.
- To meet the 1% rule (rent ≥ 1% of price), the offer needs to be $220k (11.8% below list).
- Recommended offer: $220k (12.0% below list) — sets the bar for market timing.
- Cap rate 7.4% vs local median 5.1% in Callaway — top-decile yield for the area; either an underpriced asset or a hidden risk that comps aren't pricing in. Stress-test before assuming the spread holds.
Location & tenants
- Location reads 64/100 on livability (#690 in FL) — a middle-class / working-renter tenant base. Strengths: cost of living A+, housing A+; Watch: employment D+, amenities F, commute F.
- Bay (suburban): math 51% / reading 51% proficiency, ranked #29 of 73 in FL (top 40%) — acceptable for families but not a draw, mixed tenant base, ~2y average lease.
- Zoned schools: Callaway Elementary School (math 37% / reading 42%, grade F, #1,513 of 2,144 statewide, top 73%, 511 students, 72% FRL); Rutherford High School (math 24% / reading 29%, grade F, #489 of 667 statewide, top 74%, 1,337 students, 63% FRL) — zoned schools average 68% FRL vs 48% district-wide (19 pts higher); higher-poverty schools than district average — tighter screening recommended.
- Zoned-school proficiency averages 33% at this address vs 51% district-wide (-18 pts) — the specific schools serving this property underperform the Bay average; the district grade overstates school quality for this exact location.
- Market conditions: Rents rising (+1.1%/yr); 983 active listings in the ZIP; 2 comparable units currently listed for rent nearby; 2,473 units permitted in Bay County in 2024 (559 in 5+ unit buildings).
- This rent runs 35% of the median local income ($75k/yr) — at the standard rent-burdened threshold; future hikes will face affordability resistance.
Forward outlook
- Local home prices are declining (-3.0%/yr); year-one equity from $2k of loan paydown is wiped out by about $7k of value loss. Plan a longer hold.
- Bay County population projected at +24% by 2050 — long-run rental-demand tailwind backs the buy-and-hold thesis.
Negotiation context
- It's been on market 246 days — a 12% lower offer ($220k) is reasonable based on typical stale-listing flexibility.
- 5 sale attempts since 21y ago with the ask held roughly flat each time — persistent listings suggest the price (not the market) is what's stuck; bring a comps-based counter.
- Current owner paid $119k; list at $250k implies a 110% gain — meaningful room to come down on a strong offer.
Risks & watch-outs
- Climate carrying-cost: moderate flood risk; severe wind risk, 99% chance of damaging wind over 30y; major wildfire risk; extreme-heat days projected 7→22/yr by 2055 (HVAC capex compounding) — expect insurance premiums to compound above CPI over the hold.
Questions for the listing agent
- It's been on market 246 days. Have you received any prior offers? Is the seller open to a 12% concession, seller financing, or rate buy-down credit?
- Why hasn't it sold? Are there any deal-killer items the seller is aware of (foundation, flood, title, zoning, code violations)?
- Is there a deadline driving the sale (1031 exchange, divorce, estate, relocation)? That informs how much negotiation room exists.
- Schools are F-rated, which usually means shorter tenancies and higher turnover. Who's the typical renter profile here, and what's been the actual vacancy rate?
- The area grade is low — what's the realistic commute time and amenity access for the typical tenant pool here? Any planned neighborhood developments (good or bad) we should know about?
- What's the average days-on-market for RENTAL listings here right now (not sales)? A rising rental-DOM trend means longer vacancies and softer asking-rent achievability than the comps imply.
- What's the recent tenant-quality profile in this submarket — average credit score on applications, eviction rate, late-payment / NSF rate, and stable-employment percentage? A property-management company in the area should have these aggregated.
- How much new for-sale + rental construction is in the pipeline within 1–3 miles? Heavy new supply typically softens prices + rents 12–24 months out; constrained supply supports both.
Investment metrics
- 1% rule
- 0.88% ✗
- Cap rate
- 7.43%
- Cash-on-cash
- 4.06%
- DSCR
- 1.18
- GRM
- 9.5
CMA / ARV
- ARV (median comp)
- $218,744
- List price
- $249,900
- Delta
- 14.24%
- Verdict
- OVERPRICED
- Comps
- 19 within 1.0 mi
Show comp detail 2 sales within ~0.75 mi
| Address | Dist | Beds/Ba | Sqft | Sold | Price | $/sf | Match |
|---|---|---|---|---|---|---|---|
| 12027 Country Club Dr | 0.27mi | 3/2.0 | 1,408 (+11%) | 18mo | $230,000 | $163 | 54 |
| 12340 Cue Dr | 0.72mi | 4/2.0 (+1) | 1,404 (+11%) | 13mo | $277,000 | $197 | 32 |
Match score weights: distance 35% · size 25% · config 20% · recency 20%. Top-matched comps best support the ARV.
Projected returns pro-forma
-3.0% appreciation · 1.12% rent growth · sell at horizon
- IRR
- -11.9%
- Equity multiple
- 0.58×
- Total profit
- $-29,598
- Equity at exit
- $37,261
- IRR
- -5.5%
- Equity multiple
- 0.67×
- Total profit
- $-22,929
- Equity at exit
- $21,607
Cash invested: $69,972 (down + closing). Projections, not guarantees.
Landlord ↔ Tenant lean methodology
- Overall (STATE)
- 87 Strongly Landlord-Friendly
- State Florida
- 87 Strongly Landlord-Friendly · R+3
- County
- — inherits STATE
- City
- — inherits STATE
ZIP-level market 32404
- Home prices YoY
- -16.1%
- Rents YoY
- 1.1%
- Active inventory
- 983
- Price-to-rent
- 9.5×
Monthly cashflow live
- Estimated rent
- $2,204 medium interval (Pro) →
- Mortgage (P&I)
- −$1,311
- Tax from tax record
- −$89 /mo · $1,070/yr
- Insurance
- −$104
- HOA
- −$0
- Vacancy / Maint / Mgmt
- −$463
- Net cashflow
- $237
Break-even live
Sensitivity live
| Price | -10% $378 | -5% $308 | +0% $237 | +5% $166 | +10% $95 |
|---|---|---|---|---|---|
| Rent | -10% $63 | -5% $150 | +0% $237 | +5% $324 | +10% $411 |
| Rate | -1.0pp $363 | -0.5pp $301 | base $237 | +0.5pp $172 | +1.0pp $106 |
UW: 25.0% down · 7.5% · 30yr · 1.5% tax · 5.0% vac · 8.0% maint · 8.0% mgmt
Financing live
Cash to close
- Down payment
- $62,475
- Closing costs
- $7,497
- Reserves months
- —
- Total cash needed
- —
Loan-product check · same deal, 3 products live
Conventional
25% down · 7.5% · 30yr
- Down + closing
- —
- Monthly P&I
- —
- Monthly cashflow
- —
- DSCR
- —
- Eligible?
- —
Personal DTI + credit; lowest rate.
DSCR
20% down · 8.5% · 30yr
- Down + closing
- —
- Monthly P&I
- —
- Monthly cashflow
- —
- DSCR
- —
- Eligible?
- —
No personal income docs; deal must DSCR.
Hard money
10% down · 12.0% · 12mo
- Down + closing
- —
- Monthly P&I
- —
- Monthly cashflow
- —
- DSCR
- —
- Eligible?
- —
Short-term bridge; refi at stabilization.
Rent comps 2 comps
| Address | Beds | Baths | Sqft | Rent | $/sqft | DOM | Units | Dist |
|---|---|---|---|---|---|---|---|---|
| 12013 Hauser Rd Panama City, FL | 3.0 | 2.0 | 1456 | $2,200 | $1.51 | 15d | 1 | 0.52mi |
| 1007 Bayside St Panama City, FL | 3.0 | 2.0 | 1520 | $1,900 | $1.25 | 15d | 1 | 1.26mi |
Listing history 29 events
-
2026-06-21days on market $249,900 Active 246 DOM
-
2026-06-19days on market $249,900 Active 244 DOM
-
2026-06-18days on market $249,900 Active 243 DOM
-
2026-06-17days on market $249,900 Active 242 DOM
-
2026-06-16days on market $249,900 Active 241 DOM
-
2026-06-15days on market $249,900 Active 240 DOM
-
2026-06-14days on market $249,900 Active 238 DOM
-
2026-06-13days on market $249,900 Active 237 DOM
-
2026-06-10days on market $249,900 Active 235 DOM
-
2026-06-09days on market $249,900 Active 234 DOM
-
2026-06-08days on market $249,900 Active 233 DOM
-
2026-06-07days on market $249,900 Active 232 DOM
-
2026-06-05days on market $249,900 Active 229 DOM
-
2026-06-03days on market $249,900 Active 228 DOM
-
2026-06-02days on market $249,900 Active 227 DOM
-
2026-06-01days on market $249,900 Active 226 DOM
-
2026-05-31days on market $249,900 Active 225 DOM
-
2026-05-30days on market $249,900 Active 224 DOM
-
2025-10-17$249,900 Active 1000-char remark
Show marketing remark (1000 chars)
Charming 3BR/2BA Home on a Spacious Cul-de-Sac Lot!Welcome home to 4005 Par Dr, a beautifully maintained 3-bedroom, 2-bath residence located on a quiet cul-de-sac in Panama City. This inviting home offers privacy, comfort, and convenience — perfect for anyone looking to enjoy Florida living at an affordable price. Step inside to find a bright, open floor plan with fresh interior paint and recent updates throughout, giving the home a modern and welcoming feel. The kitchen opens to the dining and living areas, creating a great flow for entertaining or family gatherings. The property features a large fenced-in backyard, ideal for pets, children, or weekend barbecues. The cul-de-sac setting provides minimal traffic and a peaceful atmosphere. Located just 15-20 minutes from shopping, dining, and local amenities, this home offers both tranquility and convenience. Whether you're a first-time homebuyer, downsizing, or looking for an investment opportunity, this home checks all the boxes!
-
2021-12-14historical
-
2021-12-14historical
-
2008-09-24soldstatus $119,000
-
2008-09-23soldstatus $119,000
-
2008-08-12$119,000
-
2008-07-28$145,000
-
2008-05-14$145,000
-
2005-09-30soldstatus $163,500
-
2005-08-29$159,000
-
1991-02-01soldstatus $51,000
ⓘ Source: listings_history table (triggers on properties + properties_extension) + one-shot
backfill from property_details.listing_events for pre-trigger history.
Tax reassessment forecast FL · Resets to sale price
- Current annual tax
- $1,070 · $89/mo
- Projected year-2 tax
- $2,074 · $173/mo
- Expected delta
- +$1,004/yr (+$84/mo · 93.8%)
ⓘ Screening estimate from a state-policy table — verify with the county assessor before closing.
Climate risk First Street
- Flood 5/10 Major FEMA zone X (unshaded) · 24% chance over 30 yrs
- Wildfire 6/10 Major
- Heat 10/10 Extreme 7 d/yr ≥104°F today · 22 d/yr by 30 yrs out
- Wind 10/10 Extreme 99% chance of damaging wind over 30 yrs
- Air quality 1/10 Low 0 unhealthy d/yr today · 0 by 30 yrs out
Nearby sold comps map
Loading sold comps map…
Walkable amenities ~0.75 mi
Loading nearby amenities…
Taxation est. · year 1
- Rental income
- $26,442
- − Mortgage interest
- −$13,998
- − Property taxes
- −$1,070
- − Insurance
- −$1,250
- − Repairs & maintenance
- −$2,115
- − Management
- −$2,115
- − Depreciation
- −$7,270
- Taxable loss
- −$1,376
- Est. tax savings @ 24.0%
- +$330
- After-tax cash flow
- $3,174/yr
For passive investors: Depreciation is non-cash, so a rental often shows a tax loss while cash-flowing — sheltering income. Rental losses are passive: they offset passive income freely, and up to $25,000/yr can offset ordinary (W-2) income if you actively participate and your MAGI is under $100k (phasing out to $0 by $150k); unused losses carry forward. On sale, claimed depreciation is recaptured at up to 25%, and gains may owe capital-gains tax (a 1031 exchange can defer both). Figures are a year-1 estimate at your 24.0% rate — not tax advice; consult a CPA.
Schools (NCES district)
- District
- Bay
- NCES district ID
- 1200090
- Math proficiency
- 51% ▼ -8.00%
- Reading proficiency
- 51% ▼ -7.00%
- Median HH income
- $47,740
- Composite
- 43.41/100
- National rank
- #3014
- State rank
- #29 of 73 in FL
Livability — Callaway
- Score
- 64/100
- State rank
- #690
- US rank
- #14384
Category grades
Schools grade is shown separately in the Schools card above.
Census & demographics
- County
- Bay County · 163,593 people
- City population
- 91,445
- Metro
- Panama City, FL
- Population (ZIP)
- 42,514
- Household income
- $74,708
- Rent vs Own
- Severe rent burden
- 1218.0
Population outlook (Bay County) Hauer SSP2
- Today (2025)
- 206,264 people
- By 2030
- 217,740 · +5.6%
- By 2040
- 238,738 · +15.7%
- By 2050
- 255,545 · +23.9%
- By 2075
- 288,295 · +39.8%
- By 2100
- 288,638 · +39.9%
Race, ethnicity, and origin ACS 2023
- Neighborhood character
- Predominantly White (69%)
- Race & ethnicity
- White 69% Black 12% Two or more races 10% Hispanic / Latino 9% Asian 3%
- Hispanic origin (detail)
- Mexican 2% Puerto Rican 3%
- Common ancestry
- Lithuanian 3% Slovak 2% Italian 2%
- Foreign-born
- 7% · Canada, Vietnam, Mexico
- Languages at home
- 90% English-only · Spanish 6% Vietnamese 1% Other Asian/Pacific 1%
Political lean MEDSL · Bay
- 2024 margin
- Solid R (+47.4) · D 25.8% · R 73.1% · Other 1.1%
- 2008→2024 swing
- -6.6pp toward R · 2008: -40.7pp · 2024: -47.4pp
- All cycles
- 2024: R+47.4 2020: R+43.5 2016: R+46.3 2012: R+43.6 2008: R+40.7
Not yet ingested
- Civics
- —
Market trends
- HPI YoY
- ▼ -50.59%
- Current HPI
- 263.7178
- Rent YoY
- ▲ 1.12%
- Metro
- Panama City, FL
- State GDP YoY
- ▲ 3.28%
- F500 in state
- 36
Industry mix (Fortune 500 HQ in FL)
| Industry | F500 HQs | Revenue |
|---|---|---|
| Industrial Technology | 2 | $29B |
|
||
| Insurance | 2 | $17B |
|
||
| Retail | 1 | $60B |
|
||
| Technology Distribution | 1 | $58B |
|
||
| Homebuilding | 1 | $35B |
|
||
| Technology Manufacturing | 1 | $35B |
|
||
Price history
+390.0% since first listed11 events — show timeline
- 2025-10-17 Listed $249,900 CPARMLS
- 2021-12-14 Listing Removed — CPARMLS
- 2021-12-14 Listing Removed — CPARMLS
- 2008-09-24 Sold (Public Records) $119,000 Public Records
- 2008-09-23 Sold (MLS) $119,000 CPARMLS
- 2008-08-12 Listed $119,000 CPARMLS
- 2008-07-28 Listed $145,000 CPARMLS
- 2008-05-14 Listed $145,000 CPARMLS
- 2005-09-30 Sold (MLS) $163,500 CPARMLS
- 2005-08-29 Listed $159,000 CPARMLS
- 1991-02-01 Sold (Public Records) $51,000 Public Records
Property tax history
-3.1%/yrLatest (2025): $1,070 · +8.6% YoY. Source: county tax records.
Cash-flow waterfall
monthlySold comps — $/sqft
last 12 mo · ≤1 miLoading sold comps…