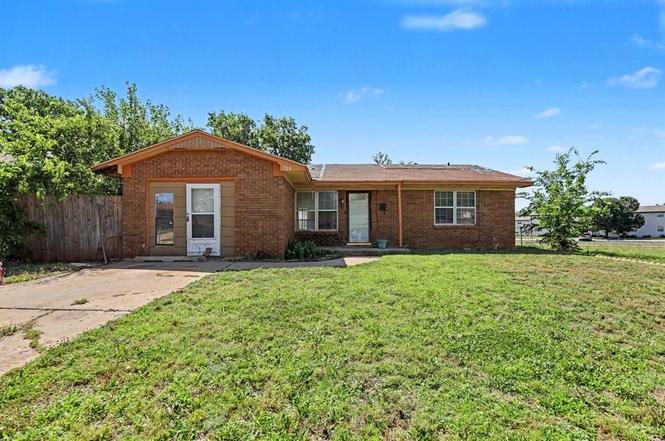
704 NE Katherine Pl · Oklahoma City, OK
Flood risk 3/10 · Minor
- FEMA flood zone
- X (unshaded)
- Chance of flooding over 30 yrs
- 0.2%
- Est. flood insurance / yr
- $507 – $1,088
Fire risk 4/10 · Minor
- Est. fire insurance / yr
- $2,463 – $4,575
Heat risk 6/10 · Moderate
- Hot days now (above 107°F)
- 7 days/yr
- Hot days in 30 yrs
- 19 days/yr
Wind risk 2/10 · Minimal
- Chance of severe wind over 30 yrs
- 4.0%
Air-quality risk 2/10 · Minimal
- Unhealthy air days now
- 2 days/yr
- Unhealthy air days in 30 yrs
- 2 days/yr
Risk factors via First Street. Map © Google.
Why this score? — see what drove the B+ grade
The composite is a weighted blend of 9 inputs, each scored 0–100. Each bar is that input's sub-score; the figure is the points it added to the 100-point composite (weight × sub-score).
- Cash flow +30.0/30.0
- ARV discount +15.0/15.0
- 1% rule +10.0/10.0
- DSCR +10.0/10.0
- Livability +4.0/5.0
- Rent growth +3.4/5.0
- Condition / age +2.5/5.0
- Schools +0.7/10.0
- Appreciation +0.0/10.0
$80,000
🖨 Deal sheet (PDF) 📄 Offer letter ✓ Due diligence
Listing remarks
Investor Opportunity in a Growing Area! This 3-bedroom, 1-bath home offers approximately 1,233 square feet of living space and excellent potential for investors, landlords, or buyers looking for a project. The converted garage provides additional flexible living space that could be used as a second living area, game room, office, or potential fourth bedroom. The laundry area is also located within the converted garage space. Location is a standout feature of this property. Situated just minutes from downtown Oklahoma City and conveniently located near major highway access, you'll enjoy quick access to some of the area's most popular entertainment destinations, including Chicken N Pickle, Fl
Key facts
- Laundry area
- Converted garage
- Major highway access
Tags
Property features AI
Finance
- Other: Homestead exempt; Not historically designated; Storm shelter not present
- Financial info: Sold as-is; eligible for Cash or Conventional financing
- HOA & community: No mandatory association dues
Exterior
- Parking: Concrete parking
- Utilities: Electricity available; Natural gas available; Public utilities (water/sewer)
- Home design: Single family residence; One level; Faces west; Residential property
- Construction: Brick and frame construction; Composition roof; Slab foundation; Built (existing)
- Exterior features: Porch; Chain link fencing; Corner lot
Interior
- Kitchen: Free standing gas range/oven
- Bedrooms: 3 bedrooms
- Flooring: Carpet; Laminate
- Bathrooms: 1 full bathroom
- Heating & cooling: Window unit(s) for cooling
- Interior features: Inside utility; Porch
- Laundry & utility: Inside utility (laundry area)
Neighborhood map
What this means for you Summary
Snapshot
- This is a 3-bed/1.0-bath single-family listed at $80k.
Deal economics
- At list price, monthly cash flow is $498 ($6k/yr) — positive.
- The deal already cash-flows at list — no discount required.
- Meets the 1% rule at list price ($1k rent vs $80k).
- Cap rate 13.8% vs local median 3.7% in Oklahoma City — top-decile yield for the area; either an underpriced asset or a hidden risk that comps aren't pricing in. Stress-test before assuming the spread holds.
Location & tenants
- Location reads 80/100 on livability (#3 in OK, #1,635 nationally) — a professional / high-income tenant draw. Strengths: amenities A+, commute A+, cost of living A+; Watch: crime F.
- Oklahoma City (urban): math 7% / reading 10% proficiency, ranked #254 of 270 in OK (top 94%) — low school quality limits family demand, transient renter base, plan for 1-2y turnover; 82% free/reduced lunch — lower-income household profile, screen leases tightly.
- Zoned schools: M.L. King Jr. Es (math 12% / reading 8%, grade F, #711 of 845 statewide, top 87%, 450 students, 0% FRL); Douglass Hs (math 2% / reading 2%, grade F, #445 of 447 statewide, top 100%, 556 students, 0% FRL) — zoned schools average 0% FRL vs 82% district-wide (82 pts lower); this property's tenant base skews higher-income than the district average.
- Market conditions: Rents rising (+3.5%/yr); 150 active listings in the ZIP; 4 comparable units currently listed for rent nearby; rentals leasing fast (median 4d on market — plan ~1-2 weeks tenant-placement turnaround); 5,365 units permitted in Oklahoma County in 2024 (569 in 5+ unit buildings).
Forward outlook
- Local home prices are declining (-3.0%/yr); year-one equity from $553 of loan paydown is wiped out by about $2k of value loss. Plan a longer hold.
- Oklahoma County population projected at +41% by 2050 — long-run rental-demand tailwind backs the buy-and-hold thesis.
- At projected returns (-3.0% appreciation + 3.5% rent growth), your $22k cash investment doubles in ~5 years — after that, you're playing with house money.
Negotiation context
- Only 4 days on market — expect competitive offers; lowballing is unlikely to land.
Risks & watch-outs
- Climate carrying-cost: extreme-heat days projected 7→19/yr by 2055 (HVAC capex compounding) — expect insurance premiums to compound above CPI over the hold.
Questions for the listing agent
- Built in 1962 — when were the roof, HVAC, electrical panel, plumbing, and water heater last replaced?
- Is there a deadline driving the sale (1031 exchange, divorce, estate, relocation)? That informs how much negotiation room exists.
- Schools are F-rated, which usually means shorter tenancies and higher turnover. Who's the typical renter profile here, and what's been the actual vacancy rate?
- Crime grade is F in this area — have there been break-ins, vandalism, or insurance claims at this property in the last 3 years? What carrier currently insures it and at what premium?
- What's the average days-on-market for RENTAL listings here right now (not sales)? A rising rental-DOM trend means longer vacancies and softer asking-rent achievability than the comps imply.
- What's the recent tenant-quality profile in this submarket — average credit score on applications, eviction rate, late-payment / NSF rate, and stable-employment percentage? A property-management company in the area should have these aggregated.
- How much new for-sale + rental construction is in the pipeline within 1–3 miles? Heavy new supply typically softens prices + rents 12–24 months out; constrained supply supports both.
Investment metrics
- 1% rule
- 1.58% ✓
- Cap rate
- 13.76%
- Cash-on-cash
- 26.68%
- DSCR
- 2.19
- GRM
- 5.3
CMA / ARV
- ARV (on-the-fly)
- $96,876
- Comps found
- 1
Show comp detail 1 sale within ~0.75 mi
| Address | Dist | Beds/Ba | Sqft | Sold | Price | $/sf | Match |
|---|---|---|---|---|---|---|---|
| 912 NE Katherine Pl | 0.21mi | 3/1.0 | 939 (+5%) | 2mo | $101,200 | $108 | 80 |
Match score weights: distance 35% · size 25% · config 20% · recency 20%. Top-matched comps best support the ARV.
Projected returns pro-forma
-3.0% appreciation · 3.47% rent growth · sell at horizon
- IRR
- 21.0%
- Equity multiple
- 1.86×
- Total profit
- $19,342
- Equity at exit
- $11,928
- IRR
- 29.5%
- Equity multiple
- 3.68×
- Total profit
- $60,119
- Equity at exit
- $6,917
Cash invested: $22,400 (down + closing). Projections, not guarantees.
Landlord ↔ Tenant lean methodology
- Overall (STATE)
- 83 Strongly Landlord-Friendly
- State Oklahoma
- 83 Strongly Landlord-Friendly · R+20
- County
- — inherits STATE
- City
- — inherits STATE
ZIP-level market 73114
- Home prices YoY
- -12.5%
- Rents YoY
- 3.5%
- Active inventory
- 150
- Price-to-rent
- 5.3×
Monthly cashflow live
- Estimated rent
- $1,264 medium interval (Pro) →
- Mortgage (P&I)
- −$420
- Tax from tax record
- −$47 /mo · $569/yr
- Insurance
- −$33
- HOA
- −$0
- Vacancy / Maint / Mgmt
- −$265
- Net cashflow
- $498
Break-even live
Sensitivity live
| Price | -10% $543 | -5% $521 | +0% $498 | +5% $475 | +10% $453 |
|---|---|---|---|---|---|
| Rent | -10% $398 | -5% $448 | +0% $498 | +5% $548 | +10% $598 |
| Rate | -1.0pp $538 | -0.5pp $518 | base $498 | +0.5pp $477 | +1.0pp $456 |
UW: 25.0% down · 7.5% · 30yr · 1.5% tax · 5.0% vac · 8.0% maint · 8.0% mgmt
Financing live
Cash to close
- Down payment
- $20,000
- Closing costs
- $2,400
- Reserves months
- —
- Total cash needed
- —
Loan-product check · same deal, 3 products live
Conventional
25% down · 7.5% · 30yr
- Down + closing
- —
- Monthly P&I
- —
- Monthly cashflow
- —
- DSCR
- —
- Eligible?
- —
Personal DTI + credit; lowest rate.
DSCR
20% down · 8.5% · 30yr
- Down + closing
- —
- Monthly P&I
- —
- Monthly cashflow
- —
- DSCR
- —
- Eligible?
- —
No personal income docs; deal must DSCR.
Hard money
10% down · 12.0% · 12mo
- Down + closing
- —
- Monthly P&I
- —
- Monthly cashflow
- —
- DSCR
- —
- Eligible?
- —
Short-term bridge; refi at stabilization.
Rent comps 4 comps
| Address | Beds | Baths | Sqft | Rent | $/sqft | DOM | Units | Dist |
|---|---|---|---|---|---|---|---|---|
| 701 E Wilshire Blvd Oklahoma City, OK | 1.0–3.0 | 1.0 | 850 | $1,029 | $1.21 | 4d | 3 | 0.11mi |
| 8500 N Oklahoma Ave Oklahoma City, OK | 3.0 | 1.0–2.0 | 954 | $2,503 | $2.62 | 3d | 23 | 0.65mi |
| 333 NW 90th St Oklahoma City, OK | 3.0 | 1.5 | 1053 | $1,350 | $1.28 | 45d | 1 | 1.29mi |
| 9111 N Walker Ave Oklahoma City, OK | 3.0 | 1.5 | 1092 | $1,195 | $1.09 | 3d | 1 | 1.45mi |
Listing history 3 events
-
2026-06-21days on market $80,000 Active 4 DOM
-
2026-06-18remarks 699-char remark
-
2026-06-18$80,000 Active 1 DOM
ⓘ Source: listings_history table (triggers on properties + properties_extension) + one-shot
backfill from property_details.listing_events for pre-trigger history.
Tax reassessment forecast OK · Resets to sale price
- Current annual tax
- $569 · $47/mo
- Projected year-2 tax
- $720 · $60/mo
- Expected delta
- +$151/yr (+$13/mo · 26.5%)
ⓘ Screening estimate from a state-policy table — verify with the county assessor before closing.
Climate risk First Street
- Flood 3/10 Moderate FEMA zone X (unshaded) · 20% chance over 30 yrs
- Wildfire 4/10 Moderate
- Heat 6/10 Major 7 d/yr ≥107°F today · 19 d/yr by 30 yrs out
- Wind 2/10 Low 4% chance of damaging wind over 30 yrs
- Air quality 2/10 Low 2 unhealthy d/yr today · 2 by 30 yrs out
Nearby sold comps map
Loading sold comps map…
Walkable amenities ~0.75 mi
Loading nearby amenities…
Taxation est. · year 1
- Rental income
- $15,164
- − Mortgage interest
- −$4,481
- − Property taxes
- −$569
- − Insurance
- −$400
- − Repairs & maintenance
- −$1,213
- − Management
- −$1,213
- − Depreciation
- −$2,327
- Taxable income
- $4,960
- Est. tax owed @ 24.0%
- −$1,190
- After-tax cash flow
- $4,786/yr
For passive investors: Depreciation is non-cash, so a rental often shows a tax loss while cash-flowing — sheltering income. Rental losses are passive: they offset passive income freely, and up to $25,000/yr can offset ordinary (W-2) income if you actively participate and your MAGI is under $100k (phasing out to $0 by $150k); unused losses carry forward. On sale, claimed depreciation is recaptured at up to 25%, and gains may owe capital-gains tax (a 1031 exchange can defer both). Figures are a year-1 estimate at your 24.0% rate — not tax advice; consult a CPA.
Schools (NCES district)
- District
- Oklahoma City
- NCES district ID
- 4022770
- Math proficiency
- 7% ▼ -5.00%
- Reading proficiency
- 10% ▼ -6.00%
- Median HH income
- $35,606
- Composite
- 7.0/100
- National rank
- #9970
- State rank
- #254 of 270 in OK
Livability — Oklahoma City
- Score
- 80/100
- State rank
- #3
- US rank
- #1635
Category grades
Schools grade is shown separately in the Schools card above.
Census & demographics
- Census place
- Oklahoma City, OK
- County
- Oklahoma County · 771,644 people
- City population
- 498,656
- Metro
- Oklahoma City, OK
- Population (ZIP)
- 17,656
- Household income
- $54,936
- Rent vs Own
- Severe rent burden
- 1035.0
Population outlook (Oklahoma County) Hauer SSP2
- Today (2025)
- 911,875 people
- By 2030
- 982,413 · +7.7%
- By 2040
- 1,130,468 · +24.0%
- By 2050
- 1,288,422 · +41.3%
- By 2075
- 1,711,482 · +87.7%
- By 2100
- 2,088,448 · +129.0%
Race, ethnicity, and origin ACS 2023
- Neighborhood character
- Highly diverse neighborhood (Simpson 0.71)
- Race & ethnicity
- Black 41% White 29% Hispanic / Latino 20% Two or more races 12% Native American 3%
- Hispanic origin (detail)
- Mexican 16% Puerto Rican 1%
- Common ancestry
- Russian 1% Slovak 1% Italian 1%
- Foreign-born
- 12% · Canada, Jamaica
- Languages at home
- 78% English-only · Spanish 18%
Political lean MEDSL · Oklahoma
- 2024 margin
- Toss-up / Even · D 48.0% · R 49.7% · Other 2.3%
- 2008→2024 swing
- +15.1pp toward D · 2008: -16.8pp · 2024: -1.7pp
- All cycles
- 2024: R+1.7 2020: R+1.1 2016: R+10.5 2012: R+16.7 2008: R+16.8
Not yet ingested
- Civics
- —
Market trends
- HPI YoY
- ▼ -44.26%
- Current HPI
- 310.4705
- Rent YoY
- ▲ 3.47%
- Metro
- Oklahoma City, OK
- State GDP YoY
- ▲ 1.55%
- F500 in state
- 6
Industry mix (Fortune 500 HQ in OK)
| Industry | F500 HQs | Revenue |
|---|---|---|
| Energy | 3 | $48B |
|
||
Price history
1 event — show timeline
- 2026-06-17 Listed $80,000 MLSOK
Property tax history
+9.1%/yrLatest (2025): $569 · +4.1% YoY. Source: county tax records.
Cash-flow waterfall
monthlySold comps — $/sqft
last 12 mo · ≤1 miLoading sold comps…