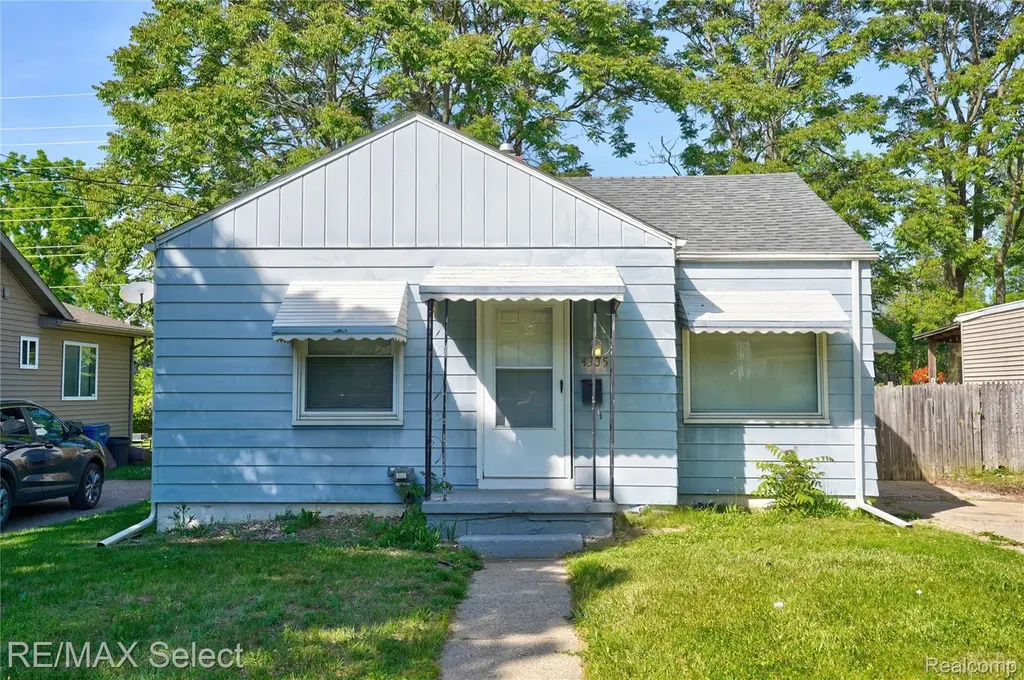
4305 Pengelly Rd · Flint, MI
Flood risk 1/10 · Minimal
- FEMA flood zone
- X (unshaded)
- Chance of flooding over 30 yrs
- 0.0%
- Est. flood insurance / yr
- $473 – $860
Fire risk 1/10 · Minimal
- Est. fire insurance / yr
- $784 – $1,456
Heat risk 2/10 · Minimal
- Hot days now (above 97°F)
- 7 days/yr
- Hot days in 30 yrs
- 15 days/yr
Wind risk 2/10 · Minimal
- Chance of severe wind over 30 yrs
- —
Air-quality risk 3/10 · Minor
- Unhealthy air days now
- 3 days/yr
- Unhealthy air days in 30 yrs
- 4 days/yr
Risk factors via First Street. Map © Google.
Why this score? — see what drove the C- grade
The composite is a weighted blend of 9 inputs, each scored 0–100. Each bar is that input's sub-score; the figure is the points it added to the 100-point composite (weight × sub-score).
- Cash flow +24.0/30.0
- DSCR +7.7/10.0
- 1% rule +6.0/10.0
- ARV discount +5.6/15.0
- Livability +3.7/5.0
- Condition / age +2.5/5.0
- Rent growth +2.2/5.0
- Schools +1.1/10.0
- Appreciation +0.0/10.0
$79,900
🖨 Deal sheet 📄 Offer letter ✓ Due diligence
Listing remarks MLS
Great, 2 bedroom, 1.5 bath ranch ready for you to move right in!! Crisp and clean with neutral colors and vinyl plank flooring throughout. Situated on a nice lot with fenced backyard, mature trees, shed and a deck for relaxing or entertaining. Won't last long. .. .call for your private appointment today!
Key facts
- Deck for relaxing
- Shed
- Fenced backyard
Tags
Property features AI
Finance
- Other: Paved road access; Subdivision: DIXIELAND; Directions: South of Atherton, East of Saginaw
- Financial info: Tax details not included
- HOA & community: HOA information not specified
Exterior
- Parking: No garage
- Security: Security features not specified
- Utilities: Public water; Public sewer
- Home design: Single-family residence; One level; Ground-level entry with steps
- Construction: Aluminum siding; Block foundation; Asphalt roof; Built on lot approximately 0.1 acres (45 x 100)
- Exterior features: Deck; Back yard fencing (fenced); Shed(s)
Interior
- Kitchen: Kitchen details not specified
- Bedrooms: Bedrooms not specified
- Flooring: Flooring details not specified
- Bathrooms: 1 full bathroom; 1 half bathroom
- Heating & cooling: Forced air heating; Natural gas heating; No central cooling
- Interior features: Full, partially finished basement; Total of 4 rooms
- Laundry & utility: Laundry details not specified
Neighborhood map
What this means for you Summary
Snapshot
- This is a 2-bed/1.5-bath single-family listed at $80k.
Deal economics
- At list price, monthly cash flow is $156 ($2k/yr) — positive.
- The deal already cash-flows at list — no discount required.
- Meets the 1% rule at list price ($880 rent vs $80k).
- Cap rate 8.6% vs local median 11.5% in Flint — below-typical yield; the buyer is paying a premium for something (appreciation thesis, condition, location) that the cap rate doesn't capture.
Location & tenants
- Location reads 74/100 on livability (#196 in MI, #4,946 nationally) — a middle-class / working-renter tenant base. Strengths: commute A+, cost of living A+, housing A+; Watch: schools F, crime F, employment F.
- Flint School District (urban): math 7% / reading 13% proficiency, ranked #714 of 760 in MI (top 94%) — low school quality limits family demand, transient renter base, plan for 1-2y turnover; 83% free/reduced lunch — lower-income household profile, screen leases tightly.
- Market conditions: Rents soft (-1.0%/yr); 206 active listings in the ZIP; 4 comparable units currently listed for rent nearby; rentals leasing fast (median 14d on market — plan ~1-2 weeks tenant-placement turnaround); 419 units permitted in Genesee County in 2024 (68 in 5+ unit buildings).
Forward outlook
- Local home prices are declining (-3.0%/yr); year-one equity from $552 of loan paydown is wiped out by about $2k of value loss. Plan a longer hold.
- Genesee County population projected at -27% by 2050 — secular population decline; favor cash flow + early exit over multi-decade hold.
Negotiation context
- Only 4 days on market — expect competitive offers; lowballing is unlikely to land.
- 8 sale attempts since 29y ago with the ask held roughly flat each time — persistent listings suggest the price (not the market) is what's stuck; bring a comps-based counter.
- Current owner paid $49k; list at $80k implies a 63% gain — meaningful room to come down on a strong offer.
Risks & watch-outs
- Watch-outs: built in 1950 — expect roof / HVAC / electrical / plumbing capex.
Questions for the listing agent
- Built in 1950 — when were the roof, HVAC, electrical panel, plumbing, and water heater last replaced?
- Is there a deadline driving the sale (1031 exchange, divorce, estate, relocation)? That informs how much negotiation room exists.
- Schools are F-rated, which usually means shorter tenancies and higher turnover. Who's the typical renter profile here, and what's been the actual vacancy rate?
- Crime grade is F in this area — have there been break-ins, vandalism, or insurance claims at this property in the last 3 years? What carrier currently insures it and at what premium?
- What's the average days-on-market for RENTAL listings here right now (not sales)? A rising rental-DOM trend means longer vacancies and softer asking-rent achievability than the comps imply.
- What's the recent tenant-quality profile in this submarket — average credit score on applications, eviction rate, late-payment / NSF rate, and stable-employment percentage? A property-management company in the area should have these aggregated.
- How much new for-sale + rental construction is in the pipeline within 1–3 miles? Heavy new supply typically softens prices + rents 12–24 months out; constrained supply supports both.
Investment metrics
- 1% rule
- 1.10% ✓
- Cap rate
- 8.64%
- Cash-on-cash
- 8.37%
- DSCR
- 1.37
- GRM
- 7.6
CMA / ARV
- ARV (on-the-fly)
- $76,744
- Comps found
- 12
Show comp detail 12 sales within ~0.75 mi
| Address | Dist | Beds/Ba | Sqft | Sold | Price | $/sf | Match |
|---|---|---|---|---|---|---|---|
| 530 Mckeighan Ave | 0.29mi | 2/1.0 | 718 (-1%) | 1mo | $90,000 | $125 | 82 |
| 1475 Wells St | 0.49mi | 2/1.0 | 723 (-0%) | 2mo | $89,900 | $124 | 73 |
| 621 Lochhead Ave | 0.37mi | 2/1.0 | 680 (-6%) | 4mo | $72,000 | $106 | 67 |
| 1388 Carman St | 0.66mi | 2/1.0 | 723 (-0%) | 3mo | $84,650 | $117 | 65 |
| 602 Buckingham Ave | 0.39mi | 2/1.0 | 798 (+10%) | 9mo | $39,000 | $49 | 56 |
| 3517 Fern Ave | 0.73mi | 2/1.0 | 680 (-6%) | 0mo | $98,000 | $144 | 53 |
| 1377 Allen St | 0.55mi | 2/1.0 | 630 (-13%) | 1mo | $72,000 | $114 | 50 |
| 2291 Kenneth St | 0.67mi | 1/1.0 (-1) | 674 (-7%) | 0mo | $23,500 | $35 | 50 |
| 2053 E Whittemore Ave | 0.75mi | 2/1.0 | 756 (+4%) | 10mo | $80,000 | $106 | 48 |
| 1471 James St | 0.62mi | 1/1.0 (-1) | 772 (+7%) | 8mo | $68,000 | $88 | 46 |
| 1325 Norton St | 0.68mi | 2/1.0 | 792 (+9%) | 6mo | $64,900 | $82 | 46 |
| 1409 James St | 0.69mi | 2/1.0 | 818 (+13%) | 3mo | $76,000 | $93 | 42 |
Match score weights: distance 35% · size 25% · config 20% · recency 20%. Top-matched comps best support the ARV.
Projected returns pro-forma
-3.0% appreciation · 0.0% rent growth · sell at horizon
- IRR
- -7.0%
- Equity multiple
- 0.75×
- Total profit
- $-5,584
- Equity at exit
- $11,913
- IRR
- -1.5%
- Equity multiple
- 0.91×
- Total profit
- $-2,010
- Equity at exit
- $6,908
Cash invested: $22,372 (down + closing). Projections, not guarantees.
Landlord ↔ Tenant lean methodology
- Overall (STATE)
- 62 Landlord-Friendly
- State Michigan
- 62 Landlord-Friendly · EVEN
- County
- — inherits STATE
- City
- — inherits STATE
ZIP-level market 48507
- Rents YoY
- -1.0%
- Active inventory
- 206
- Price-to-rent
- 7.6×
Monthly cashflow live
- Estimated rent
- $880 medium interval (Pro) →
- Mortgage (P&I)
- −$419
- Tax from tax record
- −$87 /mo · $1,039/yr
- Insurance
- −$33
- HOA
- −$0
- Vacancy / Maint / Mgmt
- −$185
- Net cashflow
- $156
Break-even live
UW: 25.0% down · 7.5% · 30yr · 1.5% tax · 5.0% vac · 8.0% maint · 8.0% mgmt
Financing live
Cash to close
- Down payment
- $19,975
- Closing costs
- $2,397
- Reserves months
- —
- Total cash needed
- —
Loan-product check · same deal, 3 products live
Conventional
25% down · 7.5% · 30yr
- Down + closing
- —
- Monthly P&I
- —
- Monthly cashflow
- —
- DSCR
- —
- Eligible?
- —
Personal DTI + credit; lowest rate.
DSCR
20% down · 8.5% · 30yr
- Down + closing
- —
- Monthly P&I
- —
- Monthly cashflow
- —
- DSCR
- —
- Eligible?
- —
No personal income docs; deal must DSCR.
Hard money
10% down · 12.0% · 12mo
- Down + closing
- —
- Monthly P&I
- —
- Monthly cashflow
- —
- DSCR
- —
- Eligible?
- —
Short-term bridge; refi at stabilization.
Rent comps 4 comps
| Address | Beds | Baths | Sqft | Rent | $/sqft | DOM | Units | Dist |
|---|---|---|---|---|---|---|---|---|
| 2266 Donovan St Burton, MI | 2.0 | 1.0 | 700 | $800 | $1.14 | 13d | 1 | 0.64mi |
| 813 Alvord Ave Flint, MI | 2.0 | 1.0 | 724 | $850 | $1.17 | 13d | 1 | 1.00mi |
| 4400 Kings Ln Burton, MI | 1.0–2.0 | 1.0–2.0 | 666 | $960 | $1.44 | 13d | 19 | 1.08mi |
| 1023 Barrie Ave Flint, MI | 2.0 | 1.0 | 660 | $775 | $1.17 | 21d | 1 | 1.44mi |
Listing history 5 events
-
2026-06-09status $79,900 Pending 4 DOM
-
2026-06-08days on market $79,900 Active 4 DOM
-
2026-06-07days on market $79,900 Active 3 DOM
-
2026-06-05remarks 308-char remark
-
2026-06-05$79,900 Active 1 DOM
ⓘ Source: listings_history table (triggers on properties + properties_extension) + one-shot
backfill from property_details.listing_events for pre-trigger history.
Tax reassessment forecast MI · Partial reset (capped growth)
- Current annual tax
- $1,039 · $87/mo
- Projected year-2 tax
- $1,135 · $95/mo
- Expected delta
- +$96/yr (+$8/mo · 9.2%)
ⓘ Screening estimate from a state-policy table — verify with the county assessor before closing.
Climate risk First Street
- Flood 1/10 Low FEMA zone X (unshaded) · 0% chance over 30 yrs
- Wildfire 1/10 Low
- Heat 2/10 Low 7 d/yr ≥97°F today · 15 d/yr by 30 yrs out
- Wind 2/10 Low
- Air quality 3/10 Moderate 3 unhealthy d/yr today · 4 by 30 yrs out
Nearby sold comps map
Loading sold comps map…
Walkable amenities ~0.75 mi
Loading nearby amenities…
Taxation est. · year 1
- Rental income
- $10,554
- − Mortgage interest
- −$4,476
- − Property taxes
- −$1,039
- − Insurance
- −$400
- − Repairs & maintenance
- −$844
- − Management
- −$844
- − Depreciation
- −$2,324
- Taxable income
- $628
- Est. tax owed @ 24.0%
- −$151
- After-tax cash flow
- $1,721/yr
For passive investors: Depreciation is non-cash, so a rental often shows a tax loss while cash-flowing — sheltering income. Rental losses are passive: they offset passive income freely, and up to $25,000/yr can offset ordinary (W-2) income if you actively participate and your MAGI is under $100k (phasing out to $0 by $150k); unused losses carry forward. On sale, claimed depreciation is recaptured at up to 25%, and gains may owe capital-gains tax (a 1031 exchange can defer both). Figures are a year-1 estimate at your 24.0% rate — not tax advice; consult a CPA.
Schools (NCES district)
- District
- Flint School District
- NCES district ID
- 2614520
- Math proficiency
- 7% ▬ 0.00%
- Reading proficiency
- 13% ▲ 3.00%
- Median HH income
- $25,954
- Composite
- 10.97/100
- National rank
- #14642
- State rank
- #714 of 760 in MI
Livability — Flint
- Score
- 74/100
- State rank
- #196
- US rank
- #4946
Category grades
Schools grade is shown separately in the Schools card above.
Census & demographics
- Census place
- Flint, MI
- County
- Genesee County · 221,329 people
- City population
- 93,814
- Metro
- Flint, MI
- Population (ZIP)
- 28,723
- Household income
- $46,554
- Rent vs Own
- Severe rent burden
- 1534.0
Population outlook (Genesee County) Hauer SSP2
- Today (2025)
- 381,312 people
- By 2030
- 362,731 · -4.9%
- By 2040
- 321,550 · -15.7%
- By 2050
- 279,212 · -26.8%
- By 2075
- 193,336 · -49.3%
- By 2100
- 128,118 · -66.4%
Race, ethnicity, and origin ACS 2023
- Neighborhood character
- Diverse neighborhood (Simpson 0.57)
- Race & ethnicity
- White 59% Black 28% Two or more races 10% Hispanic / Latino 5%
- Common ancestry
- Lithuanian 4% Romanian 3% Slovak 2%
- Foreign-born
- 1% · Canada
- Languages at home
- 97% English-only · Spanish 1% Other Asian/Pacific 1%
Political lean MEDSL · Genesee
- 2024 margin
- Toss-up / Even · D 51.4% · R 47.2% · Other 1.4%
- 2008→2024 swing
- -28.3pp toward R · 2008: 32.5pp · 2024: 4.2pp
- All cycles
- 2024: D+4.2 2020: D+9.3 2016: D+9.5 2012: D+28.2 2008: D+32.5
Not yet ingested
- Civics
- —
Market trends
- HPI YoY
- ▼ -154.90%
- Current HPI
- 132.3632
- Rent YoY
- ▼ -1.04%
- Metro
- Flint, MI
- State GDP YoY
- ▲ 1.37%
- F500 in state
- 28
Industry mix (Fortune 500 HQ in MI)
| Industry | F500 HQs | Revenue |
|---|---|---|
| Automotive Parts | 3 | $48B |
|
||
| Automotive | 2 | $372B |
|
||
| Chemicals | 1 | $45B |
|
||
| Automotive Retail | 1 | $29B |
|
||
| Healthcare / Medical Devices | 1 | $23B |
|
||
| Automotive Technology | 1 | $20B |
|
||
Price history
+51.0% since first listed14 events — show timeline
- 2026-06-04 Listed $79,900 MiRealSource-MiMLS
- 2026-06-04 Listed $79,900 REALCOMP
- 2016-11-28 Pending — MiRealSource-MiMLS
- 2016-01-14 Listed $15,000 MiRealSource-MiMLS
- 2016-01-14 Listed $15,000 REALCOMP
- 1998-04-02 Sold (MLS) $49,000 MiRealSource-MiMLS
- 1998-04-02 Sold (MLS) $49,000 REALCOMP
- 1998-02-19 Listing Removed — MiRealSource-MiMLS
- 1997-10-24 Listed $49,900 MiRealSource-MiMLS
- 1997-10-24 Listed $49,900 REALCOMP
- 1997-10-10 Listing Removed — REALCOMP
- 1997-10-10 Listing Removed — MiRealSource-MiMLS
- 1997-07-10 Listed $52,900 REALCOMP
- 1997-07-10 Listed $52,900 MiRealSource-MiMLS
Property tax history
+2.2%/yrLatest (2025): $1,039 · +1.7% YoY. Source: county tax records.
Cash-flow waterfall
monthlySold comps — $/sqft
last 12 mo · ≤1 miLoading sold comps…