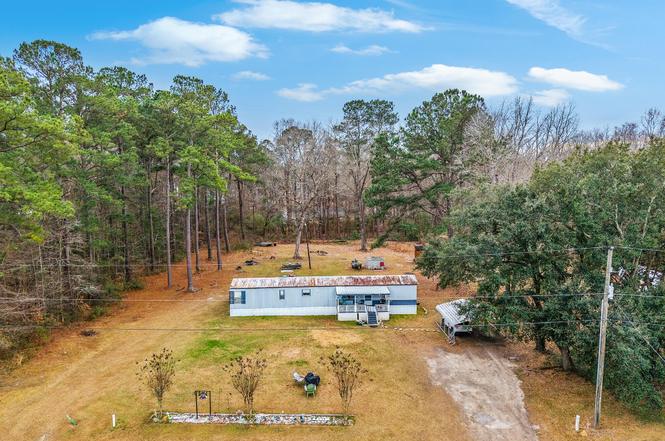
130 Water St · Summerville, SC
Flood risk 1/10 · Minimal
- FEMA flood zone
- X (unshaded)
- Chance of flooding over 30 yrs
- 0.0%
- Est. flood insurance / yr
- $507 – $1,088
Fire risk 4/10 · Minor
- Est. fire insurance / yr
- $783 – $1,453
Heat risk 8/10 · Major
- Hot days now (above 107°F)
- 7 days/yr
- Hot days in 30 yrs
- 17 days/yr
Wind risk 8/10 · Major
- Chance of severe wind over 30 yrs
- 97.0%
Air-quality risk 3/10 · Minor
- Unhealthy air days now
- 3 days/yr
- Unhealthy air days in 30 yrs
- 3 days/yr
Risk factors via First Street. Map © Google.
Why this score? — see what drove the C grade
The composite is a weighted blend of 9 inputs, each scored 0–100. Each bar is that input's sub-score; the figure is the points it added to the 100-point composite (weight × sub-score).
- Cash flow +20.2/30.0
- ARV discount +15.0/15.0
- DSCR +6.4/10.0
- 1% rule +5.3/10.0
- Schools +4.1/10.0
- Livability +3.2/5.0
- Rent growth +2.9/5.0
- Condition / age +2.5/5.0
- Appreciation +0.0/10.0
$159,900
🖨 Deal sheet 📄 Offer letter ✓ Due diligence
Listing remarks
Welcome to this charming 2-bedroom, 2-bath mobile home located in Summerville, situated on a generous . 72-acre lot. The front of the home features a covered porch with plenty of room for seating--perfect for enjoying your morning coffee or relaxing in the evenings. Step inside to a spacious living room that flows seamlessly into the kitchen, creating an open and inviting layout. The eat-in kitchen offers ample counter and cabinet space, making meal prep and everyday living a breeze. Both bedrooms are generously sized and each includes its own full bathroom, providing comfort and privacy. The laundry area is conveniently located just off the primary bedroom for added ease. Outside, the expa
Key facts
- Covered porch
- Laundry area
- Eat-in kitchen
Tags
Property features AI
Exterior
- Parking: 2-car carport
- Utilities: Septic tank
- Home design: Manufactured/mobile home; Single-story
- Construction: One level
- Exterior features: Metal roof; Aluminum skirting
Interior
- Kitchen: Eat-in kitchen
- Bedrooms: 2 bedrooms
- Bathrooms: 2 bathrooms
- Heating & cooling: Heat pump
- Interior features: Eat-in kitchen; Family room
- Laundry & utility: Washer hookup
Neighborhood map
What this means for you Summary
Snapshot
- This is a 2-bed/2.0-bath manufactured listed at $160k.
Deal economics
- At list price, monthly cash flow is $201 ($2k/yr) — positive.
- The deal already cash-flows at list — no discount required.
- Meets the 1% rule at list price ($2k rent vs $160k).
- Recommended offer: $141k (12.0% below list) — sets the bar for market timing.
- Cap rate 7.8% vs local median 4.0% in Summerville — top-decile yield for the area; either an underpriced asset or a hidden risk that comps aren't pricing in. Stress-test before assuming the spread holds.
Location & tenants
- Location reads 63/100 on livability (#167 in SC) — a middle-class / working-renter tenant base. Strengths: housing A+, cost of living B+; Watch: amenities F, commute F, health & safety F.
- Dorchester 02 (suburban): math 40% / reading 55% proficiency, ranked #12 of 80 in SC (top 15%) — families likely to look elsewhere, expect single-tenant / working-renter base with shorter leases.
- Zoned schools: Sand Hill Elementary (math 58% / reading 59%, grade B-, #95 of 597 statewide, top 16%, 1,133 students, 42% FRL); Gregg Middle (math 28% / reading 45%, grade F, #98 of 229 statewide, top 43%, 850 students, 76% FRL); Summerville High (math 60% / reading 92%, grade A-, #34 of 196 statewide, top 17%, 3,308 students, 59% FRL) — zoned schools average 59% FRL vs 36% district-wide (23 pts higher); higher-poverty schools than district average — tighter screening recommended.
- Market conditions: Rents rising (+1.4%/yr); 741 active listings in the ZIP; solid renter incomes; 1,199 units permitted in Dorchester County in 2024 (0 in 5+ unit buildings).
Forward outlook
- Local home prices are declining (-3.0%/yr); year-one equity from $1k of loan paydown is wiped out by about $5k of value loss. Plan a longer hold.
- Dorchester County population projected at +43% by 2050 — long-run rental-demand tailwind backs the buy-and-hold thesis.
Negotiation context
- It's been on market 142 days — a 12% lower offer ($141k) is reasonable based on typical stale-listing flexibility.
- 2 sale attempts since 6y ago; this cycle's ask has dropped $19k (11%) from the opening price — seller is motivated, your offer sets the floor, not the list.
Risks & watch-outs
- Climate carrying-cost: severe wind risk, 97% chance of damaging wind over 30y; extreme-heat days projected 7→17/yr by 2055 (HVAC capex compounding) — expect insurance premiums to compound above CPI over the hold.
Questions for the listing agent
- It's been on market 142 days. Have you received any prior offers? Is the seller open to a 12% concession, seller financing, or rate buy-down credit?
- Why hasn't it sold? Are there any deal-killer items the seller is aware of (foundation, flood, title, zoning, code violations)?
- Is there a deadline driving the sale (1031 exchange, divorce, estate, relocation)? That informs how much negotiation room exists.
- Schools are B-rated — typically a magnet for longer-tenancy family renters. What's the average tenant stay here, and is there a school-zone premium baked into asking?
- What's the average days-on-market for RENTAL listings here right now (not sales)? A rising rental-DOM trend means longer vacancies and softer asking-rent achievability than the comps imply.
- What's the recent tenant-quality profile in this submarket — average credit score on applications, eviction rate, late-payment / NSF rate, and stable-employment percentage? A property-management company in the area should have these aggregated.
- How much new for-sale + rental construction is in the pipeline within 1–3 miles? Heavy new supply typically softens prices + rents 12–24 months out; constrained supply supports both.
Investment metrics
- 1% rule
- 1.03% ✓
- Cap rate
- 7.80%
- Cash-on-cash
- 5.39%
- DSCR
- 1.24
- GRM
- 8.1
CMA / ARV
- ARV (on-the-fly)
- $234,688
- Comps found
- 1
Show comp detail 1 sale within ~0.75 mi
| Address | Dist | Beds/Ba | Sqft | Sold | Price | $/sf | Match |
|---|---|---|---|---|---|---|---|
| 224 Water St | 0.08mi | 3/2.0 (+1) | 1,216 (0%) | 24mo | $235,000 | $193 | 72 |
Match score weights: distance 35% · size 25% · config 20% · recency 20%. Top-matched comps best support the ARV.
Projected returns pro-forma
-3.0% appreciation · 1.45% rent growth · sell at horizon
- IRR
- -9.7%
- Equity multiple
- 0.65×
- Total profit
- $-15,623
- Equity at exit
- $23,842
- IRR
- -2.5%
- Equity multiple
- 0.84×
- Total profit
- $-7,118
- Equity at exit
- $13,825
Cash invested: $44,772 (down + closing). Projections, not guarantees.
Landlord ↔ Tenant lean methodology
- Overall (STATE)
- 90 Strongly Landlord-Friendly
- State South Carolina
- 90 Strongly Landlord-Friendly · R+6
- County
- — inherits STATE
- City
- — inherits STATE
ZIP-level market 29483
- Home prices YoY
- -34.6%
- Rents YoY
- 1.4%
- Active inventory
- 741
- Price-to-rent
- 8.1×
Monthly cashflow live
- Estimated rent
- $1,653 medium interval (Pro) →
- Mortgage (P&I)
- −$839
- Tax est. 1.5%
- −$200 /mo · $2,398/yr
- Insurance
- −$67
- HOA
- −$0
- Vacancy / Maint / Mgmt
- −$347
- Net cashflow
- $201
Break-even live
UW: 25.0% down · 7.5% · 30yr · 1.5% tax · 5.0% vac · 8.0% maint · 8.0% mgmt
Financing live
Cash to close
- Down payment
- $39,975
- Closing costs
- $4,797
- Reserves months
- —
- Total cash needed
- —
Loan-product check · same deal, 3 products live
Conventional
25% down · 7.5% · 30yr
- Down + closing
- —
- Monthly P&I
- —
- Monthly cashflow
- —
- DSCR
- —
- Eligible?
- —
Personal DTI + credit; lowest rate.
DSCR
20% down · 8.5% · 30yr
- Down + closing
- —
- Monthly P&I
- —
- Monthly cashflow
- —
- DSCR
- —
- Eligible?
- —
No personal income docs; deal must DSCR.
Hard money
10% down · 12.0% · 12mo
- Down + closing
- —
- Monthly P&I
- —
- Monthly cashflow
- —
- DSCR
- —
- Eligible?
- —
Short-term bridge; refi at stabilization.
Listing history 17 events
-
2026-06-18days on market $159,900 Active 142 DOM
-
2026-06-17days on market $159,900 Active 141 DOM
-
2026-06-16days on market $159,900 Active 140 DOM
-
2026-06-15days on market $159,900 Active 139 DOM
-
2026-06-13days on market $159,900 Active 137 DOM
-
2026-06-13days on market $159,900 Active 136 DOM
-
2026-06-10days on market $159,900 Active 134 DOM
-
2026-06-09days on market $159,900 Active 133 DOM
-
2026-06-08days on market $159,900 Active 132 DOM
-
2026-06-07days on market $159,900 Active 131 DOM
-
2026-06-03days on market $159,900 Active 127 DOM
-
2026-06-01days on market $159,900 Active 125 DOM
-
2026-05-31days on market $159,900 Active 124 DOM
-
2026-04-23price $159,900
-
2026-01-27$179,000 Active
-
2020-09-24historical
-
2020-08-27$99,999 Active
ⓘ Source: listings_history table (triggers on properties + properties_extension) + one-shot
backfill from property_details.listing_events for pre-trigger history.
Climate risk First Street
- Flood 1/10 Low FEMA zone X (unshaded) · 0% chance over 30 yrs
- Wildfire 4/10 Moderate
- Heat 8/10 Severe 7 d/yr ≥107°F today · 17 d/yr by 30 yrs out
- Wind 8/10 Severe 97% chance of damaging wind over 30 yrs
- Air quality 3/10 Moderate 3 unhealthy d/yr today · 3 by 30 yrs out
Nearby sold comps map
Loading sold comps map…
Walkable amenities ~0.75 mi
Loading nearby amenities…
Taxation est. · year 1
- Rental income
- $19,839
- − Mortgage interest
- −$8,957
- − Property taxes
- −$2,398
- − Insurance
- −$800
- − Repairs & maintenance
- −$1,587
- − Management
- −$1,587
- − Depreciation
- −$4,652
- Taxable loss
- −$142
- Est. tax savings @ 24.0%
- +$34
- After-tax cash flow
- $2,446/yr
For passive investors: Depreciation is non-cash, so a rental often shows a tax loss while cash-flowing — sheltering income. Rental losses are passive: they offset passive income freely, and up to $25,000/yr can offset ordinary (W-2) income if you actively participate and your MAGI is under $100k (phasing out to $0 by $150k); unused losses carry forward. On sale, claimed depreciation is recaptured at up to 25%, and gains may owe capital-gains tax (a 1031 exchange can defer both). Figures are a year-1 estimate at your 24.0% rate — not tax advice; consult a CPA.
Schools (NCES district)
- District
- Dorchester 02
- NCES district ID
- 4502010
- Math proficiency
- 40% ▼ -13.00%
- Reading proficiency
- 55% ▼ -4.00%
- Median HH income
- $57,937
- Composite
- 41.41/100
- National rank
- #3475
- State rank
- #12 of 80 in SC
Livability — Summerville
- Score
- 63/100
- State rank
- #167
- US rank
- #15058
Category grades
Schools grade is shown separately in the Schools card above.
Census & demographics
- County
- Dorchester County · 182,866 people
- City population
- 171,668
- Metro
- Charleston-North Charleston, SC
- Population (ZIP)
- 59,186
- Household income
- $85,750
- Rent vs Own
- Severe rent burden
- 1309.0
Population outlook (Dorchester County) Hauer SSP2
- Today (2025)
- 186,982 people
- By 2030
- 203,967 · +9.1%
- By 2040
- 237,160 · +26.8%
- By 2050
- 267,479 · +43.1%
- By 2075
- 333,025 · +78.1%
- By 2100
- 366,560 · +96.0%
Race, ethnicity, and origin ACS 2023
- Neighborhood character
- Predominantly White (68%)
- Race & ethnicity
- White 68% Black 19% Hispanic / Latino 7% Two or more races 6% Asian 1%
- Hispanic origin (detail)
- Mexican 3% Puerto Rican 1%
- Common ancestry
- Slovak 3% Lithuanian 3% Romanian 3%
- Foreign-born
- 5% · Canada
- Languages at home
- 93% English-only · Spanish 4%
Political lean MEDSL · Dorchester
- 2024 margin
- R (+14.6) · D 41.8% · R 56.4% · Other 1.9%
- 2008→2024 swing
- +0.9pp no change · 2008: -15.5pp · 2024: -14.6pp
- All cycles
- 2024: R+14.6 2020: R+10.5 2016: R+17.5 2012: R+16.0 2008: R+15.5
Not yet ingested
- Civics
- —
Market trends
- HPI YoY
- ▼ -131.42%
- Current HPI
- 248.8406
- Rent YoY
- ▲ 1.45%
- Metro
- Charleston-North Charleston, SC
- State GDP YoY
- ▲ 4.51%
- F500 in state
- 2
Industry mix (Fortune 500 HQ in SC)
| Industry | F500 HQs | Revenue |
|---|---|---|
| Packaging | 1 | $7B |
|
||
Price history
+59.9% since first listed4 events — show timeline
- 2026-04-23 Price Changed $159,900 Charleston Trident MLS
- 2026-01-27 Listed $179,000 Charleston Trident MLS
- 2020-09-24 Listing Removed — Charleston Trident MLS
- 2020-08-27 Listed $99,999 Charleston Trident MLS
Property tax history
-16.8%/yrLatest (2022): $85 · +13.3% YoY. Source: county tax records.
Cash-flow waterfall
monthlySold comps — $/sqft
last 12 mo · ≤1 miLoading sold comps…