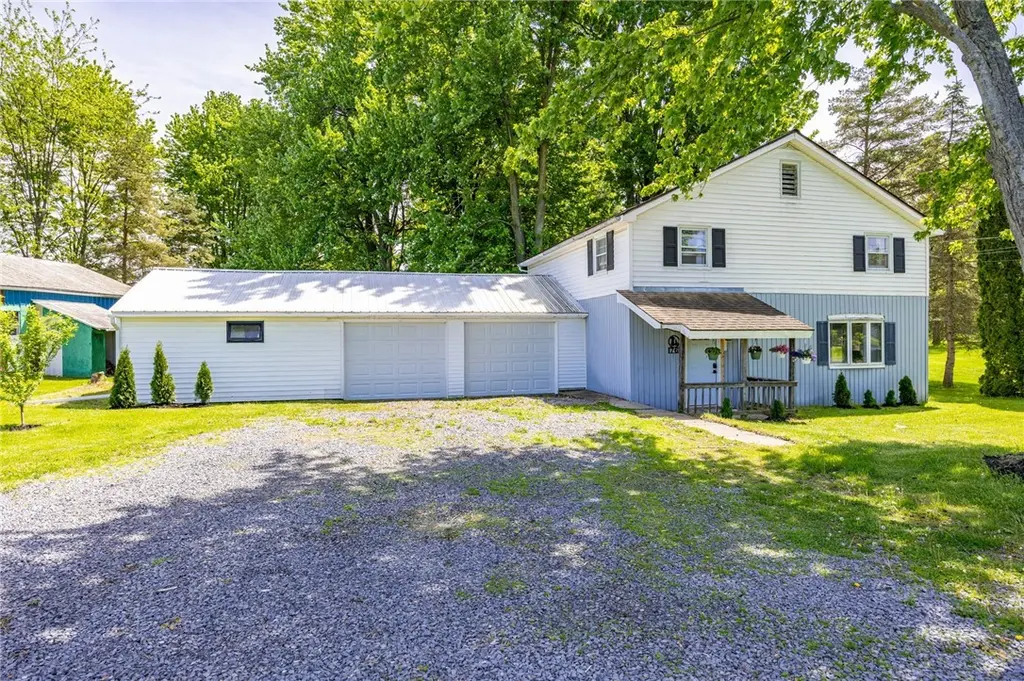
76 E Wright Ave · Waterloo, NY
Flood risk 1/10 · Minimal
- FEMA flood zone
- X
- Chance of flooding over 30 yrs
- 0.0%
- Est. flood insurance / yr
- $507 – $1,088
Fire risk 1/10 · Minimal
- Est. fire insurance / yr
- $691 – $1,283
Heat risk 3/10 · Minor
- Hot days now (above 97°F)
- 7 days/yr
- Hot days in 30 yrs
- 15 days/yr
Wind risk 1/10 · Minimal
- Chance of severe wind over 30 yrs
- 1.0%
Air-quality risk 2/10 · Minimal
- Unhealthy air days now
- 0 days/yr
- Unhealthy air days in 30 yrs
- 1 days/yr
Risk factors via First Street. Map © Google.
Why this score? — see what drove the D+ grade
The composite is a weighted blend of 9 inputs, each scored 0–100. Each bar is that input's sub-score; the figure is the points it added to the 100-point composite (weight × sub-score).
- Cash flow +14.4/30.0
- ARV discount +12.2/15.0
- 1% rule +4.6/10.0
- DSCR +4.4/10.0
- Livability +3.8/5.0
- Schools +3.4/10.0
- Rent growth +2.5/5.0
- Condition / age +2.5/5.0
- Appreciation +0.0/10.0
$179,000
🖨 Deal sheet (PDF) 📄 Offer letter ✓ Due diligence
Listing remarks MLS
Looking for an affordable 4 bedroom home with a large lot, attached garage and barn? This property is for you! Has been mostly remodeled with some more work to do. Great opportunity with new kitchen, bath and flooring!
Key facts
- Large treed lot
- Remodeled kitchen
- New trim
Tags
Property features AI
Exterior
- Parking: Attached garage with storage and workshop; 2 garage spaces
- Utilities: Public water connected; Sewer connected
- Home design: 2-story home; Resale property; Existing construction
- Construction: Vinyl siding; Wood siding; Slab foundation
- Exterior features: Gravel driveway
Interior
- Kitchen: Electric oven; Electric range; Microwave; Dishwasher; Refrigerator
- Bedrooms: 7 total rooms (includes laundry)
- Flooring: Hardwood; Luxury vinyl; Varies
- Bathrooms: 1 full bathroom; 2 half bathrooms; 1 main-level bathroom
- Heating & cooling: Gas forced-air heating; Has heating
- Interior features: Eat-in kitchen
- Laundry & utility: Washer and dryer; Main-level laundry
Neighborhood map
What this means for you Summary
Snapshot
- This is a 4-bed/2.0-bath single-family listed at $179k.
Deal economics
- At list price, monthly cash flow is $36 ($436/yr) — positive.
- The deal already cash-flows at list — no discount required.
- To meet the 1% rule (rent ≥ 1% of price), the offer needs to be $173k (3.5% below list).
- Recommended offer: $173k (3.5% below list) — sets the bar for 1% rule.
- Cap rate 6.5% vs local median 4.8% in Waterloo — top-decile yield for the area; either an underpriced asset or a hidden risk that comps aren't pricing in. Stress-test before assuming the spread holds.
Location & tenants
- Location reads 75/100 on livability (#268 in NY, #4,240 nationally) — a middle-class / working-renter tenant base. Strengths: cost of living A+, housing A+, health & safety A+; Watch: amenities F, commute F.
- Waterloo Central School District (town): math 37% / reading 43% proficiency, ranked #525 of 590 in NY (top 89%) — families likely to look elsewhere, expect single-tenant / working-renter base with shorter leases.
- Zoned schools: Skoi-Yase School (349 students, 59% FRL); Waterloo Middle School (math 13% / reading 31%, grade F, #656 of 729 statewide, top 90%, 338 students, 63% FRL); Waterloo High School (math 82% / reading 82%, grade A, #452 of 1,100 statewide, top 44%, 438 students, 58% FRL) — zoned schools average 60% FRL vs 40% district-wide (20 pts higher); higher-poverty schools than district average — tighter screening recommended.
- Zoned-school proficiency averages 52% at this address vs 40% district-wide (+12 pts) — the actual schools serving this property are materially stronger than the Waterloo Central School District average implies; a family-tenant draw the district grade alone would hide.
- Market conditions: 39 active listings in the ZIP; 48 units permitted in Seneca County in 2024 (0 in 5+ unit buildings).
Forward outlook
- Local home prices are declining (-3.0%/yr); year-one equity from $1k of loan paydown is wiped out by about $5k of value loss. Plan a longer hold.
- Seneca County population projected at -14% by 2050 — secular population decline; favor cash flow + early exit over multi-decade hold.
Negotiation context
- Only 8 days on market — expect competitive offers; lowballing is unlikely to land.
- 4 sale attempts since 8y ago with the ask held roughly flat each time — persistent listings suggest the price (not the market) is what's stuck; bring a comps-based counter.
Questions for the listing agent
- Built in 1960 — when were the roof, HVAC, electrical panel, plumbing, and water heater last replaced?
- Is there a deadline driving the sale (1031 exchange, divorce, estate, relocation)? That informs how much negotiation room exists.
- The area grade is low — what's the realistic commute time and amenity access for the typical tenant pool here? Any planned neighborhood developments (good or bad) we should know about?
- What's the average days-on-market for RENTAL listings here right now (not sales)? A rising rental-DOM trend means longer vacancies and softer asking-rent achievability than the comps imply.
- What's the recent tenant-quality profile in this submarket — average credit score on applications, eviction rate, late-payment / NSF rate, and stable-employment percentage? A property-management company in the area should have these aggregated.
- How much new for-sale + rental construction is in the pipeline within 1–3 miles? Heavy new supply typically softens prices + rents 12–24 months out; constrained supply supports both.
Investment metrics
- 1% rule
- 0.96% ✗
- Cap rate
- 6.54%
- Cash-on-cash
- 0.87%
- DSCR
- 1.04
- GRM
- 8.6
CMA / ARV
- ARV (on-the-fly)
- $199,800
- Comps found
- 12
Show comp detail 12 sales within ~0.75 mi
| Address | Dist | Beds/Ba | Sqft | Sold | Price | $/sf | Match |
|---|---|---|---|---|---|---|---|
| 124 E Williams St | 0.44mi | 3/2.0 (-1) | 1,792 (-0%) | 6mo | $125,000 | $70 | 68 |
| 20 Swift St | 0.35mi | 4/2.0 | 1,911 (+6%) | 11mo | $212,000 | $111 | 64 |
| 102 Norris Dr | 0.24mi | 4/2.0 | 1,566 (-13%) | 9mo | $260,000 | $166 | 60 |
| 49 Taylor Ave | 0.48mi | 4/2.0 | 1,641 (-9%) | 6mo | $282,000 | $172 | 58 |
| 106 E Williams St | 0.47mi | 4/1.5 | 1,919 (+7%) | 9mo | $221,000 | $115 | 57 |
| 54 Center St | 0.60mi | 4/2.0 | 1,652 (-8%) | 5mo | $170,000 | $103 | 54 |
| 8 Church St | 0.50mi | 3/1.0 (-1) | 1,896 (+5%) | 8mo | $125,000 | $66 | 52 |
| 14 W Wright Ave | 0.57mi | 4/2.5 | 1,984 (+10%) | 3mo | $255,000 | $129 | 52 |
| 104 E Main St | 0.55mi | 4/1.5 | 1,944 (+8%) | 12mo | $212,000 | $109 | 49 |
| 1596 North Rd | 0.47mi | 5/2.0 (+1) | 2,020 (+12%) | 10mo | $97,500 | $48 | 44 |
| 73 E River St | 0.72mi | 3/1.0 (-1) | 1,880 (+4%) | 9mo | $139,000 | $74 | 42 |
| 17 E Water St | 0.64mi | 3/2.0 (-1) | 1,535 (-15%) | 10mo | $180,000 | $117 | 32 |
Match score weights: distance 35% · size 25% · config 20% · recency 20%. Top-matched comps best support the ARV.
Projected returns pro-forma
-3.0% appreciation · 3.0% rent growth · sell at horizon
- IRR
- -14.9%
- Equity multiple
- 0.47×
- Total profit
- $-26,611
- Equity at exit
- $26,689
- IRR
- -6.1%
- Equity multiple
- 0.60×
- Total profit
- $-19,863
- Equity at exit
- $15,477
Cash invested: $50,120 (down + closing). Projections, not guarantees.
Landlord ↔ Tenant lean methodology
- Overall (STATE)
- 15 Strongly Tenant-Friendly
- State New York
- 15 Strongly Tenant-Friendly · D+10
- County
- — inherits STATE
- City
- — inherits STATE
ZIP-level market 13165
- Home prices YoY
- -20.7%
- Active inventory
- 39
- Price-to-rent
- 8.6×
Monthly cashflow live
- Estimated rent
- $1,726 medium interval (Pro) →
- Mortgage (P&I)
- −$939
- Tax from tax record
- −$314 /mo · $3,772/yr
- Insurance
- −$75
- HOA
- −$0
- Vacancy / Maint / Mgmt
- −$363
- Net cashflow
- $36
Break-even live
Sensitivity live
| Price | -10% $138 | -5% $87 | +0% $36 | +5% $-14 | +10% $-65 |
|---|---|---|---|---|---|
| Rent | -10% $-100 | -5% $-32 | +0% $36 | +5% $105 | +10% $173 |
| Rate | -1.0pp $126 | -0.5pp $82 | base $36 | +0.5pp $-10 | +1.0pp $-57 |
UW: 25.0% down · 7.5% · 30yr · 1.5% tax · 5.0% vac · 8.0% maint · 8.0% mgmt
Financing live
Cash to close
- Down payment
- $44,750
- Closing costs
- $5,370
- Reserves months
- —
- Total cash needed
- —
Loan-product check · same deal, 3 products live
Conventional
25% down · 7.5% · 30yr
- Down + closing
- —
- Monthly P&I
- —
- Monthly cashflow
- —
- DSCR
- —
- Eligible?
- —
Personal DTI + credit; lowest rate.
DSCR
20% down · 8.5% · 30yr
- Down + closing
- —
- Monthly P&I
- —
- Monthly cashflow
- —
- DSCR
- —
- Eligible?
- —
No personal income docs; deal must DSCR.
Hard money
10% down · 12.0% · 12mo
- Down + closing
- —
- Monthly P&I
- —
- Monthly cashflow
- —
- DSCR
- —
- Eligible?
- —
Short-term bridge; refi at stabilization.
Listing history 15 events
-
2026-06-07statusdays on market $179,000 Pending 8 DOM
-
2026-06-04days on market $179,000 Active 6 DOM
-
2026-06-02days on market $179,000 Active 5 DOM
-
2026-06-01days on market $179,000 Active 4 DOM
-
2026-05-31days on market $179,000 Active 3 DOM
-
2026-05-28$179,000 Active
-
2023-10-17soldstatus $158,000 Closed Sale or Rented 218-char remark
Show marketing remark (218 chars)
Looking for an affordable 4 bedroom home with a large lot, attached garage and barn? This property is for you! Has been mostly remodeled with some more work to do. Great opportunity with new kitchen, bath and flooring!
-
2023-10-11soldstatus $158,000
-
2023-08-08status Under Contract- Do Not Show 218-char remark
Show marketing remark (218 chars)
Looking for an affordable 4 bedroom home with a large lot, attached garage and barn? This property is for you! Has been mostly remodeled with some more work to do. Great opportunity with new kitchen, bath and flooring!
-
2023-08-01$89,900 Active 218-char remark
Show marketing remark (218 chars)
Looking for an affordable 4 bedroom home with a large lot, attached garage and barn? This property is for you! Has been mostly remodeled with some more work to do. Great opportunity with new kitchen, bath and flooring!
-
2019-04-24soldstatus $61,000
-
2019-04-23soldstatus $61,000 230-char remark
Show marketing remark (230 chars)
Colonial home with large kitchen, 4 bed, 1.2 bath, master has half bath. Two car garage has attached workshop on east side with work benches. Also has 30x29 pole barn. Oven/range condition unknown. Big home with lots of potential!
-
2019-01-23$69,900 230-char remark
Show marketing remark (230 chars)
Colonial home with large kitchen, 4 bed, 1.2 bath, master has half bath. Two car garage has attached workshop on east side with work benches. Also has 30x29 pole barn. Oven/range condition unknown. Big home with lots of potential!
-
2019-01-20historical
-
2018-07-26$74,900
ⓘ Source: listings_history table (triggers on properties + properties_extension) + one-shot
backfill from property_details.listing_events for pre-trigger history.
Tax reassessment forecast NY · Partial reset (capped growth)
- Current annual tax
- $3,772 · $314/mo
- Projected year-2 tax
- $3,772 · $314/mo
- Expected delta
- $0/yr ($0/mo · 0.0%)
ⓘ Screening estimate from a state-policy table — verify with the county assessor before closing.
Climate risk First Street
- Flood 1/10 Low FEMA zone X · 0% chance over 30 yrs
- Wildfire 1/10 Low
- Heat 3/10 Moderate 7 d/yr ≥97°F today · 15 d/yr by 30 yrs out
- Wind 1/10 Low 100% chance of damaging wind over 30 yrs
- Air quality 2/10 Low 0 unhealthy d/yr today · 1 by 30 yrs out
Nearby sold comps map
Loading sold comps map…
Walkable amenities ~0.75 mi
Loading nearby amenities…
Taxation est. · year 1
- Rental income
- $20,718
- − Mortgage interest
- −$10,027
- − Property taxes
- −$3,772
- − Insurance
- −$895
- − Repairs & maintenance
- −$1,657
- − Management
- −$1,657
- − Depreciation
- −$5,207
- Taxable loss
- −$2,498
- Est. tax savings @ 24.0%
- +$600
- After-tax cash flow
- $1,035/yr
For passive investors: Depreciation is non-cash, so a rental often shows a tax loss while cash-flowing — sheltering income. Rental losses are passive: they offset passive income freely, and up to $25,000/yr can offset ordinary (W-2) income if you actively participate and your MAGI is under $100k (phasing out to $0 by $150k); unused losses carry forward. On sale, claimed depreciation is recaptured at up to 25%, and gains may owe capital-gains tax (a 1031 exchange can defer both). Figures are a year-1 estimate at your 24.0% rate — not tax advice; consult a CPA.
Schools (NCES district)
- District
- Waterloo Central School District
- NCES district ID
- 3600014
- Math proficiency
- 37% ▼ -9.00%
- Reading proficiency
- 43% ▲ 11.00%
- Median HH income
- $46,726
- Composite
- 34.16/100
- National rank
- #5278
- State rank
- #525 of 590 in NY
Livability — Waterloo
- Score
- 75/100
- State rank
- #268
- US rank
- #4240
Category grades
Schools grade is shown separately in the Schools card above.
Census & demographics
- Census place
- Waterloo, NY
- Population (ZIP)
- 9,429
Population outlook (Seneca County) Hauer SSP2
- Today (2025)
- 33,457 people
- By 2030
- 32,540 · -2.7%
- By 2040
- 30,680 · -8.3%
- By 2050
- 28,875 · -13.7%
- By 2075
- 24,757 · -26.0%
- By 2100
- 19,591 · -41.4%
Race, ethnicity, and origin ACS 2023
- Neighborhood character
- Predominantly White (89%)
- Race & ethnicity
- White 89% Two or more races 8% Hispanic / Latino 6% Black 1%
- Hispanic origin (detail)
- Mexican 1% Puerto Rican 2%
- Common ancestry
- Slovak 4% Iranian 3% Lithuanian 3%
- Foreign-born
- 4% · Canada, Jamaica
- Languages at home
- 93% English-only · Spanish 4% German/W. Germanic 2%
Political lean MEDSL · Seneca
- 2024 margin
- R (+11.8) · D 44.1% · R 55.9%
- 2008→2024 swing
- -14.4pp toward R · 2008: 2.6pp · 2024: -11.8pp
- All cycles
- 2024: R+11.8 2020: R+9.1 2016: R+12.1 2012: D+9.2 2008: D+2.6
Not yet ingested
- Civics
- —
Market trends
- HPI YoY
- ▼ -67.17%
- Current HPI
- 257.272
- Rent YoY
- —
- Metro
- —
- State GDP YoY
- ▲ 2.60%
- F500 in state
- 92
Industry mix (Fortune 500 HQ in NY)
| Industry | F500 HQs | Revenue |
|---|---|---|
| Financial Services | 10 | $950B |
|
||
| Consumer Goods | 9 | $162B |
|
||
| Insurance | 4 | $225B |
|
||
| Telecommunications | 2 | $144B |
|
||
| Pharmaceuticals | 2 | $112B |
|
||
| Media / Entertainment | 2 | $69B |
|
||
Price history
+139.0% since first listed10 events — show timeline
- 2026-05-28 Listed $179,000 UNYREIS
- 2023-10-17 Sold (MLS) $158,000 UNYREIS
- 2023-10-11 Sold (Public Records) $158,000 Public Records
- 2023-08-08 Pending — UNYREIS
- 2023-08-01 Listed $89,900 UNYREIS
- 2019-04-24 Sold (Public Records) $61,000 Public Records
- 2019-04-23 Sold (MLS) $61,000 UNYREIS
- 2019-01-23 Listed $69,900 UNYREIS
- 2019-01-20 Listing Removed — UNYREIS
- 2018-07-26 Listed $74,900 UNYREIS
Property tax history
+8.6%/yrLatest (2025): $3,772 · +5.4% YoY. Source: county tax records.
Cash-flow waterfall
monthlySold comps — $/sqft
last 12 mo · ≤1 miLoading sold comps…