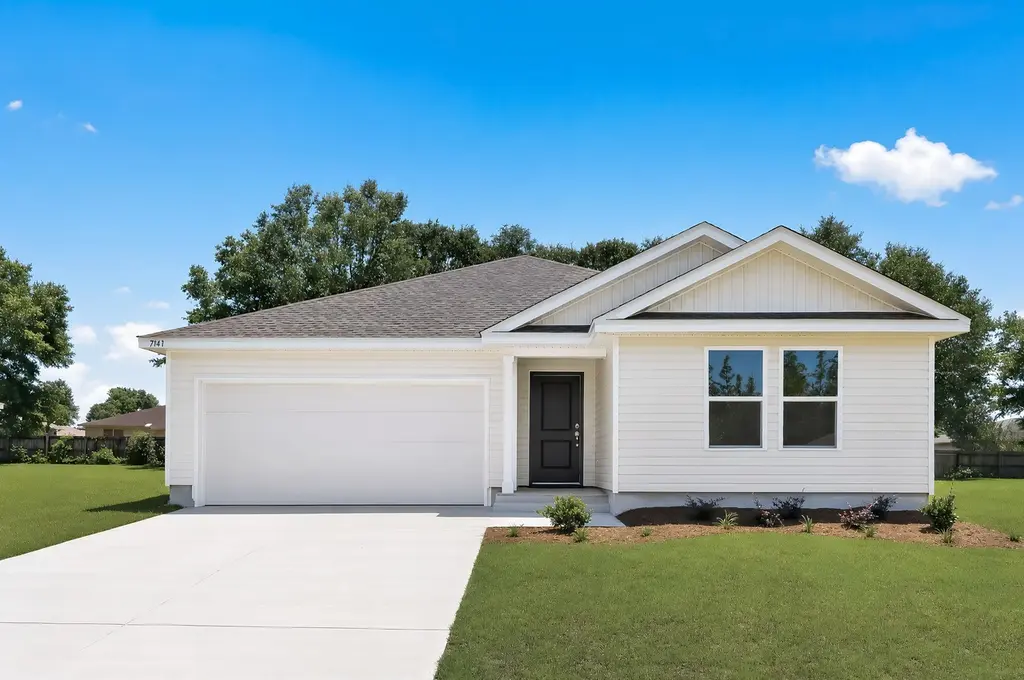
7141 Season Dr · Point Baker, FL
Flood risk 1/10 · Minimal
- FEMA flood zone
- X (unshaded)
- Chance of flooding over 30 yrs
- 0.0%
- Est. flood insurance / yr
- $507 – $1,088
Fire risk 5/10 · Moderate
- Est. fire insurance / yr
- $947 – $1,759
Heat risk 10/10 · Severe
- Hot days now (above 106°F)
- 7 days/yr
- Hot days in 30 yrs
- 22 days/yr
Wind risk 9/10 · Severe
- Chance of severe wind over 30 yrs
- 99.0%
Air-quality risk 2/10 · Minimal
- Unhealthy air days now
- 1 days/yr
- Unhealthy air days in 30 yrs
- 1 days/yr
Risk factors via First Street. Map © Google.
Why this score? — see what drove the D grade
The composite is a weighted blend of 9 inputs, each scored 0–100. Each bar is that input's sub-score; the figure is the points it added to the 100-point composite (weight × sub-score).
- Cash flow +11.6/30.0
- ARV discount +7.9/15.0
- Schools +5.3/10.0
- Condition / age +4.0/5.0
- 1% rule +3.4/10.0
- DSCR +3.4/10.0
- Rent growth +3.2/5.0
- Livability +3.2/5.0
- Appreciation +0.0/10.0
$274,490
🖨 Deal sheet (PDF) 📄 Offer letter ✓ Due diligence
Listing remarks
Ridge at Harvest Point is a new community of single-family homes for sale in Milton, FL. With a convenient location just 30 minutes from fantastic Pensacola beaches, Milton is a growing city with expanding job opportunities, desirable local schools and a welcoming atmosphere for families and professionals alike. Nature lovers will enjoy a variety of outdoor recreation opportunities, from kayaking on Blackwater River to hiking in Blackwater State Forest, and residents can visit historic downtown Milton to experience charming shops, delicious dining options and live music performances at The Imogene Theatre.
Key facts
- Convenient location
- New community
- 2 garage spots
Tags
Property features AI
Finance
- Other: Address: 7141 Season Dr, Milton FL 32570
- Financial info: List price $284,490
Exterior
- Home design: Spec home — Gehrig plan; Active listing
- Construction: New construction (2026 listing)
- Exterior features: Living area approximately 1,732
Interior
- Bedrooms: Four bedrooms (no room-level details provided)
- Bathrooms: Two full bathrooms
- Interior features: 2 full bathrooms; 4 bedrooms
Neighborhood map
What this means for you Summary
Snapshot
- This is a 4-bed/2.0-bath single-family listed at $274k. Condition is rated good.
Deal economics
- At list price, monthly cash flow is $-86 ($-1k/yr) — negative.
- To cash-flow at today's rent, offer at most $262k (4.5% below list).
- To meet the 1% rule (rent ≥ 1% of price), the offer needs to be $229k (16.5% below list).
- Recommended offer: $229k (16.5% below list) — sets the bar for 1% rule.
- Cap rate 5.9% vs local median 4.2% in Point Baker — top-decile yield for the area; either an underpriced asset or a hidden risk that comps aren't pricing in. Stress-test before assuming the spread holds.
Location & tenants
- Location reads 63/100 on livability (#735 in FL) — a middle-class / working-renter tenant base. Strengths: crime A+, cost of living A+, housing A+; Watch: amenities F, commute F, health & safety F.
- Santa Rosa (suburban): math 63% / reading 60% proficiency, ranked #8 of 73 in FL (top 11%) — acceptable for families but not a draw, mixed tenant base, ~2y average lease.
- Zoned schools: W. H. Rhodes Elementary School (math 55% / reading 47%, grade C-, #1,043 of 2,144 statewide, top 49%, 812 students, 79% FRL); Martin Luther King Middle School (math 38% / reading 41%, grade F, #373 of 571 statewide, top 66%, 660 students, 69% FRL); Milton High School (math 44% / reading 42%, grade F, #255 of 667 statewide, top 39%, 2,085 students, 54% FRL) — zoned schools average 67% FRL vs 36% district-wide (31 pts higher); higher-poverty schools than district average — tighter screening recommended.
- Zoned-school proficiency averages 44% at this address vs 62% district-wide (-17 pts) — the specific schools serving this property underperform the Santa Rosa average; the district grade overstates school quality for this exact location.
- Market conditions: Rents rising (+2.7%/yr); 360 active listings in the ZIP; solid renter incomes; 1,983 units permitted in Santa Rosa County in 2024 (128 in 5+ unit buildings).
- This rent runs 36% of the median local income ($77k/yr) — at the standard rent-burdened threshold; future hikes will face affordability resistance.
Forward outlook
- Local home prices are declining (-3.0%/yr); year-one equity from $2k of loan paydown is wiped out by about $8k of value loss. Plan a longer hold.
- Santa Rosa County population projected at +31% by 2050 — long-run rental-demand tailwind backs the buy-and-hold thesis.
Negotiation context
- It's been on market 54 days — a 3% lower offer ($266k) is reasonable based on typical stale-listing flexibility.
Risks & watch-outs
- Climate carrying-cost: severe wind risk, 99% chance of damaging wind over 30y; moderate wildfire risk; extreme-heat days projected 7→22/yr by 2055 (HVAC capex compounding) — expect insurance premiums to compound above CPI over the hold.
Questions for the listing agent
- What do current leases actually rent for vs. the listed asking? Can we see a recent rent roll and the last 12 months of T-12 income?
- It's been on market 54 days. Have you received any prior offers? Is the seller open to a 16% concession, seller financing, or rate buy-down credit?
- Is there a deadline driving the sale (1031 exchange, divorce, estate, relocation)? That informs how much negotiation room exists.
- Schools are F-rated, which usually means shorter tenancies and higher turnover. Who's the typical renter profile here, and what's been the actual vacancy rate?
- The area grade is low — what's the realistic commute time and amenity access for the typical tenant pool here? Any planned neighborhood developments (good or bad) we should know about?
- What's the average days-on-market for RENTAL listings here right now (not sales)? A rising rental-DOM trend means longer vacancies and softer asking-rent achievability than the comps imply.
- What's the recent tenant-quality profile in this submarket — average credit score on applications, eviction rate, late-payment / NSF rate, and stable-employment percentage? A property-management company in the area should have these aggregated.
- How much new for-sale + rental construction is in the pipeline within 1–3 miles? Heavy new supply typically softens prices + rents 12–24 months out; constrained supply supports both.
Investment metrics
- 1% rule
- 0.84% ✗
- Cap rate
- 5.92%
- Cash-on-cash
- -1.34%
- DSCR
- 0.94
- GRM
- 10.0
CMA / ARV
- ARV (on-the-fly)
- $277,120
- Comps found
- 12
Show comp detail 12 sales within ~0.75 mi
| Address | Dist | Beds/Ba | Sqft | Sold | Price | $/sf | Match |
|---|---|---|---|---|---|---|---|
| 7117 Season Dr Lot 2C | 0.00mi | 4/2.0 | 1,732 (0%) | 2mo | $274,490 | $158 | 99 |
| 6998 Cosmos St | 0.24mi | 4/2.0 | 1,710 (-1%) | 6mo | $229,500 | $134 | 82 |
| 7082 Harvest Way | 0.20mi | 4/2.0 | 1,882 (+9%) | 7mo | $267,000 | $142 | 70 |
| 7073 Jacobsview Ln | 0.11mi | 3/2.0 (-1) | 1,475 (-15%) | 1mo | $247,000 | $167 | 64 |
| 6532 Eagle Crest Dr | 0.72mi | 4/2.0 | 1,762 (+2%) | 1mo | $300,000 | $170 | 63 |
| 6850 Branding Iron Ln | 0.68mi | 3/2.0 (-1) | 1,728 (-0%) | 9mo | $164,000 | $95 | 56 |
| 7301 Copter Ln | 0.64mi | 4/2.0 | 1,580 (-9%) | 1mo | $262,500 | $166 | 55 |
| 6555 Eagle Crest Dr | 0.69mi | 3/2.0 (-1) | 1,576 (-9%) | 2mo | $272,500 | $173 | 46 |
| 6879 Joyce Dr | 0.67mi | 3/2.0 (-1) | 1,898 (+10%) | 2mo | $373,750 | $197 | 46 |
| 6544 Eagle Crest Dr | 0.72mi | 3/2.0 (-1) | 1,533 (-12%) | 1mo | $245,000 | $160 | 42 |
| 6502 Starboard Dr | 0.63mi | 3/2.0 (-1) | 1,480 (-14%) | 0mo | $208,000 | $141 | 41 |
| 6919 Chinarose Ct | 0.66mi | 3/2.0 (-1) | 1,504 (-13%) | 6mo | $220,000 | $146 | 37 |
Match score weights: distance 35% · size 25% · config 20% · recency 20%. Top-matched comps best support the ARV.
Projected returns pro-forma
-3.0% appreciation · 2.7% rent growth · sell at horizon
- IRR
- -18.8%
- Equity multiple
- 0.34×
- Total profit
- $-50,600
- Equity at exit
- $40,927
- IRR
- -11.9%
- Equity multiple
- 0.30×
- Total profit
- $-53,773
- Equity at exit
- $23,733
Cash invested: $76,857 (down + closing). Projections, not guarantees.
Landlord ↔ Tenant lean methodology
- Overall (STATE)
- 87 Strongly Landlord-Friendly
- State Florida
- 87 Strongly Landlord-Friendly · R+3
- County
- — inherits STATE
- City
- — inherits STATE
ZIP-level market 32570
- Home prices YoY
- -15.1%
- Rents YoY
- 2.7%
- Active inventory
- 360
- Price-to-rent
- 10.0×
Monthly cashflow live
- Estimated rent
- $2,293 medium interval (Pro) →
- Mortgage (P&I)
- −$1,439
- Tax est. 1.5%
- −$343 /mo · $4,117/yr
- Insurance
- −$114
- HOA
- −$0
- Vacancy / Maint / Mgmt
- −$481
- Net cashflow
- $-86
Break-even live
Sensitivity live
| Price | -10% $104 | -5% $9 | +0% $-86 | +5% $-181 | +10% $-276 |
|---|---|---|---|---|---|
| Rent | -10% $-267 | -5% $-176 | +0% $-86 | +5% $5 | +10% $95 |
| Rate | -1.0pp $52 | -0.5pp $-16 | base $-86 | +0.5pp $-157 | +1.0pp $-229 |
UW: 25.0% down · 7.5% · 30yr · 1.5% tax · 5.0% vac · 8.0% maint · 8.0% mgmt
Financing live
Cash to close
- Down payment
- $68,622
- Closing costs
- $8,235
- Reserves months
- —
- Total cash needed
- —
Loan-product check · same deal, 3 products live
Conventional
25% down · 7.5% · 30yr
- Down + closing
- —
- Monthly P&I
- —
- Monthly cashflow
- —
- DSCR
- —
- Eligible?
- —
Personal DTI + credit; lowest rate.
DSCR
20% down · 8.5% · 30yr
- Down + closing
- —
- Monthly P&I
- —
- Monthly cashflow
- —
- DSCR
- —
- Eligible?
- —
No personal income docs; deal must DSCR.
Hard money
10% down · 12.0% · 12mo
- Down + closing
- —
- Monthly P&I
- —
- Monthly cashflow
- —
- DSCR
- —
- Eligible?
- —
Short-term bridge; refi at stabilization.
Listing history 7 events
-
2026-06-05days on market $274,490 Active 54 DOM
-
2026-06-03days on market $274,490 Active 53 DOM
-
2026-06-02days on market $274,490 Active 52 DOM
-
2026-06-01days on market $274,490 Active 51 DOM
-
2026-05-31price $274,490 Active 50 DOM
-
2026-05-31days on market $277,490 Active 50 DOM
-
2026-05-31pricedays on market $277,490 Active 49 DOM
ⓘ Source: listings_history table (triggers on properties + properties_extension) + one-shot
backfill from property_details.listing_events for pre-trigger history.
Climate risk First Street
- Flood 1/10 Low FEMA zone X (unshaded) · 0% chance over 30 yrs
- Wildfire 5/10 Major
- Heat 10/10 Extreme 7 d/yr ≥106°F today · 22 d/yr by 30 yrs out
- Wind 9/10 Extreme 99% chance of damaging wind over 30 yrs
- Air quality 2/10 Low 1 unhealthy d/yr today · 1 by 30 yrs out
Nearby sold comps map
Loading sold comps map…
Walkable amenities ~0.75 mi
Loading nearby amenities…
Taxation est. · year 1
- Rental income
- $27,511
- − Mortgage interest
- −$15,376
- − Property taxes
- −$4,117
- − Insurance
- −$1,372
- − Repairs & maintenance
- −$2,201
- − Management
- −$2,201
- − Depreciation
- −$7,985
- Taxable loss
- −$5,742
- Est. tax savings @ 24.0%
- +$1,378
- After-tax cash flow
- $348/yr
For passive investors: Depreciation is non-cash, so a rental often shows a tax loss while cash-flowing — sheltering income. Rental losses are passive: they offset passive income freely, and up to $25,000/yr can offset ordinary (W-2) income if you actively participate and your MAGI is under $100k (phasing out to $0 by $150k); unused losses carry forward. On sale, claimed depreciation is recaptured at up to 25%, and gains may owe capital-gains tax (a 1031 exchange can defer both). Figures are a year-1 estimate at your 24.0% rate — not tax advice; consult a CPA.
Condition & rehab AI · 3 photos
This single-family home in Point Baker, FL, is in good condition with no visible repairs needed. It offers a good investment opportunity with potential for modest improvements to boost its resale and rental value.
Value-add opportunities
- Both Painting exterior and interior — Fresh paint enhances curb appeal and interior aesthetics
- Both Landscaping improvements — Enhances curb appeal and adds value
- Rental HVAC system inspection and maintenance — Ensures comfort and energy efficiency for tenants
Renovation cost estimate screening
Value-add ROI direction
- Both Painting exterior and interior — Fresh paint enhances curb appeal and interior aesthetics ↑
- Both Landscaping improvements — Enhances curb appeal and adds value ↑
- Rental HVAC system inspection and maintenance — Ensures comfort and energy efficiency for tenants ↑
ⓘ Cost ranges are severity-bucket heuristics (US national rule-of-thumb). Get contractor quotes + a written scope before underwriting a rehab budget.
Schools (NCES district)
- District
- Santa Rosa
- NCES district ID
- 1201650
- Math proficiency
- 63% ▼ -6.00%
- Reading proficiency
- 60% ▼ -5.00%
- Median HH income
- $58,161
- Composite
- 53.12/100
- National rank
- #1511
- State rank
- #8 of 73 in FL
Livability — Point Baker
- Score
- 63/100
- State rank
- #735
- US rank
- #15840
Category grades
Schools grade is shown separately in the Schools card above.
Census & demographics
- Census place
- Point Baker, FL
- County
- Santa Rosa County · 194,764 people
- Metro
- Pensacola-Ferry Pass-Brent, FL
- Population (ZIP)
- 37,197
- Household income
- $77,222
- Rent vs Own
- Severe rent burden
- 590.0
Population outlook (Santa Rosa County) Hauer SSP2
- Today (2025)
- 195,978 people
- By 2030
- 209,782 · +7.0%
- By 2040
- 235,293 · +20.1%
- By 2050
- 256,408 · +30.8%
- By 2075
- 298,074 · +52.1%
- By 2100
- 303,216 · +54.7%
Race, ethnicity, and origin ACS 2023
- Neighborhood character
- Predominantly White (80%)
- Race & ethnicity
- White 80% Two or more races 7% Black 6% Hispanic / Latino 6% Asian 1%
- Hispanic origin (detail)
- Mexican 2% Puerto Rican 2%
- Common ancestry
- Italian 4% Lithuanian 3% Portuguese 2%
- Foreign-born
- 4% · Canada
- Languages at home
- 94% English-only · Spanish 4% Other Asian/Pacific 1%
Political lean MEDSL · Santa Rosa
- 2024 margin
- Solid R (+51.0) · D 24.1% · R 75.0%
- 2008→2024 swing
- -3.0pp toward R · 2008: -47.9pp · 2024: -51.0pp
- All cycles
- 2024: R+51.0 2020: R+46.5 2016: R+53.5 2012: R+52.6 2008: R+47.9
Not yet ingested
- Civics
- —
Market trends
- HPI YoY
- ▼ -51.06%
- Current HPI
- 287.7469
- Rent YoY
- ▲ 2.70%
- Metro
- Pensacola-Ferry Pass-Brent, FL
- State GDP YoY
- ▲ 3.28%
- F500 in state
- 36
Industry mix (Fortune 500 HQ in FL)
| Industry | F500 HQs | Revenue |
|---|---|---|
| Industrial Technology | 2 | $29B |
|
||
| Insurance | 2 | $17B |
|
||
| Retail | 1 | $60B |
|
||
| Technology Distribution | 1 | $58B |
|
||
| Homebuilding | 1 | $35B |
|
||
| Technology Manufacturing | 1 | $35B |
|
||
Cash-flow waterfall
monthlySold comps — $/sqft
last 12 mo · ≤1 miLoading sold comps…