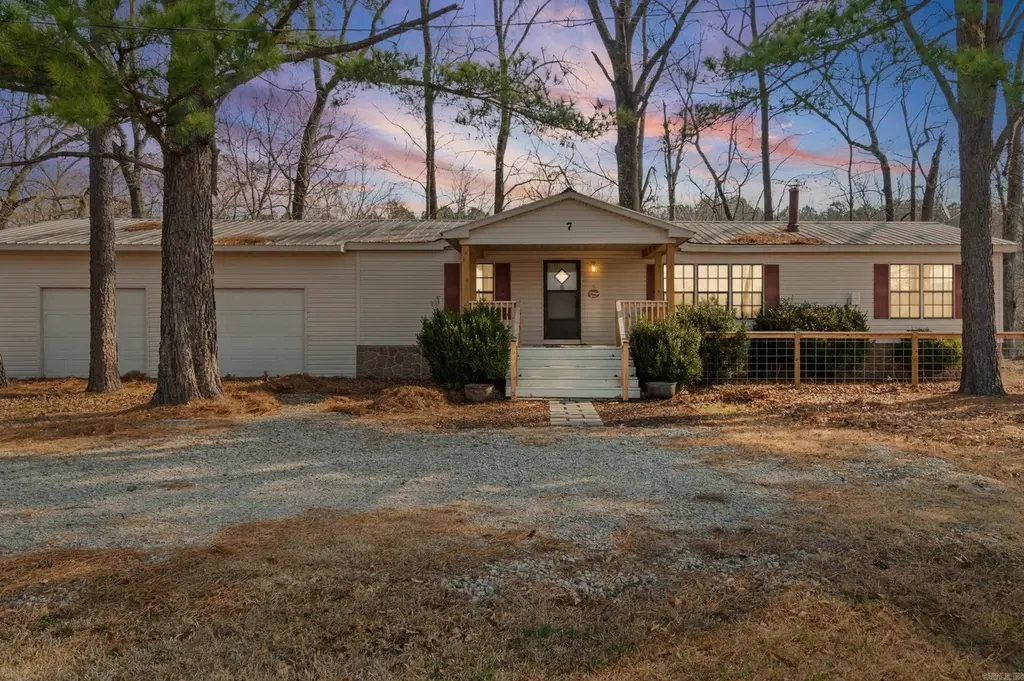
7 Iveon Clay Ln · Pangburn, AR
Flood risk 4/10 · Minor
- FEMA flood zone
- X (unshaded)
- Chance of flooding over 30 yrs
- 0.21%
- Est. flood insurance / yr
- $507 – $1,088
Fire risk 5/10 · Moderate
- Est. fire insurance / yr
- $1,499 – $2,785
Heat risk 5/10 · Moderate
- Hot days now (above 109°F)
- 7 days/yr
- Hot days in 30 yrs
- 19 days/yr
Wind risk 3/10 · Minor
- Chance of severe wind over 30 yrs
- 5.0%
Air-quality risk 1/10 · Minimal
- Unhealthy air days now
- 0 days/yr
- Unhealthy air days in 30 yrs
- 0 days/yr
Risk factors via First Street. Map © Google.
Why this score? — see what drove the F grade
The composite is a weighted blend of 9 inputs, each scored 0–100. Each bar is that input's sub-score; the figure is the points it added to the 100-point composite (weight × sub-score).
- ARV discount +7.5/15.0
- Appreciation +6.7/10.0
- Cash flow +6.2/30.0
- Livability +3.1/5.0
- Schools +2.9/10.0
- Rent growth +2.5/5.0
- Condition / age +2.5/5.0
- 1% rule +0.5/10.0
- DSCR +0.5/10.0
$199,900
🖨 Deal sheet 📄 Offer letter ✓ Due diligence
Listing remarks MLS
Sitting on 1.79 acres on the Little Red River, this property is the perfect trout fisherman's getaway! This home is a short drive to town, but feels miles from civilization by offering stunning river front views. This home has many features such as a new soaking tub with its own instant water heater, and new large sliding doors out to a brand new back deck perfect for enjoying the river views whether you're inside or outside! Each of the three bedrooms include closets and the attached two car garage provides loads of added storage space for all of your vehicles or boats. Would make a great full time residence or vacation home/rental!
Key facts
- Brand new back deck
- New soaking tub
- River front views
Tags
Neighborhood map
What this means for you Summary
Snapshot
- This is a 3-bed/2.0-bath manufactured listed at $200k.
Deal economics
- At list price, monthly cash flow is $-368 ($-4k/yr) — negative.
- To cash-flow at today's rent, offer at most $135k (32.5% below list).
- To meet the 1% rule (rent ≥ 1% of price), the offer needs to be $110k (44.8% below list).
- Recommended offer: $110k (44.8% below list) — sets the bar for 1% rule.
- Cap rate 4.1% vs local median 1.2% in Pangburn — top-decile yield for the area; either an underpriced asset or a hidden risk that comps aren't pricing in. Stress-test before assuming the spread holds.
Location & tenants
- Location reads 62/100 on livability (#214 in AR) — a middle-class / working-renter tenant base. Strengths: cost of living A+, housing A+, health & safety A; Watch: schools C-, crime F, amenities F.
- Pangburn School District (rural): math 35% / reading 35% proficiency, ranked #117 of 238 in AR (top 49%) — families likely to look elsewhere, expect single-tenant / working-renter base with shorter leases.
- Market conditions: 49 active listings in the ZIP; 219 units permitted in White County in 2024 (36 in 5+ unit buildings).
Forward outlook
- In year one you build about $8k of equity ($1k loan paydown + $7k appreciation (3.5% local appreciation)).
- White County population projected at +7% by 2050 — modest demand growth; plan on rents tracking national, not racing it.
- By year 5, paydown + projected appreciation supports a ~$36k cash-out refi (75% LTV) — recoverable capital for the next deal without selling this one.
Negotiation context
- It's been on market 98 days — a 9% lower offer ($182k) is reasonable based on typical stale-listing flexibility.
- Current owner paid $90k; list at $200k implies a 122% gain — meaningful room to come down on a strong offer.
Risks & watch-outs
- Climate carrying-cost: moderate wildfire risk; extreme-heat days projected 7→19/yr by 2055 (HVAC capex compounding) — expect insurance premiums to compound above CPI over the hold.
Questions for the listing agent
- What do current leases actually rent for vs. the listed asking? Can we see a recent rent roll and the last 12 months of T-12 income?
- It's been on market 98 days. Have you received any prior offers? Is the seller open to a 45% concession, seller financing, or rate buy-down credit?
- Why hasn't it sold? Are there any deal-killer items the seller is aware of (foundation, flood, title, zoning, code violations)?
- Is there a deadline driving the sale (1031 exchange, divorce, estate, relocation)? That informs how much negotiation room exists.
- Crime grade is F in this area — have there been break-ins, vandalism, or insurance claims at this property in the last 3 years? What carrier currently insures it and at what premium?
- The area grade is low — what's the realistic commute time and amenity access for the typical tenant pool here? Any planned neighborhood developments (good or bad) we should know about?
- What's the average days-on-market for RENTAL listings here right now (not sales)? A rising rental-DOM trend means longer vacancies and softer asking-rent achievability than the comps imply.
- What's the recent tenant-quality profile in this submarket — average credit score on applications, eviction rate, late-payment / NSF rate, and stable-employment percentage? A property-management company in the area should have these aggregated.
- How much new for-sale + rental construction is in the pipeline within 1–3 miles? Heavy new supply typically softens prices + rents 12–24 months out; constrained supply supports both.
Investment metrics
- 1% rule
- 0.55% ✗
- Cap rate
- 4.09%
- Cash-on-cash
- -7.88%
- DSCR
- 0.65
- GRM
- 15.1
CMA / ARV
No comps found within radius.
Projected returns pro-forma
3.49% appreciation · 3.0% rent growth · sell at horizon
- IRR
- 1.8%
- Equity multiple
- 1.10×
- Total profit
- $5,877
- Equity at exit
- $95,504
- IRR
- 5.2%
- Equity multiple
- 1.84×
- Total profit
- $47,263
- Equity at exit
- $151,710
Cash invested: $55,972 (down + closing). Projections, not guarantees.
Landlord ↔ Tenant lean methodology
- Overall (STATE)
- 92 Strongly Landlord-Friendly
- State Arkansas
- 92 Strongly Landlord-Friendly · R+14
- County
- — inherits STATE
- City
- — inherits STATE
ZIP-level market 72121
- Home prices YoY
- 1.5%
- Active inventory
- 49
- Price-to-rent
- 15.1×
Monthly cashflow live
- Estimated rent
- $1,104 medium interval (Pro) →
- Mortgage (P&I)
- −$1,048
- Tax from tax record
- −$108 /mo · $1,296/yr
- Insurance
- −$83
- HOA
- −$0
- Vacancy / Maint / Mgmt
- −$232
- Net cashflow
- $-368
Break-even live
UW: 25.0% down · 7.5% · 30yr · 1.5% tax · 5.0% vac · 8.0% maint · 8.0% mgmt
Financing live
Cash to close
- Down payment
- $49,975
- Closing costs
- $5,997
- Reserves months
- —
- Total cash needed
- —
Loan-product check · same deal, 3 products live
Conventional
25% down · 7.5% · 30yr
- Down + closing
- —
- Monthly P&I
- —
- Monthly cashflow
- —
- DSCR
- —
- Eligible?
- —
Personal DTI + credit; lowest rate.
DSCR
20% down · 8.5% · 30yr
- Down + closing
- —
- Monthly P&I
- —
- Monthly cashflow
- —
- DSCR
- —
- Eligible?
- —
No personal income docs; deal must DSCR.
Hard money
10% down · 12.0% · 12mo
- Down + closing
- —
- Monthly P&I
- —
- Monthly cashflow
- —
- DSCR
- —
- Eligible?
- —
Short-term bridge; refi at stabilization.
Listing history 12 events
-
2026-06-08days on market $199,900 Active 98 DOM
-
2026-06-07days on market $199,900 Active 97 DOM
-
2026-06-05days on market $199,900 Active 94 DOM
-
2026-06-03days on market $199,900 Active 93 DOM
-
2026-06-02days on market $199,900 Active 92 DOM
-
2026-06-01days on market $199,900 Active 91 DOM
-
2026-05-31days on market $199,900 Active 90 DOM
-
2026-05-30days on market $199,900 Active 89 DOM
-
2026-04-08price $199,900 641-char remark
Show marketing remark (641 chars)
Sitting on 1.79 acres on the Little Red River, this property is the perfect trout fisherman's getaway! This home is a short drive to town, but feels miles from civilization by offering stunning river front views. This home has many features such as a new soaking tub with its own instant water heater, and new large sliding doors out to a brand new back deck perfect for enjoying the river views whether you're inside or outside! Each of the three bedrooms include closets and the attached two car garage provides loads of added storage space for all of your vehicles or boats. Would make a great full time residence or vacation home/rental!
-
2026-03-02$229,900 New Listing 641-char remark
Show marketing remark (641 chars)
Sitting on 1.79 acres on the Little Red River, this property is the perfect trout fisherman's getaway! This home is a short drive to town, but feels miles from civilization by offering stunning river front views. This home has many features such as a new soaking tub with its own instant water heater, and new large sliding doors out to a brand new back deck perfect for enjoying the river views whether you're inside or outside! Each of the three bedrooms include closets and the attached two car garage provides loads of added storage space for all of your vehicles or boats. Would make a great full time residence or vacation home/rental!
-
2024-05-01soldstatus $90,000
-
1998-08-28soldstatus $20,000
ⓘ Source: listings_history table (triggers on properties + properties_extension) + one-shot
backfill from property_details.listing_events for pre-trigger history.
Tax reassessment forecast AR · Resets to sale price
- Current annual tax
- $1,296 · $108/mo
- Projected year-2 tax
- $1,296 · $108/mo
- Expected delta
- $0/yr ($0/mo · 0.0%)
ⓘ Screening estimate from a state-policy table — verify with the county assessor before closing.
Climate risk First Street
- Flood 4/10 Moderate FEMA zone X (unshaded) · 21% chance over 30 yrs
- Wildfire 5/10 Major
- Heat 5/10 Major 7 d/yr ≥109°F today · 19 d/yr by 30 yrs out
- Wind 3/10 Moderate 5% chance of damaging wind over 30 yrs
- Air quality 1/10 Low 0 unhealthy d/yr today · 0 by 30 yrs out
Nearby sold comps map
Loading sold comps map…
Walkable amenities ~0.75 mi
Loading nearby amenities…
Taxation est. · year 1
- Rental income
- $13,244
- − Mortgage interest
- −$11,198
- − Property taxes
- −$1,296
- − Insurance
- −$1,000
- − Repairs & maintenance
- −$1,060
- − Management
- −$1,060
- − Depreciation
- −$5,815
- Taxable loss
- −$8,183
- Est. tax savings @ 24.0%
- +$1,964
- After-tax cash flow
- $-2,448/yr
For passive investors: Depreciation is non-cash, so a rental often shows a tax loss while cash-flowing — sheltering income. Rental losses are passive: they offset passive income freely, and up to $25,000/yr can offset ordinary (W-2) income if you actively participate and your MAGI is under $100k (phasing out to $0 by $150k); unused losses carry forward. On sale, claimed depreciation is recaptured at up to 25%, and gains may owe capital-gains tax (a 1031 exchange can defer both). Figures are a year-1 estimate at your 24.0% rate — not tax advice; consult a CPA.
Schools (NCES district)
- District
- Pangburn School District
- NCES district ID
- 0511070
- Math proficiency
- 35% ▼ -15.00%
- Reading proficiency
- 35% ▼ -11.00%
- Median HH income
- $40,309
- Composite
- 29.43/100
- National rank
- #6521
- State rank
- #117 of 238 in AR
Livability — Pangburn
- Score
- 62/100
- State rank
- #214
- US rank
- #16538
Category grades
Schools grade is shown separately in the Schools card above.
Census & demographics
- Population (ZIP)
- 2,975
Population outlook (White County) Hauer SSP2
- Today (2025)
- 82,310 people
- By 2030
- 83,861 · +1.9%
- By 2040
- 86,492 · +5.1%
- By 2050
- 88,246 · +7.2%
- By 2075
- 91,307 · +10.9%
- By 2100
- 91,548 · +11.2%
Race, ethnicity, and origin ACS 2023
- Neighborhood character
- Predominantly White (93%)
- Race & ethnicity
- White 93% Two or more races 7%
- Common ancestry
- Slovak 6% Iranian 2% Romanian 1%
- Foreign-born
- 0%
Political lean MEDSL · White
- 2024 margin
- Solid R (+61.2) · D 18.3% · R 79.5% · Other 2.2%
- 2008→2024 swing
- -14.0pp toward R · 2008: -47.2pp · 2024: -61.2pp
- All cycles
- 2024: R+61.2 2020: R+58.9 2016: R+57.9 2012: R+53.7 2008: R+47.2
Not yet ingested
- Civics
- —
Market trends
- HPI YoY
- ▲ 3.49%
- Current HPI
- 239.1461
- Rent YoY
- —
- Metro
- —
- State GDP YoY
- ▲ 3.80%
- F500 in state
- 10
Industry mix (Fortune 500 HQ in AR)
| Industry | F500 HQs | Revenue |
|---|---|---|
| Retail | 1 | $681B |
|
||
| Food / Agriculture | 1 | $53B |
|
||
| Retail / Energy | 1 | $22B |
|
||
| Transportation / Logistics | 1 | $12B |
|
||
| Energy | 1 | $4B |
|
||
Price history
+899.5% since first listed4 events — show timeline
- 2026-04-08 Price Changed $199,900 CARMLS
- 2026-03-02 Listed $229,900 CARMLS
- 2024-05-01 Sold (Public Records) $90,000 Public Records
- 1998-08-28 Sold (Public Records) $20,000 Public Records
Property tax history
+6.0%/yrLatest (2025): $1,296 · +17.0% YoY. Source: county tax records.
Cash-flow waterfall
monthlySold comps — $/sqft
last 12 mo · ≤1 miLoading sold comps…