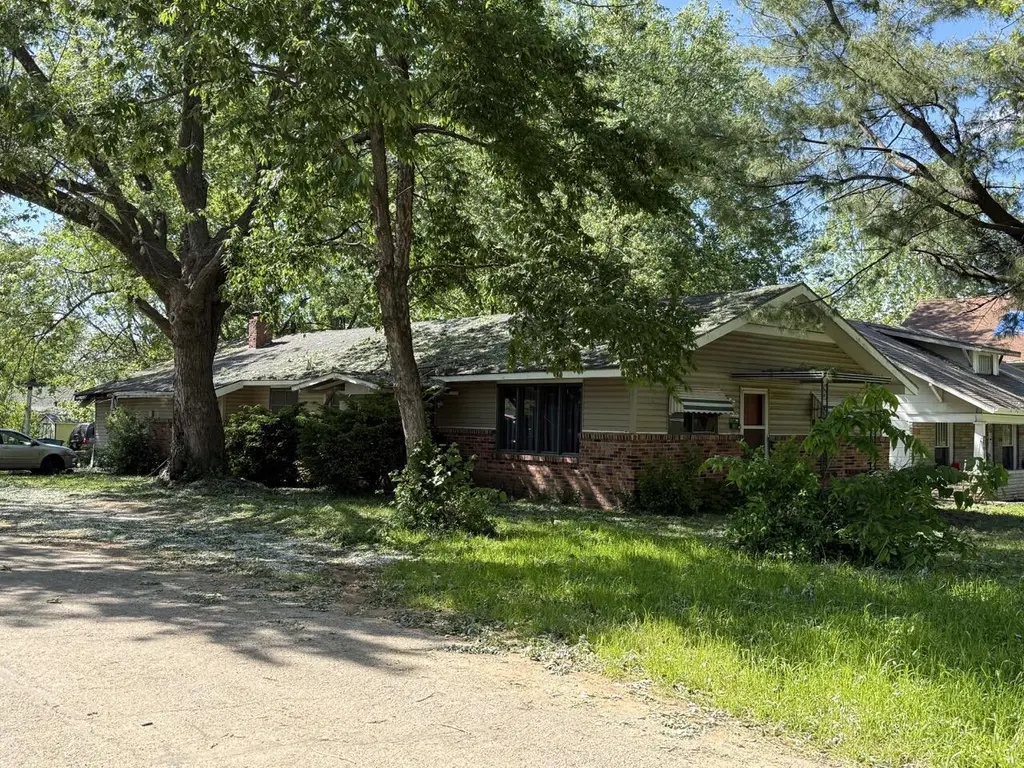
2301 N Franklin Ave · Springfield, MO
Flood risk 1/10 · Minimal
- FEMA flood zone
- X (unshaded)
- Chance of flooding over 30 yrs
- 0.0%
- Est. flood insurance / yr
- $507 – $1,088
Fire risk 2/10 · Minimal
- Est. fire insurance / yr
- $1,054 – $1,958
Heat risk 5/10 · Moderate
- Hot days now (above 105°F)
- 7 days/yr
- Hot days in 30 yrs
- 19 days/yr
Wind risk 2/10 · Minimal
- Chance of severe wind over 30 yrs
- —
Air-quality risk 2/10 · Minimal
- Unhealthy air days now
- 1 days/yr
- Unhealthy air days in 30 yrs
- 2 days/yr
Risk factors via First Street. Map © Google.
Why this score? — see what drove the C grade
The composite is a weighted blend of 9 inputs, each scored 0–100. Each bar is that input's sub-score; the figure is the points it added to the 100-point composite (weight × sub-score).
- Cash flow +20.0/30.0
- ARV discount +13.9/15.0
- DSCR +6.4/10.0
- 1% rule +4.4/10.0
- Livability +3.8/5.0
- Rent growth +3.6/5.0
- Schools +3.2/10.0
- Condition / age +2.5/5.0
- Appreciation +0.0/10.0
$150,000
🖨 Deal sheet (PDF) 📄 Offer letter ✓ Due diligence
Listing remarks
Great investment opportunity in north Springfield with convenient access to I-44, shopping, dining, and local amenities. This home offers strong rental or value-add potential with a functional layout and long-term upside for investors or owner-occupants looking for an affordable property with potential. Sold as-is.
Key facts
- North springfield
- Convenient access
- Functional layout
Tags
Property features AI
Finance
- Other: Tax annual amount listed (not included per instructions)
- Financial info: No investor or income/expense details provided
- HOA & community: No HOA details provided
Exterior
- Parking: No parking details provided
- Security: No security details provided
- Utilities: Public water; Public sewer
- Home design: Single-family residence; One story
- Construction: Year built not provided; Construction materials not provided; Roof/foundation details not provided
- Exterior features: 0.2-acre lot; Subdivision: Greene-Not in List; Directions: From Kearney and Franklin head south on Franklin. House will be on left (west) side of road.
Interior
- Kitchen: No kitchen appliance details provided
- Bedrooms: Not specified
- Flooring: No flooring details provided
- Bathrooms: 2 full bathrooms
- Heating & cooling: Has heating (type listed as Other); No cooling
- Interior features: One-level living
- Laundry & utility: No laundry details provided
Neighborhood map
What this means for you Summary
Snapshot
- This is a 3-bed/2.0-bath single-family listed at $150k.
Deal economics
- At list price, monthly cash flow is $185 ($2k/yr) — positive.
- The deal already cash-flows at list — no discount required.
- To meet the 1% rule (rent ≥ 1% of price), the offer needs to be $140k (6.5% below list).
- Recommended offer: $140k (6.5% below list) — sets the bar for 1% rule.
- Cap rate 7.8% vs local median 4.6% in Springfield — top-decile yield for the area; either an underpriced asset or a hidden risk that comps aren't pricing in. Stress-test before assuming the spread holds.
Location & tenants
- Location reads 75/100 on livability (#57 in MO, #4,121 nationally) — a middle-class / working-renter tenant base. Strengths: commute A+, cost of living A+, housing A+; Watch: crime F, employment F.
- Springfield R-XII (urban): math 32% / reading 46% proficiency, ranked #174 of 324 in MO (top 54%) — families likely to look elsewhere, expect single-tenant / working-renter base with shorter leases.
- Zoned schools: Bowerman Elem. (math 17% / reading 27%, grade F, #910 of 1,115 statewide, top 83%, 243 students, 90% FRL); Reed Middle (math 33% / reading 44%, grade F, #202 of 391 statewide, top 54%, 512 students, 70% FRL); Hillcrest High (math 9% / reading 35%, grade F, #462 of 521 statewide, top 90%, 1,017 students, 64% FRL) — zoned schools average 74% FRL vs 46% district-wide (28 pts higher); higher-poverty schools than district average — tighter screening recommended.
- Market conditions: Rents rising fast (+4.2%/yr); 401 active listings in the ZIP; 1,302 units permitted in Greene County in 2024 (250 in 5+ unit buildings).
- This rent runs 33% of the median local income ($51k/yr) — at the standard rent-burdened threshold; future hikes will face affordability resistance.
Forward outlook
- Local home prices are declining (-3.0%/yr); year-one equity from $1k of loan paydown is wiped out by about $4k of value loss. Plan a longer hold.
- Greene County population projected at +25% by 2050 — long-run rental-demand tailwind backs the buy-and-hold thesis.
Negotiation context
- It's been on market 38 days — a 3% lower offer ($146k) is reasonable based on typical stale-listing flexibility.
- 3 sale attempts since 10y ago with the ask held roughly flat each time — persistent listings suggest the price (not the market) is what's stuck; bring a comps-based counter.
Risks & watch-outs
- Climate carrying-cost: extreme-heat days projected 7→19/yr by 2055 (HVAC capex compounding) — expect insurance premiums to compound above CPI over the hold.
Questions for the listing agent
- It's been on market 38 days. Have you received any prior offers? Is the seller open to a 6% concession, seller financing, or rate buy-down credit?
- Built in 1967 — when were the roof, HVAC, electrical panel, plumbing, and water heater last replaced?
- Is there a deadline driving the sale (1031 exchange, divorce, estate, relocation)? That informs how much negotiation room exists.
- Crime grade is F in this area — have there been break-ins, vandalism, or insurance claims at this property in the last 3 years? What carrier currently insures it and at what premium?
- What's the average days-on-market for RENTAL listings here right now (not sales)? A rising rental-DOM trend means longer vacancies and softer asking-rent achievability than the comps imply.
- What's the recent tenant-quality profile in this submarket — average credit score on applications, eviction rate, late-payment / NSF rate, and stable-employment percentage? A property-management company in the area should have these aggregated.
- How much new for-sale + rental construction is in the pipeline within 1–3 miles? Heavy new supply typically softens prices + rents 12–24 months out; constrained supply supports both.
Investment metrics
- 1% rule
- 0.94% ✗
- Cap rate
- 7.77%
- Cash-on-cash
- 5.28%
- DSCR
- 1.24
- GRM
- 8.9
CMA / ARV
- ARV (median comp)
- $175,012
- List price
- $150,000
- Delta
- -14.29%
- Verdict
- UNDERPRICED
- Comps
- 20 within 1.0 mi
Show comp detail 12 sales within ~0.75 mi
| Address | Dist | Beds/Ba | Sqft | Sold | Price | $/sf | Match |
|---|---|---|---|---|---|---|---|
| 2444 N Franklin Ave | 0.21mi | 3/2.0 | 1,979 (+1%) | 8mo | $185,000 | $93 | 82 |
| 2223 N Nettleton Ave | 0.36mi | 4/2.0 (+1) | 1,922 (-2%) | 10mo | $198,000 | $103 | 67 |
| 1874 N Main Ave | 0.67mi | 4/2.0 (+1) | 1,982 (+2%) | 1mo | $199,900 | $101 | 60 |
| 2645 N Fort Ave | 0.48mi | 3/2.0 | 2,112 (+8%) | 5mo | $210,000 | $99 | 60 |
| 1896 N Douglas Ave | 0.54mi | 4/2.0 (+1) | 1,825 (-6%) | 1mo | $209,000 | $115 | 58 |
| 2633 N Fort Ave | 0.46mi | 3/2.0 | 2,112 (+8%) | 9mo | $210,000 | $99 | 57 |
| 2639 N Fort Ave | 0.47mi | 3/2.0 | 2,112 (+8%) | 12mo | $215,000 | $102 | 54 |
| 2054 N Campbell Ave | 0.66mi | 4/2.5 (+1) | 2,100 (+8%) | 4mo | $199,900 | $95 | 46 |
| 1871 N Douglas Ave | 0.56mi | 3/2.0 | 1,738 (-11%) | 11mo | $219,500 | $126 | 46 |
| 1885 N Lyon Ave | 0.69mi | 3/2.0 | 1,791 (-8%) | 9mo | $115,000 | $64 | 46 |
| 1923 N Campbell Ave | 0.70mi | 4/2.0 (+1) | 2,112 (+8%) | 9mo | $238,777 | $113 | 41 |
| 818 W Woodridge St | 0.61mi | 4/2.0 (+1) | 1,698 (-13%) | 13mo | $189,900 | $112 | 34 |
Match score weights: distance 35% · size 25% · config 20% · recency 20%. Top-matched comps best support the ARV.
Projected returns pro-forma
-3.0% appreciation · 4.24% rent growth · sell at horizon
- IRR
- -6.9%
- Equity multiple
- 0.74×
- Total profit
- $-10,803
- Equity at exit
- $22,365
- IRR
- 4.1%
- Equity multiple
- 1.31×
- Total profit
- $13,020
- Equity at exit
- $12,969
Cash invested: $42,000 (down + closing). Projections, not guarantees.
Landlord ↔ Tenant lean methodology
- Overall (STATE)
- 81 Strongly Landlord-Friendly
- State Missouri
- 81 Strongly Landlord-Friendly · R+10
- County
- — inherits STATE
- City
- — inherits STATE
ZIP-level market 65803
- Home prices YoY
- -29.8%
- Rents YoY
- 4.2%
- Active inventory
- 401
- Price-to-rent
- 8.9×
Monthly cashflow live
- Estimated rent
- $1,403 medium interval (Pro) →
- Mortgage (P&I)
- −$787
- Tax from tax record
- −$74 /mo · $888/yr
- Insurance
- −$62
- HOA
- −$0
- Vacancy / Maint / Mgmt
- −$295
- Net cashflow
- $185
Break-even live
Sensitivity live
| Price | -10% $270 | -5% $227 | +0% $185 | +5% $143 | +10% $100 |
|---|---|---|---|---|---|
| Rent | -10% $74 | -5% $130 | +0% $185 | +5% $240 | +10% $296 |
| Rate | -1.0pp $261 | -0.5pp $223 | base $185 | +0.5pp $146 | +1.0pp $107 |
UW: 25.0% down · 7.5% · 30yr · 1.5% tax · 5.0% vac · 8.0% maint · 8.0% mgmt
Financing live
Cash to close
- Down payment
- $37,500
- Closing costs
- $4,500
- Reserves months
- —
- Total cash needed
- —
Loan-product check · same deal, 3 products live
Conventional
25% down · 7.5% · 30yr
- Down + closing
- —
- Monthly P&I
- —
- Monthly cashflow
- —
- DSCR
- —
- Eligible?
- —
Personal DTI + credit; lowest rate.
DSCR
20% down · 8.5% · 30yr
- Down + closing
- —
- Monthly P&I
- —
- Monthly cashflow
- —
- DSCR
- —
- Eligible?
- —
No personal income docs; deal must DSCR.
Hard money
10% down · 12.0% · 12mo
- Down + closing
- —
- Monthly P&I
- —
- Monthly cashflow
- —
- DSCR
- —
- Eligible?
- —
Short-term bridge; refi at stabilization.
Listing history 19 events
-
2026-06-22days on market $150,000 Active 38 DOM
-
2026-06-18days on market $150,000 Active 35 DOM
-
2026-06-17days on market $150,000 Active 34 DOM
-
2026-06-16days on market $150,000 Active 33 DOM
-
2026-06-15days on market $150,000 Active 32 DOM
-
2026-06-14days on market $150,000 Active 30 DOM
-
2026-06-10days on market $150,000 Active 27 DOM
-
2026-06-09days on market $150,000 Active 26 DOM
-
2026-06-08days on market $150,000 Active 25 DOM
-
2026-06-07days on market $150,000 Active 24 DOM
-
2026-06-03days on market $150,000 Active 20 DOM
-
2026-06-02days on market $150,000 Active 19 DOM
-
2026-06-01days on market $150,000 Active 18 DOM
-
2026-05-31days on market $150,000 Active 17 DOM
-
2026-05-30days on market $150,000 Active 16 DOM
-
2026-05-14$150,000 Active 316-char remark
-
2019-03-15soldstatus $355,524
-
2017-01-17$75,000
-
2016-01-19$88,423
ⓘ Source: listings_history table (triggers on properties + properties_extension) + one-shot
backfill from property_details.listing_events for pre-trigger history.
Tax reassessment forecast MO · Resets to sale price
- Current annual tax
- $888 · $74/mo
- Projected year-2 tax
- $1,455 · $121/mo
- Expected delta
- +$567/yr (+$47/mo · 63.9%)
ⓘ Screening estimate from a state-policy table — verify with the county assessor before closing.
Climate risk First Street
- Flood 1/10 Low FEMA zone X (unshaded) · 0% chance over 30 yrs
- Wildfire 2/10 Low
- Heat 5/10 Major 7 d/yr ≥105°F today · 19 d/yr by 30 yrs out
- Wind 2/10 Low
- Air quality 2/10 Low 1 unhealthy d/yr today · 2 by 30 yrs out
Nearby sold comps map
Loading sold comps map…
Walkable amenities ~0.75 mi
Loading nearby amenities…
Taxation est. · year 1
- Rental income
- $16,831
- − Mortgage interest
- −$8,402
- − Property taxes
- −$888
- − Insurance
- −$750
- − Repairs & maintenance
- −$1,347
- − Management
- −$1,347
- − Depreciation
- −$4,364
- Taxable loss
- −$265
- Est. tax savings @ 24.0%
- +$64
- After-tax cash flow
- $2,283/yr
For passive investors: Depreciation is non-cash, so a rental often shows a tax loss while cash-flowing — sheltering income. Rental losses are passive: they offset passive income freely, and up to $25,000/yr can offset ordinary (W-2) income if you actively participate and your MAGI is under $100k (phasing out to $0 by $150k); unused losses carry forward. On sale, claimed depreciation is recaptured at up to 25%, and gains may owe capital-gains tax (a 1031 exchange can defer both). Figures are a year-1 estimate at your 24.0% rate — not tax advice; consult a CPA.
Schools (NCES district)
- District
- Springfield R-XII
- NCES district ID
- 2928860
- Math proficiency
- 32% ▼ -2.00%
- Reading proficiency
- 46% ▼ -3.00%
- Median HH income
- $37,886
- Composite
- 32.45/100
- National rank
- #5717
- State rank
- #174 of 324 in MO
Livability — Springfield
- Score
- 75/100
- State rank
- #57
- US rank
- #4121
Category grades
Schools grade is shown separately in the Schools card above.
Census & demographics
- Census place
- Springfield, MO
- County
- Greene County · 244,327 people
- City population
- 223,044
- Metro
- Springfield, MO
- Population (ZIP)
- 42,882
- Household income
- $50,572
- Rent vs Own
- Severe rent burden
- 1305.0
Population outlook (Greene County) Hauer SSP2
- Today (2025)
- 319,054 people
- By 2030
- 335,135 · +5.0%
- By 2040
- 366,186 · +14.8%
- By 2050
- 397,431 · +24.6%
- By 2075
- 477,035 · +49.5%
- By 2100
- 520,828 · +63.2%
Race, ethnicity, and origin ACS 2023
- Neighborhood character
- Predominantly White (82%)
- Race & ethnicity
- White 82% Two or more races 9% Hispanic / Latino 6% Black 4%
- Hispanic origin (detail)
- Mexican 2% Puerto Rican 2%
- Common ancestry
- Lithuanian 2% Italian 2% Iranian 2%
- Foreign-born
- 3% · Canada
- Languages at home
- 95% English-only · Spanish 3%
Political lean MEDSL · Greene
- 2024 margin
- Strong R (+20.8) · D 38.9% · R 59.7% · Other 1.4%
- 2008→2024 swing
- -5.0pp toward R · 2008: -15.8pp · 2024: -20.8pp
- All cycles
- 2024: R+20.8 2020: R+20.1 2016: R+27.4 2012: R+24.4 2008: R+15.8
Not yet ingested
- Civics
- —
Market trends
- HPI YoY
- ▼ -87.08%
- Current HPI
- 205.0439
- Rent YoY
- ▲ 4.24%
- Metro
- Springfield, MO
- State GDP YoY
- ▲ 1.84%
- F500 in state
- 20
Industry mix (Fortune 500 HQ in MO)
| Industry | F500 HQs | Revenue |
|---|---|---|
| Healthcare | 1 | $163B |
|
||
| Insurance | 1 | $21B |
|
||
| Industrial Technology | 1 | $17B |
|
||
| Retail | 1 | $16B |
|
||
| Industrial Distribution | 1 | $10B |
|
||
| Utilities | 1 | $9B |
|
||
Price history
+69.6% since first listed4 events — show timeline
- 2026-05-14 Listed $150,000 SOMO
- 2019-03-15 Sold (Public Records) $355,524 Public Records
- 2017-01-17 Listed $75,000 SOMO
- 2016-01-19 Listed $88,423 SOMO
Property tax history
+2.3%/yrLatest (2025): $888 · +14.8% YoY. Source: county tax records.
Cash-flow waterfall
monthlySold comps — $/sqft
last 12 mo · ≤1 miLoading sold comps…