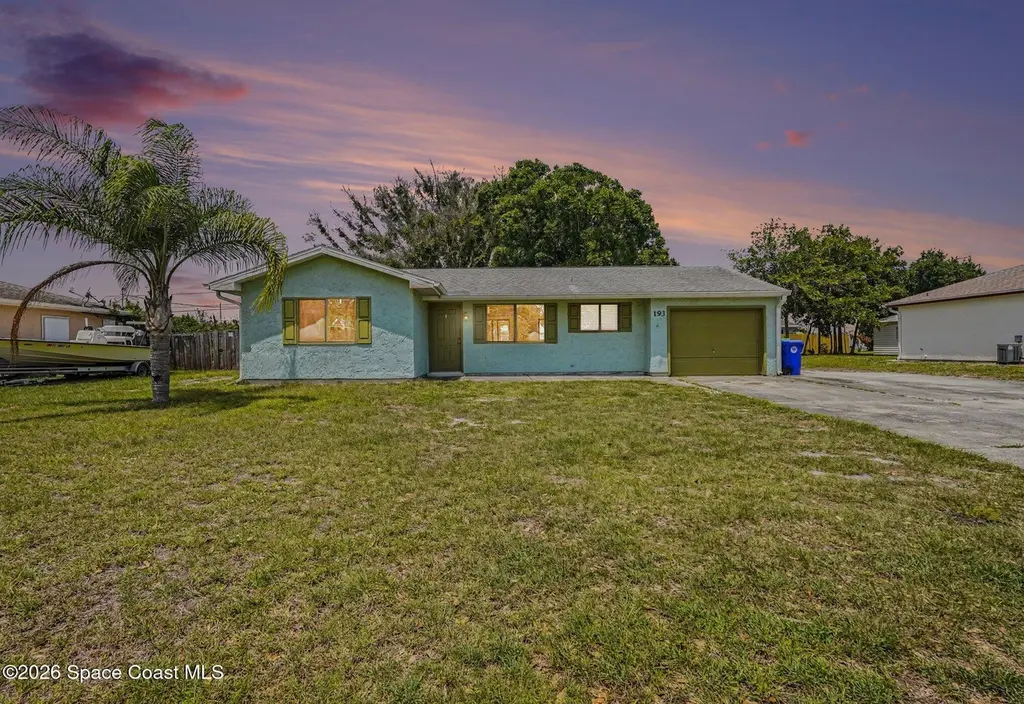
193 Mabry St · Sebastian, FL
Flood risk 1/10 · Minimal
- FEMA flood zone
- AE
- Chance of flooding over 30 yrs
- 0.0%
- Est. flood insurance / yr
- $1,737 – $8,500
Fire risk 2/10 · Minimal
- Est. fire insurance / yr
- $947 – $1,759
Heat risk 10/10 · Severe
- Hot days now (above 105°F)
- 7 days/yr
- Hot days in 30 yrs
- 24 days/yr
Wind risk 10/10 · Severe
- Chance of severe wind over 30 yrs
- 99.0%
Air-quality risk 1/10 · Minimal
- Unhealthy air days now
- 0 days/yr
- Unhealthy air days in 30 yrs
- 0 days/yr
Risk factors via First Street. Map © Google.
Why this score? — see what drove the B- grade
The composite is a weighted blend of 9 inputs, each scored 0–100. Each bar is that input's sub-score; the figure is the points it added to the 100-point composite (weight × sub-score).
- Cash flow +25.2/30.0
- ARV discount +15.0/15.0
- DSCR +8.3/10.0
- 1% rule +6.7/10.0
- Schools +4.2/10.0
- Rent growth +4.1/5.0
- Livability +4.0/5.0
- Condition / age +2.5/5.0
- Appreciation +0.0/10.0
$199,000
🖨 Deal sheet 📄 Offer letter ✓ Due diligence
Listing remarks MLS
Fixer upper just waiting for you! You will love the back yard! Cute home with potential. Home has 2 bedrooms and 1 full bath. Bring your paint brush and your tool belt and make this one your own!
Key facts
- 0.23 acre lot
- Garage
- Built 1983
Property features AI
Finance
- Other: Unfurnished; Lot approximately 0.23 acres (80 ft x 125 ft)
Exterior
- Parking: Garage (1 car)
- Utilities: Public sewer; Electricity connected; Water connected; Sewer connected
- Home design: Single family residence; One level; Entry at level 1; North-facing
- Construction: Concrete and stucco construction; Shingle roof
- Exterior features: Patio; Fenced yard; Asphalt road access
Interior
- Kitchen: Electric range; Microwave; Dishwasher; Refrigerator; Electric water heater
- Bedrooms: 2 bedrooms (both on the first floor)
- Flooring: Carpet
- Bathrooms: 1 full bathroom
- Heating & cooling: Central heating (electric); Central air conditioning (electric)
- Interior features: Ceiling fans; Primary bedroom on the first floor; 5 total rooms
- Laundry & utility: Washer and dryer included; Electric dryer hookup
Neighborhood map
What this means for you Summary
Snapshot
- This is a 3-bed/2.0-bath single-family listed at $199k.
Deal economics
- At list price, monthly cash flow is $18 ($214/yr) — positive.
- The deal already cash-flows at list — no discount required.
- Meets the 1% rule at list price ($2k rent vs $199k).
- Recommended offer: $193k (3.0% below list) — sets the bar for market timing.
- Cap rate 9.0% vs local median 4.4% in Sebastian — top-decile yield for the area; either an underpriced asset or a hidden risk that comps aren't pricing in. Stress-test before assuming the spread holds.
Location & tenants
- Location reads 81/100 on livability (#89 in FL, #1,421 nationally) — a professional / high-income tenant draw. Strengths: housing A+, crime A, health & safety A; Watch: schools D+, amenities D-.
- Indian River (other): math 48% / reading 52% proficiency, ranked #35 of 73 in FL (top 48%) — acceptable for families but not a draw, mixed tenant base, ~2y average lease.
- Market conditions: Rents rising fast (+6.2%/yr); 412 active listings in the ZIP; 4 comparable units currently listed for rent nearby; rentals at typical pace (median 21d on market — plan ~3-4 weeks tenant-placement turnaround); 564 units permitted in Indian River County in 2024 (281 in 5+ unit buildings).
- This rent runs 42% of the median local income ($67k/yr) — at the standard rent-burdened threshold; future hikes will face affordability resistance.
Forward outlook
- Local home prices are declining (-3.0%/yr); year-one equity from $1k of loan paydown is wiped out by about $6k of value loss. Plan a longer hold.
- Indian River County population projected at +18% by 2050 — long-run rental-demand tailwind backs the buy-and-hold thesis.
Negotiation context
- It's been on market 52 days — a 3% lower offer ($193k) is reasonable based on typical stale-listing flexibility.
- 3 sale attempts since 17y ago with the ask held roughly flat each time — persistent listings suggest the price (not the market) is what's stuck; bring a comps-based counter.
- Current owner paid $40k; list at $199k implies a 398% gain — meaningful room to come down on a strong offer.
Risks & watch-outs
- Watch-outs: flood insurance adds $427/mo.
- Climate carrying-cost: in FEMA flood zone AE (mandatory federal flood insurance); severe wind risk, 99% chance of damaging wind over 30y; extreme-heat days projected 7→24/yr by 2055 (HVAC capex compounding) — expect insurance premiums to compound above CPI over the hold.
Questions for the listing agent
- It's been on market 52 days. Have you received any prior offers? Is the seller open to a 3% concession, seller financing, or rate buy-down credit?
- What's the actual annual flood-insurance premium (NFIP or private), and is the property in a SFHA with mandatory coverage?
- Is there a deadline driving the sale (1031 exchange, divorce, estate, relocation)? That informs how much negotiation room exists.
- Schools are D-rated, which usually means shorter tenancies and higher turnover. Who's the typical renter profile here, and what's been the actual vacancy rate?
- What's the average days-on-market for RENTAL listings here right now (not sales)? A rising rental-DOM trend means longer vacancies and softer asking-rent achievability than the comps imply.
- What's the recent tenant-quality profile in this submarket — average credit score on applications, eviction rate, late-payment / NSF rate, and stable-employment percentage? A property-management company in the area should have these aggregated.
- How much new for-sale + rental construction is in the pipeline within 1–3 miles? Heavy new supply typically softens prices + rents 12–24 months out; constrained supply supports both.
Investment metrics
- 1% rule
- 1.17% ✓
- Cap rate
- 8.97%
- Cash-on-cash
- 9.57%
- DSCR
- 1.43
- GRM
- 7.1
CMA / ARV
- ARV (on-the-fly)
- $247,696
- Comps found
- 10
Show comp detail 10 sales within ~0.75 mi
| Address | Dist | Beds/Ba | Sqft | Sold | Price | $/sf | Match |
|---|---|---|---|---|---|---|---|
| 120 Mabry St | 0.06mi | 3/2.0 | 948 (+5%) | 22mo | $285,000 | $301 | 71 |
| 111 Alameda Ave | 0.50mi | 2/1.5 (-1) | 912 (+1%) | 2mo | $305,000 | $334 | 66 |
| 918 Schumann Dr | 0.54mi | 2/2.0 (-1) | 925 (+2%) | 3mo | $276,000 | $298 | 64 |
| 868 Lance St | 0.66mi | 2/2.0 (-1) | 927 (+2%) | 4mo | $165,000 | $178 | 56 |
| 135 Caprona St | 0.63mi | 3/2.0 | 876 (-3%) | 16mo | $278,000 | $317 | 52 |
| 9715 61st Pkwy | 0.60mi | 2/2.0 (-1) | 884 (-2%) | 15mo | $220,000 | $249 | 50 |
| 162 Kildare Dr | 0.74mi | 2/1.0 (-1) | 864 (-4%) | 10mo | $237,000 | $274 | 40 |
| 9785 61st Way | 0.64mi | 2/2.0 (-1) | 864 (-4%) | 23mo | $168,900 | $195 | 39 |
| 106 Conover Ave | 0.58mi | 3/2.0 | 1,016 (+12%) | 22mo | $265,000 | $261 | 33 |
| 115 Ogden Ave | 0.66mi | 3/2.0 | 1,016 (+12%) | 19mo | $252,000 | $248 | 33 |
Match score weights: distance 35% · size 25% · config 20% · recency 20%. Top-matched comps best support the ARV.
Projected returns pro-forma
-3.0% appreciation · 6.22% rent growth · sell at horizon
- IRR
- -10.9%
- Equity multiple
- 0.59×
- Total profit
- $-23,027
- Equity at exit
- $29,672
- IRR
- 3.5%
- Equity multiple
- 1.30×
- Total profit
- $16,759
- Equity at exit
- $17,206
Cash invested: $55,720 (down + closing). Projections, not guarantees.
Landlord ↔ Tenant lean methodology
- Overall (STATE)
- 87 Strongly Landlord-Friendly
- State Florida
- 87 Strongly Landlord-Friendly · R+3
- County
- — inherits STATE
- City
- — inherits STATE
ZIP-level market 32958
- Home prices YoY
- -13.1%
- Rents YoY
- 6.2%
- Active inventory
- 412
- Price-to-rent
- 7.1×
Monthly cashflow live
- Estimated rent
- $2,326 medium interval (Pro) →
- Mortgage (P&I)
- −$1,044
- Tax from tax record
- −$266 /mo · $3,196/yr
- Insurance
- −$83
- Flood insurance flood zone
- −$427 /mo · $5,118/yr
- HOA
- −$0
- Vacancy / Maint / Mgmt
- −$488
- Net cashflow
- $18
Break-even live
UW: 25.0% down · 7.5% · 30yr · 1.5% tax · 5.0% vac · 8.0% maint · 8.0% mgmt
Financing live
Cash to close
- Down payment
- $49,750
- Closing costs
- $5,970
- Reserves months
- —
- Total cash needed
- —
Loan-product check · same deal, 3 products live
Conventional
25% down · 7.5% · 30yr
- Down + closing
- —
- Monthly P&I
- —
- Monthly cashflow
- —
- DSCR
- —
- Eligible?
- —
Personal DTI + credit; lowest rate.
DSCR
20% down · 8.5% · 30yr
- Down + closing
- —
- Monthly P&I
- —
- Monthly cashflow
- —
- DSCR
- —
- Eligible?
- —
No personal income docs; deal must DSCR.
Hard money
10% down · 12.0% · 12mo
- Down + closing
- —
- Monthly P&I
- —
- Monthly cashflow
- —
- DSCR
- —
- Eligible?
- —
Short-term bridge; refi at stabilization.
Rent comps 4 comps
| Address | Beds | Baths | Sqft | Rent | $/sqft | DOM | Units | Dist |
|---|---|---|---|---|---|---|---|---|
| 141 Crawford Dr Sebastian, FL | 2.0 | 1.0 | 1100 | $2,200 | $2.00 | 13d | 1 | 0.15mi |
| 5790 Marina Dr #2 Sebastian, FL | 2.0 | 2.0 | 1060 | $2,200 | $2.08 | 13d | 1 | 1.22mi |
| 117 Acorn Ter Sebastian, FL | 3.0 | 1.0 | 896 | $1,800 | $2.01 | 21d | 1 | 1.24mi |
| 5790 Marina Dr #2 Sebastian, FL | 2.0 | 2.0 | 1060 | $2,200 | $2.08 | 21d | 1 | 1.30mi |
Listing history 28 events
-
2026-06-19days on market $199,000 Active 52 DOM
-
2026-06-18days on market $199,000 Active 51 DOM
-
2026-06-17days on market $199,000 Active 50 DOM
-
2026-06-16days on market $199,000 Active 49 DOM
-
2026-06-15days on market $199,000 Active 48 DOM
-
2026-06-14days on market $199,000 Active 46 DOM
-
2026-06-13days on market $199,000 Active 45 DOM
-
2026-06-10days on market $199,000 Active 43 DOM
-
2026-06-09days on market $199,000 Active 42 DOM
-
2026-06-08days on market $199,000 Active 41 DOM
-
2026-06-07days on market $199,000 Active 40 DOM
-
2026-06-05days on market $199,000 Active 37 DOM
-
2026-06-02days on market $199,000 Active 35 DOM
-
2026-06-01days on market $199,000 Active 34 DOM
-
2026-06-01remarks 636-char remark
-
2026-06-01status $199,000 Active 33 DOM
-
2026-05-31days on market $199,000 Active Under Contract 33 DOM
-
2026-05-30days on market $199,000 Active Under Contract 32 DOM
-
2026-05-23historical Active Under Contract
-
2026-05-16status Active
-
2026-05-05historical Active Under Contract
-
2026-04-29$199,000 Active
-
2009-09-09soldstatus $40,000 195-char remark
Show marketing remark (195 chars)
Fixer upper just waiting for you! You will love the back yard! Cute home with potential. Home has 2 bedrooms and 1 full bath. Bring your paint brush and your tool belt and make this one your own!
-
2009-06-07$49,999 195-char remark
Show marketing remark (195 chars)
Fixer upper just waiting for you! You will love the back yard! Cute home with potential. Home has 2 bedrooms and 1 full bath. Bring your paint brush and your tool belt and make this one your own!
-
2006-01-06soldstatus $157,000
-
2005-10-11soldstatus $115,000
-
2001-09-13soldstatus $57,700
-
1994-06-15soldstatus $40,000
ⓘ Source: listings_history table (triggers on properties + properties_extension) + one-shot
backfill from property_details.listing_events for pre-trigger history.
Tax reassessment forecast FL · Resets to sale price
- Current annual tax
- $3,196 · $266/mo
- Projected year-2 tax
- $3,196 · $266/mo
- Expected delta
- $0/yr ($0/mo · 0.0%)
ⓘ Screening estimate from a state-policy table — verify with the county assessor before closing.
Climate risk First Street
- Flood 1/10 Low FEMA zone AE · 0% chance over 30 yrs
- Wildfire 2/10 Low
- Heat 10/10 Extreme 7 d/yr ≥105°F today · 24 d/yr by 30 yrs out
- Wind 10/10 Extreme 99% chance of damaging wind over 30 yrs
- Air quality 1/10 Low 0 unhealthy d/yr today · 0 by 30 yrs out
Nearby sold comps map
Loading sold comps map…
Walkable amenities ~0.75 mi
Loading nearby amenities…
Taxation est. · year 1
- Rental income
- $27,907
- − Mortgage interest
- −$11,147
- − Property taxes
- −$3,196
- − Insurance
- −$6,114
- − Repairs & maintenance
- −$2,233
- − Management
- −$2,233
- − Depreciation
- −$5,789
- Taxable loss
- −$2,804
- Est. tax savings @ 24.0%
- +$673
- After-tax cash flow
- $887/yr
For passive investors: Depreciation is non-cash, so a rental often shows a tax loss while cash-flowing — sheltering income. Rental losses are passive: they offset passive income freely, and up to $25,000/yr can offset ordinary (W-2) income if you actively participate and your MAGI is under $100k (phasing out to $0 by $150k); unused losses carry forward. On sale, claimed depreciation is recaptured at up to 25%, and gains may owe capital-gains tax (a 1031 exchange can defer both). Figures are a year-1 estimate at your 24.0% rate — not tax advice; consult a CPA.
Schools (NCES district)
- District
- Indian River
- NCES district ID
- 1200930
- Math proficiency
- 48% ▼ -9.00%
- Reading proficiency
- 52% ▼ -3.00%
- Median HH income
- $46,597
- Composite
- 42.45/100
- National rank
- #3218
- State rank
- #35 of 73 in FL
Livability — Sebastian
- Score
- 81/100
- State rank
- #89
- US rank
- #1421
Category grades
Schools grade is shown separately in the Schools card above.
Census & demographics
- Census place
- Sebastian, FL
- County
- Indian River County · 143,738 people
- City population
- 30,023
- Metro
- Sebastian-Vero Beach, FL
- Population (ZIP)
- 30,023
- Household income
- $66,840
- Rent vs Own
- Severe rent burden
- 646.0
Population outlook (Indian River County) Hauer SSP2
- Today (2025)
- 165,104 people
- By 2030
- 172,869 · +4.7%
- By 2040
- 185,640 · +12.4%
- By 2050
- 194,465 · +17.8%
- By 2075
- 211,115 · +27.9%
- By 2100
- 211,781 · +28.3%
Race, ethnicity, and origin ACS 2023
- Neighborhood character
- Predominantly White (86%)
- Race & ethnicity
- White 86% Hispanic / Latino 9% Two or more races 7% Black 2% Asian 1%
- Hispanic origin (detail)
- Mexican 1% Puerto Rican 2% Cuban 3%
- Common ancestry
- Lithuanian 4% Slovak 4% Romanian 3%
- Foreign-born
- 7% · Canada, Jamaica
- Languages at home
- 91% English-only · Spanish 6% Other Indo-European 1% Russian/Polish/Slavic 1%
Political lean MEDSL · Indian River
- 2024 margin
- Strong R (+27.4) · D 36.0% · R 63.4%
- 2008→2024 swing
- -12.5pp toward R · 2008: -14.8pp · 2024: -27.4pp
- All cycles
- 2024: R+27.4 2020: R+21.6 2016: R+24.5 2012: R+22.3 2008: R+14.8
Not yet ingested
- Civics
- —
Market trends
- HPI YoY
- ▼ -49.85%
- Current HPI
- 330.1691
- Rent YoY
- ▲ 6.22%
- Metro
- Sebastian-Vero Beach, FL
- State GDP YoY
- ▲ 3.28%
- F500 in state
- 36
Industry mix (Fortune 500 HQ in FL)
| Industry | F500 HQs | Revenue |
|---|---|---|
| Industrial Technology | 2 | $29B |
|
||
| Insurance | 2 | $17B |
|
||
| Retail | 1 | $60B |
|
||
| Technology Distribution | 1 | $58B |
|
||
| Homebuilding | 1 | $35B |
|
||
| Technology Manufacturing | 1 | $35B |
|
||
Price history
+397.5% since first listed10 events — show timeline
- 2026-05-23 Contingent — SCMLS
- 2026-05-16 Relisted — SCMLS
- 2026-05-05 Contingent — SCMLS
- 2026-04-29 Listed $199,000 SCMLS
- 2009-09-09 Sold (MLS) $40,000 SCMLS
- 2009-06-07 Listed $49,999 SCMLS
- 2006-01-06 Sold (Public Records) $157,000 Public Records
- 2005-10-11 Sold (Public Records) $115,000 Public Records
- 2001-09-13 Sold (Public Records) $57,700 Public Records
- 1994-06-15 Sold (Public Records) $40,000 Public Records
Property tax history
+9.7%/yrLatest (2025): $3,196 · +6.2% YoY. Source: county tax records.
Cash-flow waterfall
monthlySold comps — $/sqft
last 12 mo · ≤1 miLoading sold comps…