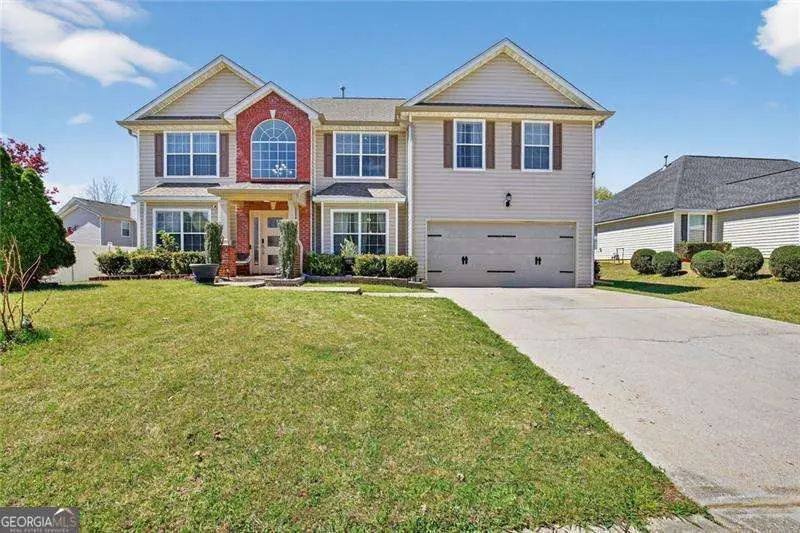
115 Arbor Lake Dr · Porterdale, GA
Flood risk 4/10 · Minor
- FEMA flood zone
- X (unshaded)
- Chance of flooding over 30 yrs
- 0.22%
- Est. flood insurance / yr
- $507 – $1,088
Fire risk 3/10 · Minor
- Est. fire insurance / yr
- $963 – $1,789
Heat risk 7/10 · Major
- Hot days now (above 106°F)
- 7 days/yr
- Hot days in 30 yrs
- 19 days/yr
Wind risk 6/10 · Moderate
- Chance of severe wind over 30 yrs
- 27.0%
Air-quality risk 4/10 · Minor
- Unhealthy air days now
- 5 days/yr
- Unhealthy air days in 30 yrs
- 6 days/yr
Risk factors via First Street. Map © Google.
Why this score? — see what drove the C grade
The composite is a weighted blend of 9 inputs, each scored 0–100. Each bar is that input's sub-score; the figure is the points it added to the 100-point composite (weight × sub-score).
- Cash flow +20.9/30.0
- ARV discount +15.0/15.0
- DSCR +6.7/10.0
- 1% rule +5.3/10.0
- Rent growth +3.0/5.0
- Livability +2.9/5.0
- Condition / age +2.5/5.0
- Schools +1.9/10.0
- Appreciation +0.0/10.0
$290,000
🖨 Deal sheet 📄 Offer letter ✓ Due diligence
Listing remarks MLS
Great opportunity in Covington! 115 Arbor offers solid potential for investors or buyers looking to customize a home to their taste. The property features a functional layout with good bones and sits in a convenient location close to shopping, dining, and major roadways. With some repairs and updates, this home could truly shine and become a great primary residence or investment property. Being sold as-is-bring your vision and make it your own!
Key facts
- Close to dining
- Functional layout
- Convenient location
Tags
Property features AI
Finance
- Other: Road surface is concrete on a city street; Directions: GPS
- HOA & community: Annual association fee of $350; Association covers grounds maintenance and swim amenities; Has association
Exterior
- Parking: Attached covered garage (2 spaces); Total of 2 parking spaces
- Utilities: Public water; Public sewer; 110-volt electric; Cable available; Electricity available; Sewer available; Underground utilities; Water available
- Home design: Two levels
- Construction: Shingle siding and other exterior materials; Shingle roof; Concrete perimeter foundation; Property listed in fixer condition
- Exterior features: Backyard fenced; Deck
Interior
- Kitchen: Breakfast bar; White cabinets; Eat-in kitchen; Kitchen island; Pantry
- Bedrooms: One main-level bedroom; Five upper-level bedrooms; Double master bedroom
- Flooring: Laminate flooring; Vinyl flooring; Other flooring
- Bathrooms: Four full bathrooms; One main-level bathroom; Three upper-level full bathrooms; Master bath with separate tub and shower
- Heating & cooling: Central heating; Central air conditioning
- Interior features: One fireplace in the family room; Other interior features
- Laundry & utility: Laundry on the upper level
Neighborhood map
What this means for you Summary
Snapshot
- This is a 6-bed/4.0-bath single-family listed at $290k.
Deal economics
- At list price, monthly cash flow is $403 ($5k/yr) — positive.
- The deal already cash-flows at list — no discount required.
- Meets the 1% rule at list price ($3k rent vs $290k).
- Recommended offer: $286k (1.5% below list) — sets the bar for market timing.
- Cap rate 8.0% vs local median 5.1% in Porterdale — top-decile yield for the area; either an underpriced asset or a hidden risk that comps aren't pricing in. Stress-test before assuming the spread holds.
Location & tenants
- Location reads 58/100 on livability (#447 in GA) — a working-class tenant base; expect higher turnover. Strengths: cost of living A+, crime B+, housing B; Watch: schools F, amenities F, commute F.
- Newton County (suburban): math 17% / reading 26% proficiency, ranked #137 of 174 in GA (top 79%) — low school quality limits family demand, transient renter base, plan for 1-2y turnover.
- Market conditions: Rents rising (+1.8%/yr); 419 active listings in the ZIP; 2 comparable units currently listed for rent nearby; solid renter incomes; 1,480 units permitted in Newton County in 2024 (702 in 5+ unit buildings).
- At $2,993/mo this rent would consume 45% of the median local household income ($80k/yr) (locally 1172% of renters already pay >50% of income on rent) — very limited rent-growth headroom before tenants either downsize or default.
Forward outlook
- Local home prices are declining (-3.0%/yr); year-one equity from $2k of loan paydown is wiped out by about $9k of value loss. Plan a longer hold.
- Newton County population projected at +23% by 2050 — long-run rental-demand tailwind backs the buy-and-hold thesis.
Negotiation context
- It's been on market 25 days — a 2% lower offer ($286k) is reasonable based on typical stale-listing flexibility.
- 3 sale attempts with the ask held roughly flat each time — persistent listings suggest the price (not the market) is what's stuck; bring a comps-based counter.
Risks & watch-outs
- Climate carrying-cost: major wind risk, 27% chance of damaging wind over 30y; extreme-heat days projected 7→19/yr by 2055 (HVAC capex compounding) — expect insurance premiums to compound above CPI over the hold.
Questions for the listing agent
- What does the HOA fee cover, when was the last increase, and are there any pending special assessments or reserve-fund shortfalls?
- Is there a deadline driving the sale (1031 exchange, divorce, estate, relocation)? That informs how much negotiation room exists.
- Schools are F-rated, which usually means shorter tenancies and higher turnover. Who's the typical renter profile here, and what's been the actual vacancy rate?
- What's the average days-on-market for RENTAL listings here right now (not sales)? A rising rental-DOM trend means longer vacancies and softer asking-rent achievability than the comps imply.
- What's the recent tenant-quality profile in this submarket — average credit score on applications, eviction rate, late-payment / NSF rate, and stable-employment percentage? A property-management company in the area should have these aggregated.
- How much new for-sale + rental construction is in the pipeline within 1–3 miles? Heavy new supply typically softens prices + rents 12–24 months out; constrained supply supports both.
Investment metrics
- 1% rule
- 1.03% ✓
- Cap rate
- 7.96%
- Cash-on-cash
- 5.96%
- DSCR
- 1.27
- GRM
- 8.1
CMA / ARV
- ARV (median comp)
- $372,289
- List price
- $290,000
- Delta
- -22.10%
- Verdict
- UNDERPRICED
- Comps
- 20 within 1.0 mi
Show comp detail 5 sales within ~0.75 mi
| Address | Dist | Beds/Ba | Sqft | Sold | Price | $/sf | Match |
|---|---|---|---|---|---|---|---|
| 120 Oak Manor Dr | 0.12mi | 6/4.0 | 3,432 (0%) | 8mo | $347,500 | $101 | 88 |
| 160 Oak Manor Dr | 0.10mi | 5/4.0 (-1) | 3,432 (0%) | 11mo | $379,000 | $110 | 82 |
| 100 Oak Manor Dr | 0.15mi | 5/4.0 (-1) | 3,432 (0%) | 19mo | $365,000 | $106 | 72 |
| 35 Arbor Lake Dr | 0.13mi | 5/3.0 (-1) | 3,152 (-8%) | 21mo | $375,000 | $119 | 54 |
| 365 Silver Willow Walk | 0.21mi | 5/3.0 (-1) | 3,101 (-10%) | 18mo | $355,000 | $114 | 50 |
Match score weights: distance 35% · size 25% · config 20% · recency 20%. Top-matched comps best support the ARV.
Projected returns pro-forma
-3.0% appreciation · 1.84% rent growth · sell at horizon
- IRR
- -8.4%
- Equity multiple
- 0.70×
- Total profit
- $-24,755
- Equity at exit
- $43,240
- IRR
- -0.4%
- Equity multiple
- 0.97×
- Total profit
- $-2,267
- Equity at exit
- $25,074
Cash invested: $81,200 (down + closing). Projections, not guarantees.
Landlord ↔ Tenant lean methodology
- Overall (STATE)
- 90 Strongly Landlord-Friendly
- State Georgia
- 90 Strongly Landlord-Friendly · R+3
- County
- — inherits STATE
- City
- — inherits STATE
ZIP-level market 30016
- Home prices YoY
- -8.6%
- Rents YoY
- 1.8%
- Active inventory
- 419
- Price-to-rent
- 8.1×
Monthly cashflow live
- Estimated rent
- $2,993 medium interval (Pro) →
- Mortgage (P&I)
- −$1,521
- Tax from tax record
- −$291 /mo · $3,492/yr
- Insurance
- −$121
- HOA
- −$29
- Vacancy / Maint / Mgmt
- −$629
- Net cashflow
- $403
Break-even live
UW: 25.0% down · 7.5% · 30yr · 1.5% tax · 5.0% vac · 8.0% maint · 8.0% mgmt
Financing live
Cash to close
- Down payment
- $72,500
- Closing costs
- $8,700
- Reserves months
- —
- Total cash needed
- —
Loan-product check · same deal, 3 products live
Conventional
25% down · 7.5% · 30yr
- Down + closing
- —
- Monthly P&I
- —
- Monthly cashflow
- —
- DSCR
- —
- Eligible?
- —
Personal DTI + credit; lowest rate.
DSCR
20% down · 8.5% · 30yr
- Down + closing
- —
- Monthly P&I
- —
- Monthly cashflow
- —
- DSCR
- —
- Eligible?
- —
No personal income docs; deal must DSCR.
Hard money
10% down · 12.0% · 12mo
- Down + closing
- —
- Monthly P&I
- —
- Monthly cashflow
- —
- DSCR
- —
- Eligible?
- —
Short-term bridge; refi at stabilization.
Rent comps 2 comps
| Address | Beds | Baths | Sqft | Rent | $/sqft | DOM | Units | Dist |
|---|---|---|---|---|---|---|---|---|
| 30 Hillside Oak Ln Covington, GA | 5.0 | 3.0 | 3129 | $2,975 | $0.95 | 18d | 1 | 0.21mi |
| 40 Oakwood Dr Covington, GA | 5.0 | 3.0 | 2480 | $2,381 | $0.96 | 5d | 1 | 0.27mi |
HOA detail
- Monthly dues
- $29 · $348/yr
Listing history 11 events
-
2026-06-13days on market $290,000 Active 25 DOM
-
2026-06-09days on market $290,000 Active 22 DOM
-
2026-06-08days on market $290,000 Active 21 DOM
-
2026-06-07days on market $290,000 Active 20 DOM
-
2026-06-04days on market $290,000 Active 17 DOM
-
2026-06-03days on market $290,000 Active 16 DOM
-
2026-06-02days on market $290,000 Active 15 DOM
-
2026-06-01status $290,000 Active 14 DOM
-
2026-05-01$290,000 New 448-char remark
Show marketing remark (448 chars)
Great opportunity in Covington! 115 Arbor offers solid potential for investors or buyers looking to customize a home to their taste. The property features a functional layout with good bones and sits in a convenient location close to shopping, dining, and major roadways. With some repairs and updates, this home could truly shine and become a great primary residence or investment property. Being sold as-is-bring your vision and make it your own!
-
2026-05-01$290,000 Active
Show marketing remark (448 chars)
Great opportunity in Covington! 115 Arbor offers solid potential for investors or buyers looking to customize a home to their taste. The property features a functional layout with good bones and sits in a convenient location close to shopping, dining, and major roadways. With some repairs and updates, this home could truly shine and become a great primary residence or investment property. Being sold as-is-bring your vision and make it your own!
-
2007-01-31soldstatus $1,642,500
ⓘ Source: listings_history table (triggers on properties + properties_extension) + one-shot
backfill from property_details.listing_events for pre-trigger history.
Tax reassessment forecast GA · Resets to sale price
- Current annual tax
- $3,492 · $291/mo
- Projected year-2 tax
- $3,492 · $291/mo
- Expected delta
- $0/yr ($0/mo · 0.0%)
ⓘ Screening estimate from a state-policy table — verify with the county assessor before closing.
Climate risk First Street
- Flood 4/10 Moderate FEMA zone X (unshaded) · 22% chance over 30 yrs
- Wildfire 3/10 Moderate
- Heat 7/10 Severe 7 d/yr ≥106°F today · 19 d/yr by 30 yrs out
- Wind 6/10 Major 27% chance of damaging wind over 30 yrs
- Air quality 4/10 Moderate 5 unhealthy d/yr today · 6 by 30 yrs out
Nearby sold comps map
Loading sold comps map…
Walkable amenities ~0.75 mi
Loading nearby amenities…
Taxation est. · year 1
- Rental income
- $35,919
- − Mortgage interest
- −$16,245
- − Property taxes
- −$3,492
- − Insurance
- −$1,450
- − Repairs & maintenance
- −$2,874
- − Management
- −$2,874
- − HOA
- −$348
- − Depreciation
- −$8,436
- Taxable income
- $201
- Est. tax owed @ 24.0%
- −$48
- After-tax cash flow
- $4,789/yr
For passive investors: Depreciation is non-cash, so a rental often shows a tax loss while cash-flowing — sheltering income. Rental losses are passive: they offset passive income freely, and up to $25,000/yr can offset ordinary (W-2) income if you actively participate and your MAGI is under $100k (phasing out to $0 by $150k); unused losses carry forward. On sale, claimed depreciation is recaptured at up to 25%, and gains may owe capital-gains tax (a 1031 exchange can defer both). Figures are a year-1 estimate at your 24.0% rate — not tax advice; consult a CPA.
Schools (NCES district)
- District
- Newton County
- NCES district ID
- 1303930
- Math proficiency
- 17% ▼ -13.00%
- Reading proficiency
- 26% ▼ -8.00%
- Median HH income
- $50,768
- Composite
- 19.2/100
- National rank
- #8816
- State rank
- #137 of 174 in GA
Livability — Porterdale
- Score
- 58/100
- State rank
- #447
- US rank
- #21362
Category grades
Schools grade is shown separately in the Schools card above.
Census & demographics
- County
- Newton County · 104,393 people
- City population
- 76
- Metro
- Atlanta-Sandy Springs-Alpharetta, GA
- Population (ZIP)
- 62,968
- Household income
- $79,527
- Rent vs Own
- Severe rent burden
- 1172.0
Population outlook (Newton County) Hauer SSP2
- Today (2025)
- 118,372 people
- By 2030
- 124,234 · +5.0%
- By 2040
- 135,550 · +14.5%
- By 2050
- 145,309 · +22.8%
- By 2075
- 166,843 · +40.9%
- By 2100
- 175,800 · +48.5%
Race, ethnicity, and origin ACS 2023
- Neighborhood character
- Diverse neighborhood (Simpson 0.57)
- Race & ethnicity
- Black 59% White 29% Two or more races 8% Hispanic / Latino 6% Asian 1%
- Hispanic origin (detail)
- Mexican 4%
- Common ancestry
- Lithuanian 1% Slovak 1%
- Foreign-born
- 6% · Canada, China
- Languages at home
- 94% English-only · Spanish 4% Other Asian/Pacific 1% French/Haitian/Cajun 1%
Political lean MEDSL · Newton
- 2024 margin
- D (+15.1) · D 57.3% · R 42.2%
- 2008→2024 swing
- +14.0pp toward D · 2008: 1.2pp · 2024: 15.1pp
- All cycles
- 2024: D+15.1 2020: D+10.9 2016: D+2.4 2012: D+2.0 2008: D+1.2
Not yet ingested
- Civics
- —
Market trends
- HPI YoY
- ▼ -29.68%
- Current HPI
- 317.5605
- Rent YoY
- ▲ 1.84%
- Metro
- Atlanta-Sandy Springs-Alpharetta, GA
- State GDP YoY
- ▲ 2.66%
- F500 in state
- 28
Industry mix (Fortune 500 HQ in GA)
| Industry | F500 HQs | Revenue |
|---|---|---|
| Paper / Packaging | 2 | $29B |
|
||
| Retail | 1 | $160B |
|
||
| Transportation / Logistics | 1 | $91B |
|
||
| Airlines | 1 | $62B |
|
||
| Consumer Goods | 1 | $47B |
|
||
| Utilities | 1 | $25B |
|
||
Price history
-82.3% since first listed5 events — show timeline
- 2026-06-01 Relisted — FMLS
- 2026-05-21 Delisted — GAMLS
- 2026-05-01 Listed $290,000 GAMLS
- 2026-05-01 Listed $290,000 FMLS
- 2007-01-31 Sold (Public Records) $1,642,500 Public Records
Property tax history
+2.7%/yrLatest (2025): $3,492 · +1.1% YoY. Source: county tax records.
Cash-flow waterfall
monthlySold comps — $/sqft
last 12 mo · ≤1 miLoading sold comps…