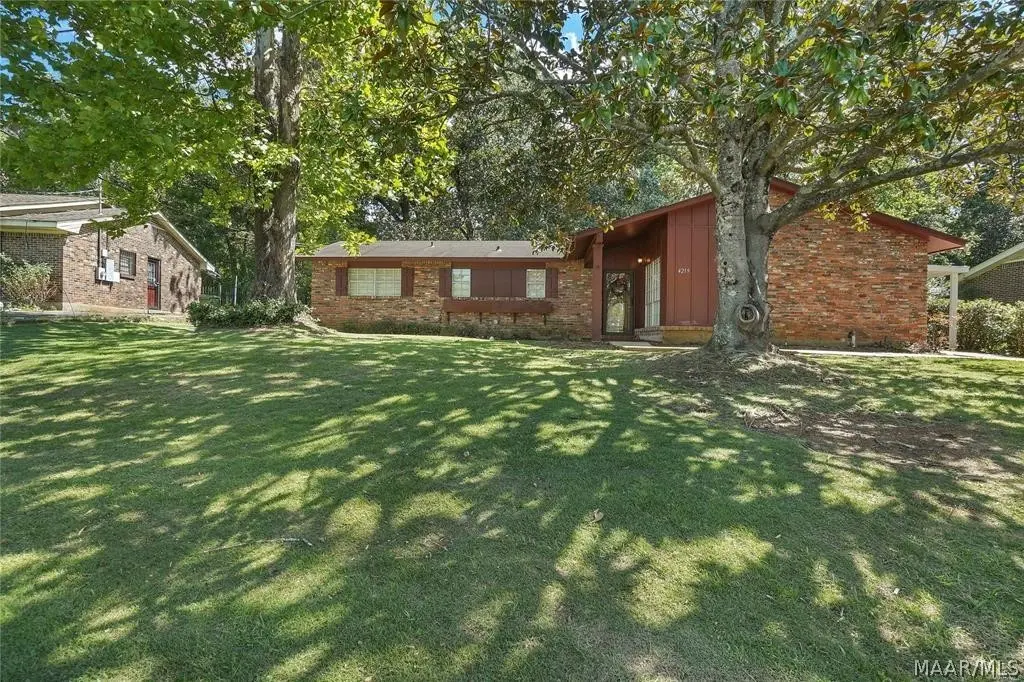
4219 Andova Dr · Montgomery, AL
Flood risk 1/10 · Minimal
- FEMA flood zone
- X (unshaded)
- Chance of flooding over 30 yrs
- 0.0%
- Est. flood insurance / yr
- $507 – $1,088
Fire risk 4/10 · Minor
- Est. fire insurance / yr
- $916 – $1,700
Heat risk 7/10 · Major
- Hot days now (above 108°F)
- 7 days/yr
- Hot days in 30 yrs
- 20 days/yr
Wind risk 8/10 · Major
- Chance of severe wind over 30 yrs
- 80.0%
Air-quality risk 2/10 · Minimal
- Unhealthy air days now
- 1 days/yr
- Unhealthy air days in 30 yrs
- 3 days/yr
Risk factors via First Street. Map © Google.
Why this score? — see what drove the C- grade
The composite is a weighted blend of 9 inputs, each scored 0–100. Each bar is that input's sub-score; the figure is the points it added to the 100-point composite (weight × sub-score).
- Cash flow +22.3/30.0
- ARV discount +7.6/15.0
- DSCR +7.1/10.0
- 1% rule +4.7/10.0
- Rent growth +3.9/5.0
- Livability +3.2/5.0
- Condition / age +2.5/5.0
- Schools +1.7/10.0
- Appreciation +0.0/10.0
$140,000
🖨 Deal sheet (PDF) 📄 Offer letter ✓ Due diligence
Listing remarks MLS
Spacious Living with Character – One of the Largest Homes on the Street! Here’s what you’ll love about 4219 Andova Drive. Offering 1,886 square feet of heated and cooled living space, this home is one of the largest on the street and is located in a well-established neighborhood. Inside, you’ll find a spacious formal living room that exudes elegance and comfort, creating the perfect setting for welcoming guests or enjoying quiet moments. The home also features an expansive family room (den) that was added, with beautiful exposed brick that creates a warm, inviting atmosphere—perfect for relaxing or entertaining. The kitchen offers ample counter and cabinet space, providing plenty of room for cooking and storage. A charming serving window that opens to the family room adds extra character while keeping the kitchen connected to the heart of the home. Enjoy cozy meals in the formal dining room, complete with a fireplace, adding warmth and a touch of sophistication to the space. The home also features three bedrooms and two full bathrooms, along with a covered carport and generous living spaces throughout. Step outside to a large backyard perfect for entertaining, complete with a privacy fence, offering plenty of space for gatherings, weekend cookouts, or simply relaxing and enjoying the outdoors. Imagine hosting family and friends, enjoying cozy evenings by the fireplace, and creating lasting memories in a home designed for both comfort and connection. If you’re looking for space, character, and a thoughtfully expanded layout in an established neighborhood, 4219 Andova Drive is a home you won’t want to miss. Call your favorite Realtor and schedule your showing today. Priced to sell, this home will not be on the market long. Ask about available financing options and schedule your private showing today.
Key facts
- Formal dining room
- Exposed brick
- Fireplace
Tags
Neighborhood map
What this means for you Summary
Snapshot
- This is a 3-bed/2.0-bath single-family listed at $140k.
Deal economics
- At list price, monthly cash flow is $230 ($3k/yr) — positive.
- The deal already cash-flows at list — no discount required.
- To meet the 1% rule (rent ≥ 1% of price), the offer needs to be $136k (3.0% below list).
- Recommended offer: $127k (9.0% below list) — sets the bar for market timing.
- Cap rate 8.3% vs local median 6.0% in Montgomery — top-decile yield for the area; either an underpriced asset or a hidden risk that comps aren't pricing in. Stress-test before assuming the spread holds.
Location & tenants
- Location reads 65/100 on livability (#138 in AL) — a middle-class / working-renter tenant base. Strengths: cost of living A+, housing A+; Watch: employment D, crime F, amenities D-.
- Montgomery County (urban): math 9% / reading 31% proficiency, ranked #106 of 129 in AL (top 82%) — low school quality limits family demand, transient renter base, plan for 1-2y turnover; 70% free/reduced lunch — lower-income household profile, screen leases tightly.
- Zoned schools: Johnson Elementary School (math 2% / reading 17%, grade F, #568 of 627 statewide, top 94%, 352 students, 87% FRL); Mckee Middle School (math 0% / reading 13%, grade F, #249 of 257 statewide, top 98%, 676 students, 94% FRL); Lanier Senior High School (math 2% / reading 12%, grade F, #265 of 305 statewide, top 89%, 798 students, 94% FRL) — zoned schools average 91% FRL vs 70% district-wide (21 pts higher); higher-poverty schools than district average — tighter screening recommended.
- Zoned-school proficiency averages 8% at this address vs 20% district-wide (-12 pts) — the specific schools serving this property underperform the Montgomery County average; the district grade overstates school quality for this exact location.
- Market conditions: Rents rising fast (+5.7%/yr); 293 active listings in the ZIP; 14 comparable units currently listed for rent nearby; rentals lingering (median 46d on market — plan ~5-8 weeks vacancy on turnover, expect pricing pressure); 64% of comp listings sitting > 30 days — soft ceiling on asking rent; 460 units permitted in Montgomery County in 2024 (37 in 5+ unit buildings).
Forward outlook
- Local home prices are declining (-3.0%/yr); year-one equity from $968 of loan paydown is wiped out by about $4k of value loss. Plan a longer hold.
- Montgomery County population projected to shrink 8% by 2050 — rents likely to lag national; underwrite the cash flow, not the appreciation.
- At projected returns (-3.0% appreciation + 5.7% rent growth), your $39k cash investment doubles in ~10 years — after that, you're playing with house money.
Negotiation context
- It's been on market 105 days — a 9% lower offer ($127k) is reasonable based on typical stale-listing flexibility.
- 10 sale attempts since 15y ago; this cycle's ask has dropped $13k (8%) from the opening price — seller is motivated, your offer sets the floor, not the list.
- Current owner paid $26k; list at $140k implies a 438% gain — meaningful room to come down on a strong offer.
Risks & watch-outs
- Climate carrying-cost: severe wind risk, 80% chance of damaging wind over 30y; extreme-heat days projected 7→20/yr by 2055 (HVAC capex compounding) — expect insurance premiums to compound above CPI over the hold.
Questions for the listing agent
- It's been on market 105 days. Have you received any prior offers? Is the seller open to a 9% concession, seller financing, or rate buy-down credit?
- Built in 1974 — when were the roof, HVAC, electrical panel, plumbing, and water heater last replaced?
- Why hasn't it sold? Are there any deal-killer items the seller is aware of (foundation, flood, title, zoning, code violations)?
- Is there a deadline driving the sale (1031 exchange, divorce, estate, relocation)? That informs how much negotiation room exists.
- Crime grade is F in this area — have there been break-ins, vandalism, or insurance claims at this property in the last 3 years? What carrier currently insures it and at what premium?
- What's the average days-on-market for RENTAL listings here right now (not sales)? A rising rental-DOM trend means longer vacancies and softer asking-rent achievability than the comps imply.
- What's the recent tenant-quality profile in this submarket — average credit score on applications, eviction rate, late-payment / NSF rate, and stable-employment percentage? A property-management company in the area should have these aggregated.
- How much new for-sale + rental construction is in the pipeline within 1–3 miles? Heavy new supply typically softens prices + rents 12–24 months out; constrained supply supports both.
Investment metrics
- 1% rule
- 0.97% ✗
- Cap rate
- 8.27%
- Cash-on-cash
- 7.04%
- DSCR
- 1.31
- GRM
- 8.6
CMA / ARV
- ARV (median comp)
- $140,410
- List price
- $140,000
- Delta
- -0.29%
- Verdict
- FAIR
- Comps
- 20 within 1.0 mi
Show comp detail 4 sales within ~0.75 mi
| Address | Dist | Beds/Ba | Sqft | Sold | Price | $/sf | Match |
|---|---|---|---|---|---|---|---|
| 4202 Matterhorn St | 0.09mi | 3/2.0 | 1,360 (-9%) | 15mo | $140,000 | $103 | 68 |
| 4012 Amberly Rd | 0.60mi | 3/2.0 | 1,454 (-3%) | 5mo | $86,000 | $59 | 63 |
| 3906 Chatwood St | 0.53mi | 4/2.0 (+1) | 1,372 (-8%) | 2mo | $62,500 | $46 | 54 |
| 4028 Amberly Rd | 0.66mi | 4/2.0 (+1) | 1,615 (+8%) | 20mo | $139,000 | $86 | 35 |
Match score weights: distance 35% · size 25% · config 20% · recency 20%. Top-matched comps best support the ARV.
Projected returns pro-forma
-3.0% appreciation · 5.65% rent growth · sell at horizon
- IRR
- -2.9%
- Equity multiple
- 0.89×
- Total profit
- $-4,370
- Equity at exit
- $20,874
- IRR
- 9.3%
- Equity multiple
- 1.79×
- Total profit
- $30,945
- Equity at exit
- $12,105
Cash invested: $39,200 (down + closing). Projections, not guarantees.
Landlord ↔ Tenant lean methodology
- Overall (STATE)
- 90 Strongly Landlord-Friendly
- State Alabama
- 90 Strongly Landlord-Friendly · R+15
- County
- — inherits STATE
- City
- — inherits STATE
ZIP-level market 36116
- Home prices YoY
- -9.7%
- Rents YoY
- 5.7%
- Active inventory
- 293
- Price-to-rent
- 8.6×
Monthly cashflow live
- Estimated rent
- $1,358 high interval (Pro) →
- Mortgage (P&I)
- −$734
- Tax from tax record
- −$51 /mo · $607/yr
- Insurance
- −$58
- HOA
- −$0
- Vacancy / Maint / Mgmt
- −$285
- Net cashflow
- $230
Break-even live
Sensitivity live
| Price | -10% $309 | -5% $270 | +0% $230 | +5% $190 | +10% $151 |
|---|---|---|---|---|---|
| Rent | -10% $123 | -5% $176 | +0% $230 | +5% $284 | +10% $337 |
| Rate | -1.0pp $301 | -0.5pp $266 | base $230 | +0.5pp $194 | +1.0pp $157 |
UW: 25.0% down · 7.5% · 30yr · 1.5% tax · 5.0% vac · 8.0% maint · 8.0% mgmt
Financing live
Cash to close
- Down payment
- $35,000
- Closing costs
- $4,200
- Reserves months
- —
- Total cash needed
- —
Loan-product check · same deal, 3 products live
Conventional
25% down · 7.5% · 30yr
- Down + closing
- —
- Monthly P&I
- —
- Monthly cashflow
- —
- DSCR
- —
- Eligible?
- —
Personal DTI + credit; lowest rate.
DSCR
20% down · 8.5% · 30yr
- Down + closing
- —
- Monthly P&I
- —
- Monthly cashflow
- —
- DSCR
- —
- Eligible?
- —
No personal income docs; deal must DSCR.
Hard money
10% down · 12.0% · 12mo
- Down + closing
- —
- Monthly P&I
- —
- Monthly cashflow
- —
- DSCR
- —
- Eligible?
- —
Short-term bridge; refi at stabilization.
Rent comps 14 comps
| Address | Beds | Baths | Sqft | Rent | $/sqft | DOM | Units | Dist |
|---|---|---|---|---|---|---|---|---|
| 3855 Woodley Rd Montgomery, AL | 4.0 | 2.0 | 1450 | $1,450 | $1.00 | 45d | 1 | 0.68mi |
| 2699 Whispering Pine Dr Montgomery, AL | 4.0 | 2.0 | 1500 | $1,500 | $1.00 | 15d | 1 | 0.77mi |
| 654 Mayflower Dr Montgomery, AL | 3.0 | 2.0 | 1777 | $1,400 | $0.79 | 45d | 1 | 0.78mi |
| 3824 Glenfern Ct Montgomery, AL | 3.0 | 2.0 | 1600 | $1,450 | $0.91 | 45d | 1 | 0.88mi |
| 3633 Woodley Rd Montgomery, AL | 4.0 | 2.0 | 1734 | $1,600 | $0.92 | 22d | 1 | 0.99mi |
| 3240 Virginia Pines Ln Montgomery, AL | 3.0 | 2.0 | 1215 | $900 | $0.74 | 45d | 1 | 1.09mi |
| 3231 Virginia Pines Ln Montgomery, AL | 2.0 | 2.0 | 1068 | $800 | $0.75 | 45d | 1 | 1.10mi |
| 3324 Cross Creek Dr Montgomery, AL | 3.0 | 2.0 | 1791 | $1,395 | $0.78 | 22d | 1 | 1.11mi |
| 4025 Edge Hill Ln Montgomery, AL | 3.0 | 2.0 | 1154 | $1,350 | $1.17 | 15d | 1 | 1.28mi |
| 6061 Briarhurst Dr Montgomery, AL | 3.0 | 2.0 | 1124 | $1,075 | $0.96 | 45d | 1 | 1.38mi |
| 6105 Jennifer Ln Montgomery, AL | 3.0 | 2.0 | 1553 | $1,250 | $0.80 | 15d | 1 | 1.43mi |
| 3110 Virginia Downs Montgomery, AL | 2.0 | 2.0 | 1068 | $800 | $0.75 | 45d | 1 | 1.44mi |
| 6028 Oakleigh Rd Montgomery, AL | 3.0 | 2.0 | 1105 | $850 | $0.77 | 45d | 1 | 1.45mi |
| 3220 Virginia Downs Montgomery, AL | 3.0 | 2.0 | 1215 | $900 | $0.74 | 45d | 1 | 1.47mi |
Listing history 32 events
-
2026-06-21days on market $140,000 Active 105 DOM
-
2026-06-18days on market $140,000 Active 102 DOM
-
2026-06-17days on market $140,000 Active 101 DOM
-
2026-06-16days on market $140,000 Active 100 DOM
-
2026-06-15days on market $140,000 Active 99 DOM
-
2026-06-14days on market $140,000 Active 97 DOM
-
2026-06-13days on market $140,000 Active 96 DOM
-
2026-06-10days on market $140,000 Active 94 DOM
-
2026-06-09days on market $140,000 Active 93 DOM
-
2026-06-08days on market $140,000 Active 92 DOM
-
2026-06-07days on market $140,000 Active 91 DOM
-
2026-06-03days on market $140,000 Active 87 DOM
-
2026-06-02days on market $140,000 Active 86 DOM
-
2026-06-01days on market $140,000 Active 85 DOM
-
2026-05-31days on market $140,000 Active 84 DOM
-
2026-05-30days on market $140,000 Active 83 DOM
-
2026-03-08$152,900 Active 1872-char remark
Show marketing remark (1872 chars)
Spacious Living with Character – One of the Largest Homes on the Street! Here’s what you’ll love about 4219 Andova Drive. Offering 1,886 square feet of heated and cooled living space, this home is one of the largest on the street and is located in a well-established neighborhood. Inside, you’ll find a spacious formal living room that exudes elegance and comfort, creating the perfect setting for welcoming guests or enjoying quiet moments. The home also features an expansive family room (den) that was added, with beautiful exposed brick that creates a warm, inviting atmosphere—perfect for relaxing or entertaining. The kitchen offers ample counter and cabinet space, providing plenty of room for cooking and storage. A charming serving window that opens to the family room adds extra character while keeping the kitchen connected to the heart of the home. Enjoy cozy meals in the formal dining room, complete with a fireplace, adding warmth and a touch of sophistication to the space. The home also features three bedrooms and two full bathrooms, along with a covered carport and generous living spaces throughout. Step outside to a large backyard perfect for entertaining, complete with a privacy fence, offering plenty of space for gatherings, weekend cookouts, or simply relaxing and enjoying the outdoors. Imagine hosting family and friends, enjoying cozy evenings by the fireplace, and creating lasting memories in a home designed for both comfort and connection. If you’re looking for space, character, and a thoughtfully expanded layout in an established neighborhood, 4219 Andova Drive is a home you won’t want to miss. Call your favorite Realtor and schedule your showing today. Priced to sell, this home will not be on the market long. Ask about available financing options and schedule your private showing today.
-
2025-10-02status Active
-
2025-08-31status Active
-
2025-06-04price $155,000
-
2025-05-11status Active
-
2025-05-02historical Contingent
-
2025-04-07price $160,000
-
2025-04-02status Active
-
2025-03-03price $165,000
-
2025-01-14price $175,000
-
2024-10-01status Active
-
2024-10-01$180,000 Active
-
2013-04-09$74,900
-
2012-05-11$86,499
-
2012-01-31soldstatus $26,000
-
2011-08-17$26,000
ⓘ Source: listings_history table (triggers on properties + properties_extension) + one-shot
backfill from property_details.listing_events for pre-trigger history.
Tax reassessment forecast AL · Resets to sale price
- Current annual tax
- $607 · $51/mo
- Projected year-2 tax
- $607 · $51/mo
- Expected delta
- $0/yr ($0/mo · 0.0%)
ⓘ Screening estimate from a state-policy table — verify with the county assessor before closing.
Climate risk First Street
- Flood 1/10 Low FEMA zone X (unshaded) · 0% chance over 30 yrs
- Wildfire 4/10 Moderate
- Heat 7/10 Severe 7 d/yr ≥108°F today · 20 d/yr by 30 yrs out
- Wind 8/10 Severe 80% chance of damaging wind over 30 yrs
- Air quality 2/10 Low 1 unhealthy d/yr today · 3 by 30 yrs out
Nearby sold comps map
Loading sold comps map…
Walkable amenities ~0.75 mi
Loading nearby amenities…
Taxation est. · year 1
- Rental income
- $16,301
- − Mortgage interest
- −$7,842
- − Property taxes
- −$607
- − Insurance
- −$700
- − Repairs & maintenance
- −$1,304
- − Management
- −$1,304
- − Depreciation
- −$4,073
- Taxable income
- $471
- Est. tax owed @ 24.0%
- −$113
- After-tax cash flow
- $2,648/yr
For passive investors: Depreciation is non-cash, so a rental often shows a tax loss while cash-flowing — sheltering income. Rental losses are passive: they offset passive income freely, and up to $25,000/yr can offset ordinary (W-2) income if you actively participate and your MAGI is under $100k (phasing out to $0 by $150k); unused losses carry forward. On sale, claimed depreciation is recaptured at up to 25%, and gains may owe capital-gains tax (a 1031 exchange can defer both). Figures are a year-1 estimate at your 24.0% rate — not tax advice; consult a CPA.
Schools (NCES district)
- District
- Montgomery County
- NCES district ID
- 0102430
- Math proficiency
- 9% ▼ -21.00%
- Reading proficiency
- 31% ▼ -1.00%
- Median HH income
- $43,902
- Composite
- 17.24/100
- National rank
- #9093
- State rank
- #106 of 129 in AL
Livability — Montgomery
- Score
- 65/100
- State rank
- #138
- US rank
- #13416
Category grades
Schools grade is shown separately in the Schools card above.
Census & demographics
- Census place
- Montgomery, AL
- County
- Montgomery County · 190,016 people
- City population
- 175,913
- Metro
- Montgomery, AL
- Population (ZIP)
- 45,250
- Household income
- $55,160
- Rent vs Own
- Severe rent burden
- 2786.0
Population outlook (Montgomery County) Hauer SSP2
- Today (2025)
- 224,008 people
- By 2030
- 221,460 · -1.1%
- By 2040
- 214,179 · -4.4%
- By 2050
- 204,912 · -8.5%
- By 2075
- 177,821 · -20.6%
- By 2100
- 145,134 · -35.2%
Race, ethnicity, and origin ACS 2023
- Neighborhood character
- Predominantly Black (80%)
- Race & ethnicity
- Black 80% White 12% Two or more races 4% Asian 3% Hispanic / Latino 2%
- Common ancestry
- Italian 1%
- Foreign-born
- 5% · Canada, South Korea
- Languages at home
- 94% English-only · Spanish 2% Other Indo-European 1% Korean 1%
Political lean MEDSL · Montgomery
- 2024 margin
- Solid D (+30.7) · D 64.8% · R 34.1% · Other 1.1%
- 2008→2024 swing
- +11.5pp toward D · 2008: 19.2pp · 2024: 30.7pp
- All cycles
- 2024: D+30.7 2020: D+31.5 2016: D+26.2 2012: D+24.3 2008: D+19.2
Not yet ingested
- Civics
- —
Market trends
- HPI YoY
- ▼ -16.31%
- Current HPI
- 151.8598
- Rent YoY
- ▲ 5.65%
- Metro
- Montgomery, AL
- State GDP YoY
- ▲ 2.94%
- F500 in state
- 4
Industry mix (Fortune 500 HQ in AL)
| Industry | F500 HQs | Revenue |
|---|---|---|
| Financial Services | 1 | $8B |
|
||
| Healthcare | 1 | $5B |
|
||
Price history
+488.1% since first listed16 events — show timeline
- 2026-03-08 Listed $152,900 MAAR
- 2025-10-02 Relisted — MAAR
- 2025-08-31 Relisted — MAAR
- 2025-06-04 Price Changed $155,000 MAAR
- 2025-05-11 Relisted — MAAR
- 2025-05-02 Contingent — MAAR
- 2025-04-07 Price Changed $160,000 MAAR
- 2025-04-02 Relisted — MAAR
- 2025-03-03 Price Changed $165,000 MAAR
- 2025-01-14 Price Changed $175,000 MAAR
- 2024-10-01 Relisted — MAAR
- 2024-10-01 Listed $180,000 MAAR
- 2013-04-09 Listed $74,900 MAAR
- 2012-05-11 Listed $86,499 MAAR
- 2012-01-31 Sold (MLS) $26,000 MAAR
- 2011-08-17 Listed $26,000 MAAR
Property tax history
+1.8%/yrLatest (2025): $607 · -2.9% YoY. Source: county tax records.
Cash-flow waterfall
monthlySold comps — $/sqft
last 12 mo · ≤1 miLoading sold comps…