326 Jasper St #20 · Bacliff, TX
Flood risk 7/10 · Major
- FEMA flood zone
- X (shaded)
- Chance of flooding over 30 yrs
- 0.74%
- Est. flood insurance / yr
- $507 – $1,088
Fire risk 3/10 · Minor
- Est. fire insurance / yr
- $1,222 – $2,270
Heat risk 10/10 · Severe
- Hot days now (above 109°F)
- 7 days/yr
- Hot days in 30 yrs
- 26 days/yr
Wind risk 9/10 · Severe
- Chance of severe wind over 30 yrs
- 99.0%
Air-quality risk 2/10 · Minimal
- Unhealthy air days now
- 1 days/yr
- Unhealthy air days in 30 yrs
- 1 days/yr
Risk factors via First Street. Map © Google.
Why this score? — see what drove the B grade
The composite is a weighted blend of 9 inputs, each scored 0–100. Each bar is that input's sub-score; the figure is the points it added to the 100-point composite (weight × sub-score).
- Cash flow +30.0/30.0
- 1% rule +10.0/10.0
- DSCR +10.0/10.0
- ARV discount +7.5/15.0
- Schools +4.6/10.0
- Condition / age +3.8/5.0
- Livability +2.9/5.0
- Rent growth +2.5/5.0
- Appreciation +0.0/10.0
$54,000
🖨 Deal sheet (PDF) 📄 Offer letter ✓ Due diligence
Listing remarks
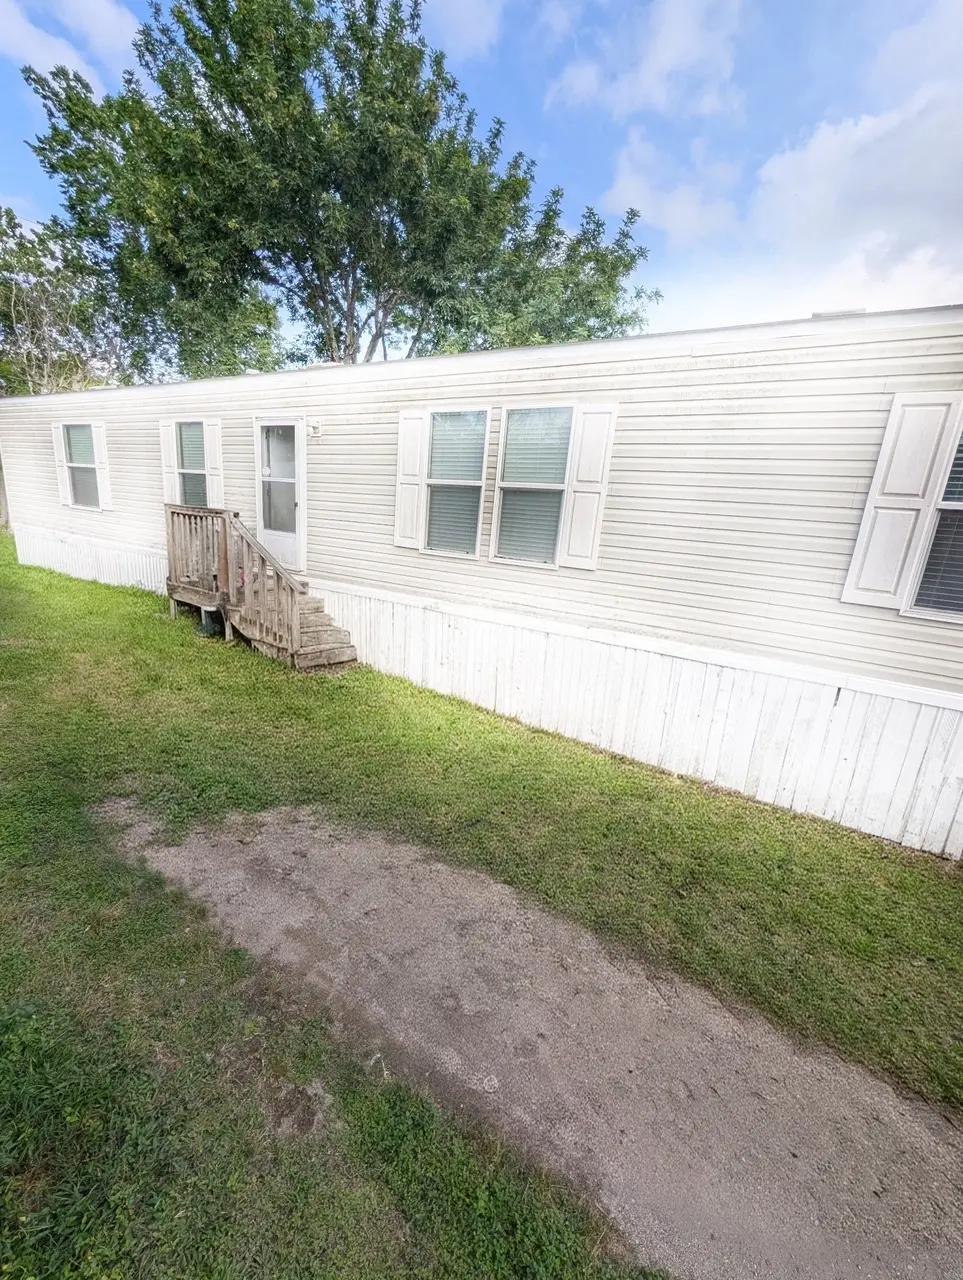
Located 3 minutes from Kemah boardwalk!! Nice 3-bedroom, 2-bath mobile home for sale! This well-maintained home offers a spacious layout and comfortable living areas. Home is currently located on a rented lot which includes water, sewage, trash, and lawn services. Mobile home may also be moved to another location if desired. Cash or chattel loan accepted. Motivated seller — bring your offers! Contact agent today for more information or to schedule a showing. Buyer is to verify all information.
Key facts
- Built 2019
- Listed 51 days
Property features AI
Finance
- Other: Seller disclosure available
- HOA & community: Homeowners association with monthly fee; HOA covers grounds maintenance
Exterior
- Utilities: Public water; Public sewer
- Home design: Residential property; Built in 2019; Single-story (entry level not specified); Slab foundation; Composition roof
- Construction: Built in 2019; Slab foundation; Composition roof
- Exterior features: Other lot features
Interior
- Bedrooms: 3 bedrooms possible
- Bathrooms: 2 full bathrooms
- Heating & cooling: Central heating (electric); Central air conditioning (electric)
- Interior features: Total of 3 rooms
Neighborhood map
What this means for you Summary
Snapshot
- This is a 3-bed/2.0-bath manufactured listed at $54k. Condition is rated good.
Deal economics
- At list price, monthly cash flow is $1k ($15k/yr) — positive.
- The deal already cash-flows at list — no discount required.
- Meets the 1% rule at list price ($2k rent vs $54k).
- Recommended offer: $52k (3.0% below list) — sets the bar for market timing.
- Cap rate 35.3% vs local median 5.1% in Bacliff — top-decile yield for the area; either an underpriced asset or a hidden risk that comps aren't pricing in. Stress-test before assuming the spread holds.
Location & tenants
- Location reads 57/100 on livability (#1,252 in TX) — a working-class tenant base; expect higher turnover. Strengths: cost of living A+, housing A+; Watch: employment D+, crime D, amenities F.
- Clear Creek ISD (suburban): math 48% / reading 54% proficiency, ranked #114 of 826 in TX (top 14%) — acceptable for families but not a draw, mixed tenant base, ~2y average lease.
- Zoned schools: Lavace Stewart El (math 34% / reading 44%, grade F, #1,651 of 4,322 statewide, top 39%, 740 students, 67% FRL); Bayside Int (math 40% / reading 49%, grade D, #491 of 1,662 statewide, top 31%, 1,001 students, 30% FRL); Clear Creek H S (math 51% / reading 54%, grade C-, #444 of 1,632 statewide, top 27%, 2,400 students, 0% FRL).
- Market conditions: 62 active listings in the ZIP; 2 comparable units currently listed for rent nearby; 3,258 units permitted in Galveston County in 2024 (0 in 5+ unit buildings).
- At $2,100/mo this rent would consume 49% of the median local household income ($51k/yr) (locally 672% of renters already pay >50% of income on rent) — very limited rent-growth headroom before tenants either downsize or default.
Forward outlook
- Local home prices are declining (-3.0%/yr); year-one equity from $373 of loan paydown is wiped out by about $2k of value loss. Plan a longer hold.
- Galveston County population projected at +43% by 2050 — long-run rental-demand tailwind backs the buy-and-hold thesis.
- At projected returns (-3.0% appreciation + 3.0% rent growth), your $15k cash investment doubles in ~2 years — after that, you're playing with house money.
Negotiation context
- It's been on market 51 days — a 3% lower offer ($52k) is reasonable based on typical stale-listing flexibility.
Risks & watch-outs
- Watch-outs: flood insurance adds $66/mo.
- Climate carrying-cost: major flood risk; severe wind risk, 99% chance of damaging wind over 30y; extreme-heat days projected 7→26/yr by 2055 (HVAC capex compounding) — expect insurance premiums to compound above CPI over the hold.
Questions for the listing agent
- It's been on market 51 days. Have you received any prior offers? Is the seller open to a 3% concession, seller financing, or rate buy-down credit?
- What's the actual annual flood-insurance premium (NFIP or private), and is the property in a SFHA with mandatory coverage?
- Is there a deadline driving the sale (1031 exchange, divorce, estate, relocation)? That informs how much negotiation room exists.
- Schools are F-rated, which usually means shorter tenancies and higher turnover. Who's the typical renter profile here, and what's been the actual vacancy rate?
- Crime grade is D in this area — have there been break-ins, vandalism, or insurance claims at this property in the last 3 years? What carrier currently insures it and at what premium?
- What's the average days-on-market for RENTAL listings here right now (not sales)? A rising rental-DOM trend means longer vacancies and softer asking-rent achievability than the comps imply.
- What's the recent tenant-quality profile in this submarket — average credit score on applications, eviction rate, late-payment / NSF rate, and stable-employment percentage? A property-management company in the area should have these aggregated.
- How much new for-sale + rental construction is in the pipeline within 1–3 miles? Heavy new supply typically softens prices + rents 12–24 months out; constrained supply supports both.
Investment metrics
- 1% rule
- 3.89% ✓
- Cap rate
- 35.30%
- Cash-on-cash
- 103.59%
- DSCR
- 5.61
- GRM
- 2.1
CMA / ARV
- ARV (median comp)
- $155,543
- List price
- $54,000
- Delta
- -65.28%
- Verdict
- UNDERPRICED
- Comps
- 2 within 2.0 mi
Projected returns pro-forma
-3.0% appreciation · 3.0% rent growth · sell at horizon
- IRR
- 99.4%
- Equity multiple
- 5.64×
- Total profit
- $70,210
- Equity at exit
- $8,052
- IRR
- —
- Equity multiple
- 11.78×
- Total profit
- $162,979
- Equity at exit
- $4,669
Cash invested: $15,120 (down + closing). Projections, not guarantees.
Landlord ↔ Tenant lean methodology
- Overall (STATE)
- 87 Strongly Landlord-Friendly
- State Texas
- 87 Strongly Landlord-Friendly · R+5
- County
- — inherits STATE
- City
- — inherits STATE
ZIP-level market 77518
- Home prices YoY
- -7.6%
- Active inventory
- 62
- Price-to-rent
- 2.1×
Monthly cashflow live
- Estimated rent
- $2,100 medium interval (Pro) →
- Mortgage (P&I)
- −$283
- Tax from tax record
- −$48 /mo · $581/yr
- Insurance
- −$22
- Flood insurance flood zone
- −$66 /mo · $798/yr
- HOA
- −$0
- Vacancy / Maint / Mgmt
- −$441
- Net cashflow
- $1,239
Break-even live
Sensitivity live
| Price | -10% $1,269 | -5% $1,254 | +0% $1,239 | +5% $1,224 | +10% $1,208 |
|---|---|---|---|---|---|
| Rent | -10% $1,073 | -5% $1,156 | +0% $1,239 | +5% $1,322 | +10% $1,405 |
| Rate | -1.0pp $1,266 | -0.5pp $1,253 | base $1,239 | +0.5pp $1,225 | +1.0pp $1,211 |
UW: 25.0% down · 7.5% · 30yr · 1.5% tax · 5.0% vac · 8.0% maint · 8.0% mgmt
Financing live
Cash to close
- Down payment
- $13,500
- Closing costs
- $1,620
- Reserves months
- —
- Total cash needed
- —
Loan-product check · same deal, 3 products live
Conventional
25% down · 7.5% · 30yr
- Down + closing
- —
- Monthly P&I
- —
- Monthly cashflow
- —
- DSCR
- —
- Eligible?
- —
Personal DTI + credit; lowest rate.
DSCR
20% down · 8.5% · 30yr
- Down + closing
- —
- Monthly P&I
- —
- Monthly cashflow
- —
- DSCR
- —
- Eligible?
- —
No personal income docs; deal must DSCR.
Hard money
10% down · 12.0% · 12mo
- Down + closing
- —
- Monthly P&I
- —
- Monthly cashflow
- —
- DSCR
- —
- Eligible?
- —
Short-term bridge; refi at stabilization.
Rent comps 2 comps
| Address | Beds | Baths | Sqft | Rent | $/sqft | DOM | Units | Dist |
|---|---|---|---|---|---|---|---|---|
| 2922 Michael St Bacliff, TX | 3.0 | 2.0 | 1325 | $1,900 | $1.43 | 45d | 1 | 0.24mi |
| 320 Louisiana Ave Bacliff, TX | 2.0 | 1.0 | 786 | $2,150 | $2.74 | 0d | 1 | 0.78mi |
Listing history 16 events
-
2026-06-21days on market $54,000 Active 51 DOM
-
2026-06-18days on market $54,000 Active 48 DOM
-
2026-06-17days on market $54,000 Active 47 DOM
-
2026-06-16days on market $54,000 Active 46 DOM
-
2026-06-15days on market $54,000 Active 45 DOM
-
2026-06-13days on market $54,000 Active 43 DOM
-
2026-06-13days on market $54,000 Active 42 DOM
-
2026-06-09days on market $54,000 Active 39 DOM
-
2026-06-08days on market $54,000 Active 38 DOM
-
2026-06-07days on market $54,000 Active 37 DOM
-
2026-06-04days on market $54,000 Active 34 DOM
-
2026-06-03days on market $54,000 Active 33 DOM
-
2026-06-02pricedays on market $54,000 Active 32 DOM
-
2026-06-01days on market $55,000 Active 31 DOM
-
2026-05-31days on market $55,000 Active 30 DOM
-
2026-04-30$55,000 Active 504-char remark
ⓘ Source: listings_history table (triggers on properties + properties_extension) + one-shot
backfill from property_details.listing_events for pre-trigger history.
Tax reassessment forecast TX · Resets to sale price
- Current annual tax
- $581 · $48/mo
- Projected year-2 tax
- $988 · $82/mo
- Expected delta
- +$408/yr (+$34/mo · 70.2%)
ⓘ Screening estimate from a state-policy table — verify with the county assessor before closing.
Climate risk First Street
- Flood 7/10 Severe FEMA zone X (shaded) · 74% chance over 30 yrs
- Wildfire 3/10 Moderate
- Heat 10/10 Extreme 7 d/yr ≥109°F today · 26 d/yr by 30 yrs out
- Wind 9/10 Extreme 99% chance of damaging wind over 30 yrs
- Air quality 2/10 Low 1 unhealthy d/yr today · 1 by 30 yrs out
Nearby sold comps map
Loading sold comps map…
Walkable amenities ~0.75 mi
Loading nearby amenities…
Taxation est. · year 1
- Rental income
- $25,205
- − Mortgage interest
- −$3,025
- − Property taxes
- −$581
- − Insurance
- −$1,068
- − Repairs & maintenance
- −$2,016
- − Management
- −$2,016
- − Depreciation
- −$1,571
- Taxable income
- $14,928
- Est. tax owed @ 24.0%
- −$3,583
- After-tax cash flow
- $11,283/yr
For passive investors: Depreciation is non-cash, so a rental often shows a tax loss while cash-flowing — sheltering income. Rental losses are passive: they offset passive income freely, and up to $25,000/yr can offset ordinary (W-2) income if you actively participate and your MAGI is under $100k (phasing out to $0 by $150k); unused losses carry forward. On sale, claimed depreciation is recaptured at up to 25%, and gains may owe capital-gains tax (a 1031 exchange can defer both). Figures are a year-1 estimate at your 24.0% rate — not tax advice; consult a CPA.
Condition & rehab AI · 12 photos
This well-maintained mobile home is in good condition with modern updates and a good curb appeal. Quick improvements can further enhance its value for resale or rental.
Value-add opportunities
- Resale Paint exterior shutters — Enhances curb appeal and can be a quick, low-cost improvement.
- Both Replace worn flooring — Improves aesthetics and can increase both resale and rental value.
- Resale Update kitchen appliances — Modern appliances can attract more buyers and renters.
- Both Install smart home features — Enhances convenience and can attract tech-savvy buyers and renters.
- Both Landscaping improvements — Enhances curb appeal and can attract more buyers and renters.
Renovation cost estimate screening
Value-add ROI direction
- Resale Paint exterior shutters — Enhances curb appeal and can be a quick, low-cost improvement. ↑
- Both Replace worn flooring — Improves aesthetics and can increase both resale and rental value. ↑
- Resale Update kitchen appliances — Modern appliances can attract more buyers and renters. ↑
- Both Install smart home features — Enhances convenience and can attract tech-savvy buyers and renters. ↑
- Both Landscaping improvements — Enhances curb appeal and can attract more buyers and renters. ↑
ⓘ Cost ranges are severity-bucket heuristics (US national rule-of-thumb). Get contractor quotes + a written scope before underwriting a rehab budget.
Schools (NCES district)
- District
- Clear Creek ISD
- NCES district ID
- 4814280
- Math proficiency
- 48% ▼ -10.00%
- Reading proficiency
- 54% ▼ -4.00%
- Median HH income
- $80,240
- Composite
- 46.49/100
- National rank
- #2431
- State rank
- #114 of 826 in TX
Livability — Bacliff
- Score
- 57/100
- State rank
- #1252
- US rank
- #21864
Category grades
Schools grade is shown separately in the Schools card above.
Census & demographics
- Census place
- Bacliff, TX
- County
- Galveston County · 357,330 people
- City population
- 9,541
- Metro
- Houston-The Woodlands-Sugar Land, TX
- Population (ZIP)
- 9,541
- Household income
- $51,458
- Rent vs Own
- Severe rent burden
- 672.0
Population outlook (Galveston County) Hauer SSP2
- Today (2025)
- 390,640 people
- By 2030
- 425,226 · +8.9%
- By 2040
- 493,765 · +26.4%
- By 2050
- 559,698 · +43.3%
- By 2075
- 719,260 · +84.1%
- By 2100
- 819,628 · +109.8%
Race, ethnicity, and origin ACS 2023
- Neighborhood character
- Diverse neighborhood (Simpson 0.60)
- Race & ethnicity
- Hispanic / Latino 46% White 43% Two or more races 21% Black 7% Asian 2% Native American 1%
- Hispanic origin (detail)
- Mexican 31%
- Common ancestry
- Slovak 3% Lithuanian 2% Romanian 1%
- Foreign-born
- 15% · Canada, Vietnam, China
- Languages at home
- 66% English-only · Spanish 32% Vietnamese 1%
Political lean MEDSL · Galveston
- 2024 margin
- Strong R (+27.4) · D 35.7% · R 63.1% · Other 1.2%
- 2008→2024 swing
- -7.9pp toward R · 2008: -19.5pp · 2024: -27.4pp
- All cycles
- 2024: R+27.4 2020: R+22.6 2016: R+22.6 2012: R+26.9 2008: R+19.5
Not yet ingested
- Civics
- —
Market trends
- HPI YoY
- ▼ -24.15%
- Current HPI
- 293.2677
- Rent YoY
- —
- Metro
- Houston-The Woodlands-Sugar Land, TX
- State GDP YoY
- ▲ 3.95%
- F500 in state
- 110
Industry mix (Fortune 500 HQ in TX)
| Industry | F500 HQs | Revenue |
|---|---|---|
| Energy | 16 | $1,198B |
|
||
| Technology | 5 | $198B |
|
||
| Engineering / Construction | 4 | $72B |
|
||
| Energy Services | 3 | $60B |
|
||
| Utilities | 3 | $41B |
|
||
| Healthcare | 2 | $330B |
|
||
Price history
-1.8% since first listed2 events — show timeline
- 2026-06-01 Price Changed $54,000 HARMLS
- 2026-04-30 Listed $55,000 HARMLS
Property tax history
-0.9%/yrLatest (2025): $581 · +9.2% YoY. Source: county tax records.
Cash-flow waterfall
monthlySold comps — $/sqft
last 12 mo · ≤1 miLoading sold comps…