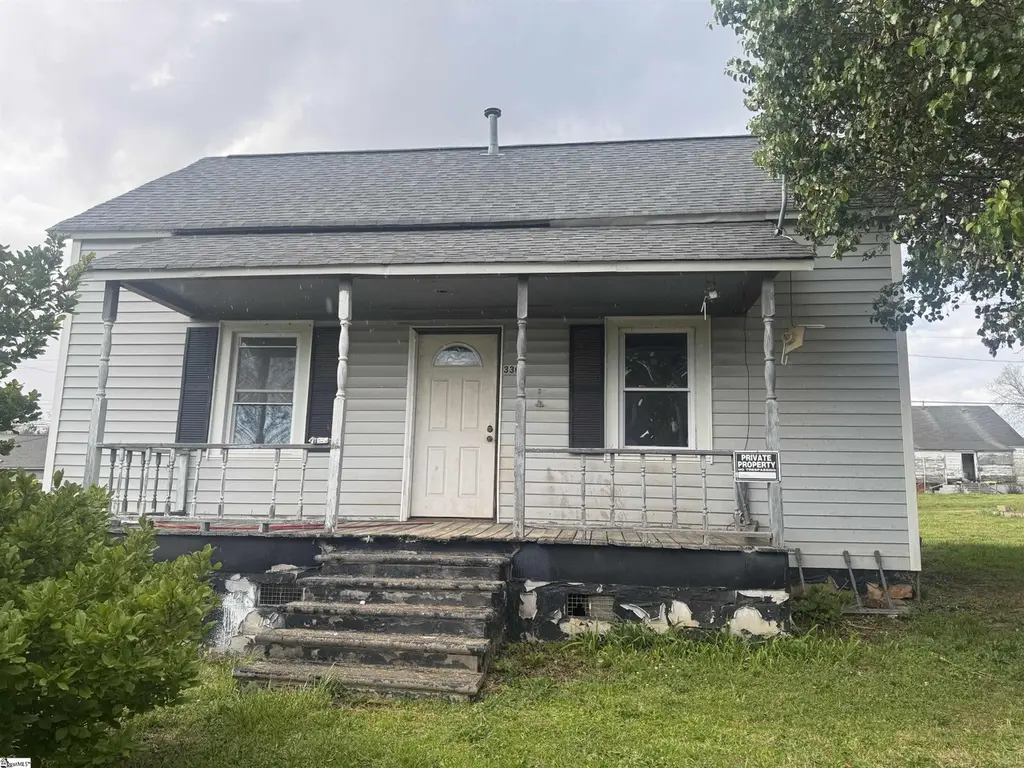
330 B St · Jonesville, SC
Flood risk 1/10 · Minimal
- FEMA flood zone
- X (unshaded)
- Chance of flooding over 30 yrs
- 0.0%
- Est. flood insurance / yr
- $507 – $1,088
Fire risk 4/10 · Minor
- Est. fire insurance / yr
- $783 – $1,453
Heat risk 6/10 · Moderate
- Hot days now (above 106°F)
- 7 days/yr
- Hot days in 30 yrs
- 16 days/yr
Wind risk 3/10 · Minor
- Chance of severe wind over 30 yrs
- 6.0%
Air-quality risk 3/10 · Minor
- Unhealthy air days now
- 3 days/yr
- Unhealthy air days in 30 yrs
- 4 days/yr
Risk factors via First Street. Map © Google.
Why this score? — see what drove the B grade
The composite is a weighted blend of 9 inputs, each scored 0–100. Each bar is that input's sub-score; the figure is the points it added to the 100-point composite (weight × sub-score).
- Cash flow +30.0/30.0
- DSCR +10.0/10.0
- 1% rule +8.3/10.0
- ARV discount +7.5/15.0
- Appreciation +5.4/10.0
- Livability +3.0/5.0
- Rent growth +2.5/5.0
- Condition / age +2.5/5.0
- Schools +2.3/10.0
$65,000
🖨 Deal sheet (PDF) 📄 Offer letter ✓ Due diligence
Listing remarks
Great opportunity in the heart of Jonesville! This property offers potential for investment, renovation, or personal use. Conveniently located near local amenities with easy access to surrounding areas. Spacious yard provides room for outdoor enjoyment and added possibilities. Property is being sold as-is. Buyer to verify any information deemed important.
Key facts
- 0.28 acre lot
- Garage
- Listed 46 days
Tags
Property features AI
Finance
- Other: Lead based paint and residential property disclosures required
- HOA & community: No HOA fees or community amenities listed
Exterior
- Parking: See parking features (garage type referenced)
- Utilities: Water: Other/See Remarks; Water heater: Other (See Remarks); Sewer: Other/See Remarks; Garbage pickup: None; Power/other utilities referenced as Other/See Remarks
- Home design: Single-story home; Estimated age 50+ years; Crawl space foundation
- Construction: Vinyl siding exterior; Architectural roof
- Exterior features: Front porch; Lot described as Other/See Remarks; Lot size is 1/2 acre or less
Interior
- Kitchen: Kitchen approx. 14 x 9; No appliances listed
- Bedrooms: Two bedrooms on the main level; Primary bedroom approx. 15 x 13; Second bedroom approx. 14 x 9
- Flooring: Laminate flooring
- Bathrooms: One full bathroom on the main level
- Heating & cooling: Heating: Other/See Remarks; Cooling: Other/See Remarks
- Interior features: Other/See Remarks interior details; No fireplace
- Laundry & utility: Laundry located on the 1st floor
Neighborhood map
What this means for you Summary
Snapshot
- This is a 2-bed/1.0-bath other listed at $65k.
Deal economics
- At list price, monthly cash flow is $283 ($3k/yr) — positive.
- The deal already cash-flows at list — no discount required.
- Meets the 1% rule at list price ($866 rent vs $65k).
- Recommended offer: $63k (3.0% below list) — sets the bar for market timing.
Location & tenants
- Location reads 59/100 on livability (#254 in SC) — a working-class tenant base; expect higher turnover. Strengths: cost of living A+, housing A, crime B; Watch: amenities F, commute F, employment F.
- Union 01 (town): math 23% / reading 33% proficiency, ranked #60 of 80 in SC (top 75%) — low school quality limits family demand, transient renter base, plan for 1-2y turnover; 64% free/reduced lunch — lower-income household profile, screen leases tightly.
- Zoned schools: Jonesville Elementary Middle (math 25% / reading 27%, grade F, #439 of 597 statewide, top 74%, 603 students, 43% FRL); Sims Middle (math 14% / reading 25%, grade F, #182 of 229 statewide, top 80%, 672 students, 100% FRL); Union County High (math 31% / reading 71%, grade D+, #148 of 196 statewide, top 76%, 1,069 students, 100% FRL) — zoned schools average 81% FRL vs 64% district-wide (18 pts higher); higher-poverty schools than district average — tighter screening recommended.
- Market conditions: 27 active listings in the ZIP; 57 units permitted in Union County in 2024 (0 in 5+ unit buildings).
Forward outlook
- In year one you build about $1k of equity ($449 loan paydown + $584 appreciation (0.9% local appreciation)).
- Union County population projected at -28% by 2050 — secular population decline; favor cash flow + early exit over multi-decade hold.
- At projected returns (0.9% appreciation + 3.0% rent growth), your $18k cash investment doubles in ~4 years — after that, you're playing with house money.
Negotiation context
- It's been on market 47 days — a 3% lower offer ($63k) is reasonable based on typical stale-listing flexibility.
- Current owner paid $17k; list at $65k implies a 278% gain — meaningful room to come down on a strong offer.
Risks & watch-outs
- Climate carrying-cost: extreme-heat days projected 7→16/yr by 2055 (HVAC capex compounding) — expect insurance premiums to compound above CPI over the hold.
Questions for the listing agent
- It's been on market 47 days. Have you received any prior offers? Is the seller open to a 3% concession, seller financing, or rate buy-down credit?
- Is there a deadline driving the sale (1031 exchange, divorce, estate, relocation)? That informs how much negotiation room exists.
- Schools are F-rated, which usually means shorter tenancies and higher turnover. Who's the typical renter profile here, and what's been the actual vacancy rate?
- What's the average days-on-market for RENTAL listings here right now (not sales)? A rising rental-DOM trend means longer vacancies and softer asking-rent achievability than the comps imply.
- What's the recent tenant-quality profile in this submarket — average credit score on applications, eviction rate, late-payment / NSF rate, and stable-employment percentage? A property-management company in the area should have these aggregated.
- How much new for-sale + rental construction is in the pipeline within 1–3 miles? Heavy new supply typically softens prices + rents 12–24 months out; constrained supply supports both.
Investment metrics
- 1% rule
- 1.33% ✓
- Cap rate
- 11.53%
- Cash-on-cash
- 18.69%
- DSCR
- 1.83
- GRM
- 6.3
CMA / ARV
No comps found within radius.
Projected returns pro-forma
0.9% appreciation · 3.0% rent growth · sell at horizon
- IRR
- 20.5%
- Equity multiple
- 2.04×
- Total profit
- $18,931
- Equity at exit
- $21,849
- IRR
- 23.6%
- Equity multiple
- 3.83×
- Total profit
- $51,476
- Equity at exit
- $28,774
Cash invested: $18,200 (down + closing). Projections, not guarantees.
Landlord ↔ Tenant lean methodology
- Overall (STATE)
- 90 Strongly Landlord-Friendly
- State South Carolina
- 90 Strongly Landlord-Friendly · R+6
- County
- — inherits STATE
- City
- — inherits STATE
ZIP-level market 29353
- Home prices YoY
- 0.6%
- Active inventory
- 27
- Price-to-rent
- 6.3×
Monthly cashflow live
- Estimated rent
- $866 medium interval (Pro) →
- Mortgage (P&I)
- −$341
- Tax from tax record
- −$33 /mo · $396/yr
- Insurance
- −$27
- HOA
- −$0
- Vacancy / Maint / Mgmt
- −$182
- Net cashflow
- $283
Break-even live
Sensitivity live
| Price | -10% $320 | -5% $302 | +0% $283 | +5% $265 | +10% $247 |
|---|---|---|---|---|---|
| Rent | -10% $215 | -5% $249 | +0% $283 | +5% $318 | +10% $352 |
| Rate | -1.0pp $316 | -0.5pp $300 | base $283 | +0.5pp $267 | +1.0pp $249 |
UW: 25.0% down · 7.5% · 30yr · 1.5% tax · 5.0% vac · 8.0% maint · 8.0% mgmt
Financing live
Cash to close
- Down payment
- $16,250
- Closing costs
- $1,950
- Reserves months
- —
- Total cash needed
- —
Loan-product check · same deal, 3 products live
Conventional
25% down · 7.5% · 30yr
- Down + closing
- —
- Monthly P&I
- —
- Monthly cashflow
- —
- DSCR
- —
- Eligible?
- —
Personal DTI + credit; lowest rate.
DSCR
20% down · 8.5% · 30yr
- Down + closing
- —
- Monthly P&I
- —
- Monthly cashflow
- —
- DSCR
- —
- Eligible?
- —
No personal income docs; deal must DSCR.
Hard money
10% down · 12.0% · 12mo
- Down + closing
- —
- Monthly P&I
- —
- Monthly cashflow
- —
- DSCR
- —
- Eligible?
- —
Short-term bridge; refi at stabilization.
Listing history 20 events
-
2026-06-22days on market $65,000 Active 47 DOM
-
2026-06-21days on market $65,000 Active 46 DOM
-
2026-06-19days on market $65,000 Active 44 DOM
-
2026-06-18days on market $65,000 Active 43 DOM
-
2026-06-17days on market $65,000 Active 42 DOM
-
2026-06-16days on market $65,000 Active 41 DOM
-
2026-06-15days on market $65,000 Active 40 DOM
-
2026-06-14days on market $65,000 Active 38 DOM
-
2026-06-12days on market $65,000 Active 37 DOM
-
2026-06-09days on market $65,000 Active 34 DOM
-
2026-06-08days on market $65,000 Active 33 DOM
-
2026-06-07days on market $65,000 Active 32 DOM
-
2026-06-05days on market $65,000 Active 29 DOM
-
2026-06-03days on market $65,000 Active 28 DOM
-
2026-06-02days on market $65,000 Active 27 DOM
-
2026-06-01days on market $65,000 Active 26 DOM
-
2026-05-31days on market $65,000 Active 25 DOM
-
2026-05-30days on market $65,000 Active 24 DOM
-
2026-05-06$65,000 Active
-
1999-09-01soldstatus $17,206
ⓘ Source: listings_history table (triggers on properties + properties_extension) + one-shot
backfill from property_details.listing_events for pre-trigger history.
Tax reassessment forecast SC · Resets to sale price
- Current annual tax
- $396 · $33/mo
- Projected year-2 tax
- $396 · $33/mo
- Expected delta
- $0/yr ($0/mo · 0.0%)
ⓘ Screening estimate from a state-policy table — verify with the county assessor before closing.
Climate risk First Street
- Flood 1/10 Low FEMA zone X (unshaded) · 0% chance over 30 yrs
- Wildfire 4/10 Moderate
- Heat 6/10 Major 7 d/yr ≥106°F today · 16 d/yr by 30 yrs out
- Wind 3/10 Moderate 6% chance of damaging wind over 30 yrs
- Air quality 3/10 Moderate 3 unhealthy d/yr today · 4 by 30 yrs out
Nearby sold comps map
Loading sold comps map…
Walkable amenities ~0.75 mi
Loading nearby amenities…
Taxation est. · year 1
- Rental income
- $10,396
- − Mortgage interest
- −$3,641
- − Property taxes
- −$396
- − Insurance
- −$325
- − Repairs & maintenance
- −$832
- − Management
- −$832
- − Depreciation
- −$1,891
- Taxable income
- $2,480
- Est. tax owed @ 24.0%
- −$595
- After-tax cash flow
- $2,806/yr
For passive investors: Depreciation is non-cash, so a rental often shows a tax loss while cash-flowing — sheltering income. Rental losses are passive: they offset passive income freely, and up to $25,000/yr can offset ordinary (W-2) income if you actively participate and your MAGI is under $100k (phasing out to $0 by $150k); unused losses carry forward. On sale, claimed depreciation is recaptured at up to 25%, and gains may owe capital-gains tax (a 1031 exchange can defer both). Figures are a year-1 estimate at your 24.0% rate — not tax advice; consult a CPA.
Schools (NCES district)
- District
- Union 01
- NCES district ID
- 4503750
- Math proficiency
- 23% ▼ -9.00%
- Reading proficiency
- 33% ▬ 0.00%
- Median HH income
- $34,709
- Composite
- 23.05/100
- National rank
- #7971
- State rank
- #60 of 80 in SC
Livability — Jonesville
- Score
- 59/100
- State rank
- #254
- US rank
- #20379
Category grades
Schools grade is shown separately in the Schools card above.
Census & demographics
- Census place
- Jonesville, SC
- Population (ZIP)
- 3,627
Population outlook (Union County) Hauer SSP2
- Today (2025)
- 25,518 people
- By 2030
- 24,099 · -5.6%
- By 2040
- 21,133 · -17.2%
- By 2050
- 18,314 · -28.2%
- By 2075
- 13,235 · -48.1%
- By 2100
- 9,565 · -62.5%
Race, ethnicity, and origin ACS 2023
- Neighborhood character
- Predominantly White (68%)
- Race & ethnicity
- White 68% Black 27% Two or more races 3% Hispanic / Latino 2%
- Common ancestry
- Slovak 5% Italian 4% Serbian 2%
- Foreign-born
- 1% · Canada
- Languages at home
- 98% English-only · Spanish 1%
Political lean MEDSL · Union
- 2024 margin
- Solid R (+32.7) · D 33.2% · R 65.9%
- 2008→2024 swing
- -21.5pp toward R · 2008: -11.2pp · 2024: -32.7pp
- All cycles
- 2024: R+32.7 2020: R+24.5 2016: R+19.3 2012: R+6.5 2008: R+11.2
Not yet ingested
- Civics
- —
Market trends
- HPI YoY
- ▲ 0.90%
- Current HPI
- 155.2258
- Rent YoY
- —
- Metro
- —
- State GDP YoY
- ▲ 4.51%
- F500 in state
- 2
Industry mix (Fortune 500 HQ in SC)
| Industry | F500 HQs | Revenue |
|---|---|---|
| Packaging | 1 | $7B |
|
||
Price history
+277.8% since first listed2 events — show timeline
- 2026-05-06 Listed $65,000 Greater Greenville MLS
- 1999-09-01 Sold (Public Records) $17,206 Public Records
Property tax history
-0.7%/yrLatest (2025): $396 · +7.1% YoY. Source: county tax records.
Cash-flow waterfall
monthlySold comps — $/sqft
last 12 mo · ≤1 miLoading sold comps…