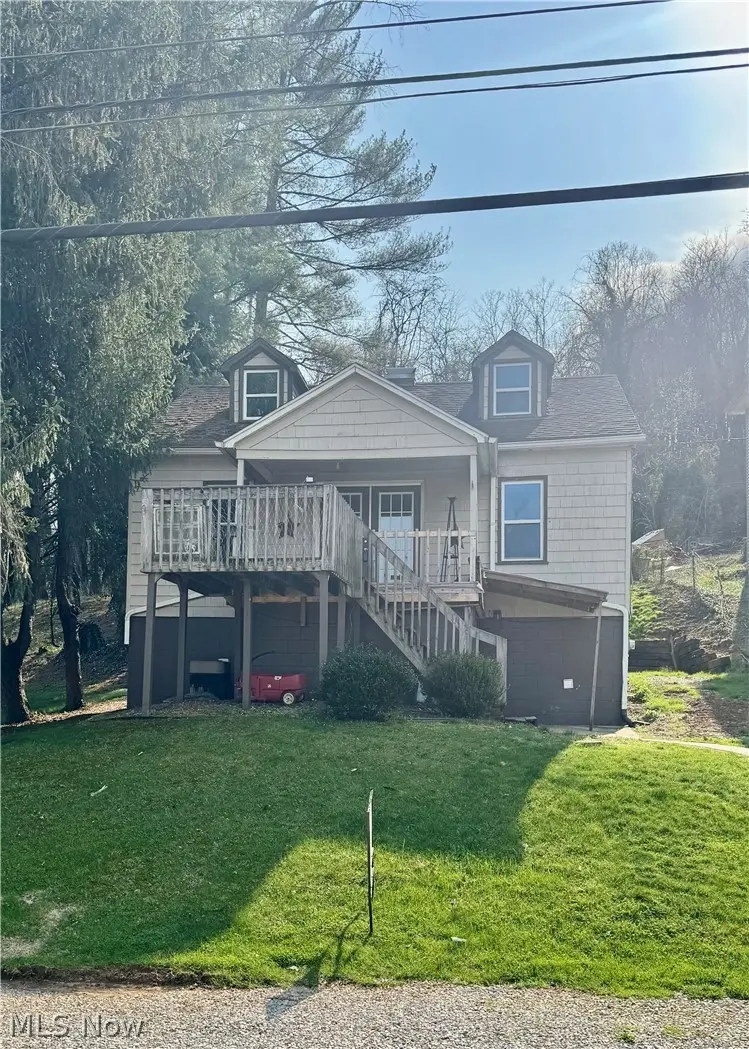
115 Leland Ave · Marietta, OH
Flood risk No data
- FEMA flood zone
- —
- Chance of flooding over 30 yrs
- —
- Est. flood insurance / yr
- —
Fire risk No data
- Est. fire insurance / yr
- —
Heat risk No data
- Hot days now (above threshold)
- —
- Hot days in 30 yrs
- —
Wind risk No data
- Chance of severe wind over 30 yrs
- —
Air-quality risk No data
- Unhealthy air days now
- —
- Unhealthy air days in 30 yrs
- —
Risk factors via First Street. Map © Google.
Why this score? — see what drove the B+ grade
The composite is a weighted blend of 9 inputs, each scored 0–100. Each bar is that input's sub-score; the figure is the points it added to the 100-point composite (weight × sub-score).
- Cash flow +30.0/30.0
- ARV discount +15.0/15.0
- 1% rule +10.0/10.0
- DSCR +10.0/10.0
- Livability +4.0/5.0
- Schools +3.5/10.0
- Rent growth +2.5/5.0
- Condition / age +2.5/5.0
- Appreciation +0.0/10.0
$79,990
🖨 Deal sheet (PDF) 📄 Offer letter ✓ Due diligence
Listing remarks MLS
Attention investors and buyers ready to put a few finishing touches on to make this house a home. .. This property is a prime opportunity for those looking to renovate and add value. In need of a few small repairs and updates, this home is best suited for buyers ready to take on small projects and maximize its potential as a rental or starter home! The home features a front porch with scenic river views, offering a unique selling point! Ideally located near the hospital, Washington County Career Center, and downtown shops, the convenience adds to its long-term appeal. If you’re searching for your next investment project with strong upside potential or your first home to add your own touch, this is one you won’t want to miss. Bring your vision and turn this property into something special!
Key facts
- Front porch
- Near the hospital
- Scenic river views
Tags
Neighborhood map
What this means for you Summary
Snapshot
- This is a 3-bed/1.0-bath single-family listed at $80k.
Deal economics
- At list price, monthly cash flow is $885 ($11k/yr) — positive.
- The deal already cash-flows at list — no discount required.
- Meets the 1% rule at list price ($2k rent vs $80k).
- Recommended offer: $75k (6.0% below list) — sets the bar for market timing.
- Cap rate 19.6% vs local median 6.3% in Marietta — top-decile yield for the area; either an underpriced asset or a hidden risk that comps aren't pricing in. Stress-test before assuming the spread holds.
Location & tenants
- Location reads 80/100 on livability (#127 in OH, #1,845 nationally) — a professional / high-income tenant draw. Strengths: cost of living A+, housing A+, health & safety A+; Watch: commute F, employment D-.
- Marietta City (town): math 35% / reading 49% proficiency, ranked #534 of 656 in OH (top 81%) — families likely to look elsewhere, expect single-tenant / working-renter base with shorter leases.
- Market conditions: 118 active listings in the ZIP; 3 comparable units currently listed for rent nearby; rentals lingering (median 45d on market — plan ~5-8 weeks vacancy on turnover, expect pricing pressure); 100% of comp listings sitting > 30 days — soft ceiling on asking rent; 3 units permitted in Washington County in 2024 (0 in 5+ unit buildings).
- This rent runs 36% of the median local income ($60k/yr) — at the standard rent-burdened threshold; future hikes will face affordability resistance.
Forward outlook
- Local home prices are declining (-3.0%/yr); year-one equity from $554 of loan paydown is wiped out by about $2k of value loss. Plan a longer hold.
- Washington County population projected at -12% by 2050 — secular population decline; favor cash flow + early exit over multi-decade hold.
- At projected returns (-3.0% appreciation + 3.0% rent growth), your $22k cash investment doubles in ~3 years — after that, you're playing with house money.
Negotiation context
- It's been on market 64 days — a 6% lower offer ($75k) is reasonable based on typical stale-listing flexibility.
- Current owner paid $69k; 16% above their basis — modest negotiation headroom, anchor on the comps not their cost.
Risks & watch-outs
- Watch-outs: built in 1950 — expect roof / HVAC / electrical / plumbing capex.
Questions for the listing agent
- It's been on market 64 days. Have you received any prior offers? Is the seller open to a 6% concession, seller financing, or rate buy-down credit?
- Built in 1950 — when were the roof, HVAC, electrical panel, plumbing, and water heater last replaced?
- Why hasn't it sold? Are there any deal-killer items the seller is aware of (foundation, flood, title, zoning, code violations)?
- Is there a deadline driving the sale (1031 exchange, divorce, estate, relocation)? That informs how much negotiation room exists.
- Schools are B-rated — typically a magnet for longer-tenancy family renters. What's the average tenant stay here, and is there a school-zone premium baked into asking?
- What's the average days-on-market for RENTAL listings here right now (not sales)? A rising rental-DOM trend means longer vacancies and softer asking-rent achievability than the comps imply.
- What's the recent tenant-quality profile in this submarket — average credit score on applications, eviction rate, late-payment / NSF rate, and stable-employment percentage? A property-management company in the area should have these aggregated.
- How much new for-sale + rental construction is in the pipeline within 1–3 miles? Heavy new supply typically softens prices + rents 12–24 months out; constrained supply supports both.
Investment metrics
- 1% rule
- 2.26% ✓
- Cap rate
- 19.57%
- Cash-on-cash
- 47.42%
- DSCR
- 3.11
- GRM
- 3.7
CMA / ARV
- ARV (median comp)
- $149,601
- List price
- $79,990
- Delta
- -46.53%
- Verdict
- UNDERPRICED
- Comps
- 20 within 1.0 mi
Show comp detail 12 sales within ~0.75 mi
| Address | Dist | Beds/Ba | Sqft | Sold | Price | $/sf | Match |
|---|---|---|---|---|---|---|---|
| 714 Front St | 0.45mi | 3/1.0 | 1,560 (-0%) | 1mo | $170,000 | $109 | 78 |
| 625 Front St | 0.55mi | 3/2.5 | 1,700 (+9%) | 8mo | $169,900 | $100 | 47 |
| 100 Cheyenne Rd | 0.48mi | 3/1.0 | 1,387 (-11%) | 15mo | $180,000 | $130 | 46 |
| 813 3rd St | 0.52mi | 2/1.0 (-1) | 1,407 (-10%) | 10mo | $200,000 | $142 | 45 |
| 127 Clark St | 0.23mi | 2/2.0 (-1) | 1,764 (+13%) | 17mo | $161,000 | $91 | 45 |
| 111 High St | 0.65mi | 2/1.0 (-1) | 1,440 (-8%) | 9mo | $132,500 | $92 | 44 |
| 828 Fifth St | 0.71mi | 3/1.0 | 1,352 (-14%) | 4mo | $135,000 | $100 | 40 |
| 606 Front St | 0.63mi | 2/2.0 (-1) | 1,740 (+11%) | 5mo | $157,200 | $90 | 39 |
| 623 Front St | 0.55mi | 4/2.5 (+1) | 1,400 (-11%) | 10mo | $185,151 | $132 | 37 |
| 723 5th St | 0.72mi | 2/2.0 (-1) | 1,606 (+3%) | 19mo | $325,000 | $202 | 37 |
| 107 Victory Pl | 0.75mi | 4/1.0 (+1) | 1,418 (-10%) | 18mo | $230,000 | $162 | 29 |
| 708 1/2 4th St | 0.70mi | 3/1.5 | 1,332 (-15%) | 19mo | $88,000 | $66 | 24 |
Match score weights: distance 35% · size 25% · config 20% · recency 20%. Top-matched comps best support the ARV.
Projected returns pro-forma
-3.0% appreciation · 3.0% rent growth · sell at horizon
- IRR
- 44.8%
- Equity multiple
- 2.94×
- Total profit
- $43,426
- Equity at exit
- $11,927
- IRR
- 50.7%
- Equity multiple
- 5.93×
- Total profit
- $110,483
- Equity at exit
- $6,916
Cash invested: $22,397 (down + closing). Projections, not guarantees.
Landlord ↔ Tenant lean methodology
- Overall (STATE)
- 73 Landlord-Friendly
- State Ohio
- 73 Landlord-Friendly · R+6
- County
- — inherits STATE
- City
- — inherits STATE
ZIP-level market 45750
- Home prices YoY
- -32.4%
- Active inventory
- 118
- Price-to-rent
- 3.7×
Monthly cashflow live
- Estimated rent
- $1,809 medium interval (Pro) →
- Mortgage (P&I)
- −$419
- Tax from tax record
- −$91 /mo · $1,092/yr
- Insurance
- −$33
- HOA
- −$0
- Vacancy / Maint / Mgmt
- −$380
- Net cashflow
- $885
Break-even live
Sensitivity live
| Price | -10% $930 | -5% $908 | +0% $885 | +5% $862 | +10% $840 |
|---|---|---|---|---|---|
| Rent | -10% $742 | -5% $814 | +0% $885 | +5% $956 | +10% $1,028 |
| Rate | -1.0pp $925 | -0.5pp $905 | base $885 | +0.5pp $864 | +1.0pp $843 |
UW: 25.0% down · 7.5% · 30yr · 1.5% tax · 5.0% vac · 8.0% maint · 8.0% mgmt
Financing live
Cash to close
- Down payment
- $19,998
- Closing costs
- $2,400
- Reserves months
- —
- Total cash needed
- —
Loan-product check · same deal, 3 products live
Conventional
25% down · 7.5% · 30yr
- Down + closing
- —
- Monthly P&I
- —
- Monthly cashflow
- —
- DSCR
- —
- Eligible?
- —
Personal DTI + credit; lowest rate.
DSCR
20% down · 8.5% · 30yr
- Down + closing
- —
- Monthly P&I
- —
- Monthly cashflow
- —
- DSCR
- —
- Eligible?
- —
No personal income docs; deal must DSCR.
Hard money
10% down · 12.0% · 12mo
- Down + closing
- —
- Monthly P&I
- —
- Monthly cashflow
- —
- DSCR
- —
- Eligible?
- —
Short-term bridge; refi at stabilization.
Rent comps 3 comps
| Address | Beds | Baths | Sqft | Rent | $/sqft | DOM | Units | Dist |
|---|---|---|---|---|---|---|---|---|
| 803 3rd St Marietta, OH | 3.0 | 2.0 | 1659 | $2,000 | $1.21 | 44d | 1 | 0.51mi |
| 1415 Lancaster St Marietta, OH | 3.0 | 1.0 | 662 | $1,195 | $1.81 | 44d | 4 | 1.29mi |
| 621 Virginia St #5 Marietta, OH | 3.0 | 2.0 | 1240 | $1,695 | $1.37 | 44d | 1 | 1.33mi |
Listing history 7 events
-
2026-06-02days on market $79,990 Active 64 DOM
-
2026-06-01days on market $79,990 Active 63 DOM
-
2026-05-31days on market $79,990 Active 62 DOM
-
2026-05-30days on market $79,990 Active 61 DOM
-
2026-03-30$85,000 Active 812-char remark
Show marketing remark (812 chars)
Attention investors and buyers ready to put a few finishing touches on to make this house a home. .. This property is a prime opportunity for those looking to renovate and add value. In need of a few small repairs and updates, this home is best suited for buyers ready to take on small projects and maximize its potential as a rental or starter home! The home features a front porch with scenic river views, offering a unique selling point! Ideally located near the hospital, Washington County Career Center, and downtown shops, the convenience adds to its long-term appeal. If you’re searching for your next investment project with strong upside potential or your first home to add your own touch, this is one you won’t want to miss. Bring your vision and turn this property into something special!
-
2012-09-21soldstatus $69,000
-
2004-06-03soldstatus $43,500
ⓘ Source: listings_history table (triggers on properties + properties_extension) + one-shot
backfill from property_details.listing_events for pre-trigger history.
Tax reassessment forecast OH · Partial reset (capped growth)
- Current annual tax
- $1,092 · $91/mo
- Projected year-2 tax
- $1,170 · $97/mo
- Expected delta
- +$78/yr (+$7/mo · 7.1%)
ⓘ Screening estimate from a state-policy table — verify with the county assessor before closing.
Nearby sold comps map
Loading sold comps map…
Walkable amenities ~0.75 mi
Loading nearby amenities…
Taxation est. · year 1
- Rental income
- $21,703
- − Mortgage interest
- −$4,481
- − Property taxes
- −$1,092
- − Insurance
- −$400
- − Repairs & maintenance
- −$1,736
- − Management
- −$1,736
- − Depreciation
- −$2,327
- Taxable income
- $9,931
- Est. tax owed @ 24.0%
- −$2,383
- After-tax cash flow
- $8,237/yr
For passive investors: Depreciation is non-cash, so a rental often shows a tax loss while cash-flowing — sheltering income. Rental losses are passive: they offset passive income freely, and up to $25,000/yr can offset ordinary (W-2) income if you actively participate and your MAGI is under $100k (phasing out to $0 by $150k); unused losses carry forward. On sale, claimed depreciation is recaptured at up to 25%, and gains may owe capital-gains tax (a 1031 exchange can defer both). Figures are a year-1 estimate at your 24.0% rate — not tax advice; consult a CPA.
Schools (NCES district)
- District
- Marietta City
- NCES district ID
- 3910019
- Math proficiency
- 35% ▼ -20.00%
- Reading proficiency
- 49% ▼ -12.00%
- Median HH income
- $39,366
- Composite
- 35.08/100
- National rank
- #5025
- State rank
- #534 of 656 in OH
Livability — Marietta
- Score
- 80/100
- State rank
- #127
- US rank
- #1845
Category grades
Schools grade is shown separately in the Schools card above.
Census & demographics
- Census place
- Marietta, OH
- County
- Washington County · 26,420 people
- City population
- 26,420
- Metro
- Marietta, OH
- Population (ZIP)
- 26,420
- Household income
- $60,229
- Rent vs Own
- Severe rent burden
- 727.0
Population outlook (Washington County) Hauer SSP2
- Today (2025)
- 59,640 people
- By 2030
- 58,315 · -2.2%
- By 2040
- 55,186 · -7.5%
- By 2050
- 52,246 · -12.4%
- By 2075
- 45,893 · -23.0%
- By 2100
- 38,128 · -36.1%
Race, ethnicity, and origin ACS 2023
- Neighborhood character
- Predominantly White (94%)
- Race & ethnicity
- White 94% Two or more races 2% Asian 1% Black 1% Hispanic / Latino 1%
- Common ancestry
- Italian 2% Slovak 2% Romanian 2%
- Foreign-born
- 2% · Canada
- Languages at home
- 97% English-only · Tagalog/Filipino 1% Other Indo-European 1%
Political lean MEDSL · Washington
- 2024 margin
- Solid R (+43.8) · D 27.7% · R 71.5%
- 2008→2024 swing
- +40.2pp toward D · 2008: -83.9pp · 2024: -43.8pp
- All cycles
- 2024: R+43.8 2020: R+40.8 2016: R+41.6 2012: R+19.4 2008: R+83.9
Not yet ingested
- Civics
- —
Market trends
- HPI YoY
- ▼ -95.06%
- Current HPI
- 198.6235
- Rent YoY
- —
- Metro
- Marietta, OH
- State GDP YoY
- ▲ 1.98%
- F500 in state
- 48
Industry mix (Fortune 500 HQ in OH)
| Industry | F500 HQs | Revenue |
|---|---|---|
| Insurance | 3 | $145B |
|
||
| Industrial Machinery | 3 | $49B |
|
||
| Financial Services | 3 | $24B |
|
||
| Consumer Goods | 2 | $93B |
|
||
| Aerospace / Defense | 2 | $47B |
|
||
| Utilities | 2 | $33B |
|
||
Price history
+95.4% since first listed3 events — show timeline
- 2026-03-30 Listed $85,000 MLSNOW
- 2012-09-21 Sold (Public Records) $69,000 Public Records
- 2004-06-03 Sold (Public Records) $43,500 Public Records
Property tax history
+5.0%/yrLatest (2025): $1,092 · +6.6% YoY. Source: county tax records.
Cash-flow waterfall
monthlySold comps — $/sqft
last 12 mo · ≤1 miLoading sold comps…