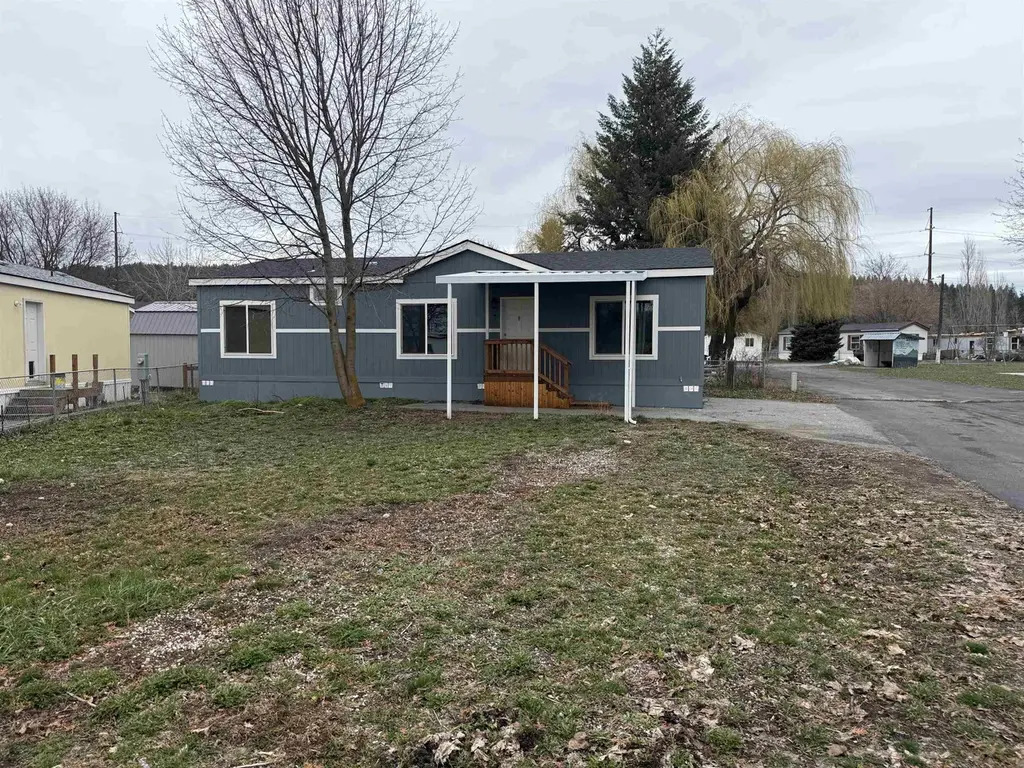
19625 E Wellesley Ave #13 · Spokane Valley, WA
Flood risk 1/10 · Minimal
- FEMA flood zone
- X (unshaded)
- Chance of flooding over 30 yrs
- 0.0%
- Est. flood insurance / yr
- $507 – $1,088
Fire risk 7/10 · Major
- Est. fire insurance / yr
- $604 – $1,122
Heat risk 3/10 · Minor
- Hot days now (above 93°F)
- 7 days/yr
- Hot days in 30 yrs
- 15 days/yr
Wind risk 1/10 · Minimal
- Chance of severe wind over 30 yrs
- —
Air-quality risk 9/10 · Severe
- Unhealthy air days now
- 15 days/yr
- Unhealthy air days in 30 yrs
- 17 days/yr
Risk factors via First Street. Map © Google.
Why this score? — see what drove the C+ grade
The composite is a weighted blend of 9 inputs, each scored 0–100. Each bar is that input's sub-score; the figure is the points it added to the 100-point composite (weight × sub-score).
- Cash flow +26.5/30.0
- DSCR +9.0/10.0
- ARV discount +7.5/15.0
- 1% rule +7.1/10.0
- Schools +4.3/10.0
- Livability +4.2/5.0
- Rent growth +2.5/5.0
- Condition / age +2.5/5.0
- Appreciation +0.0/10.0
$149,900
🖨 Deal sheet 📄 Offer letter ✓ Due diligence
Listing remarks
Be the first to live in this brand new doublewide manufactured home located in the desirable Timberline Mobile Home Park! This spacious home features 3 bedrooms and 2 bathrooms, offering a modern layout designed for comfort and convenience. Enjoy an open-concept living area with plenty of natural light, a beautiful kitchen with brand new appliances, and ample cabinet space. The primary bedroom includes a private en-suite bathroom, while the additional bedrooms are ideal for family, guests, or a home office.
Key facts
- 2 parking spots
- Built 2024
- Listed 36 days
Property features AI
Finance
- Financial info: Monthly land lease of $660
- HOA & community: Located in the Timberline park
Exterior
- Parking: Carport; 2 carport spaces
- Utilities: High-speed internet available
- Home design: Manufactured home; Residential property; FTWD make
- Construction: Masonite siding; Composition roof; Manufactured house structure
- Exterior features: Level lot; Corner lot; Within 6 blocks of city bus; City street and paved road frontage
Interior
- Kitchen: Free-standing range; Refrigerator; Hard surface counters
- Bedrooms: 3 bedrooms
- Heating & cooling: Forced air heating; Hot water heating
- Interior features: Kitchen island; Skirted foundation
Neighborhood map
What this means for you Summary
Snapshot
- This is a 3-bed/1.0-bath manufactured listed at $150k.
Deal economics
- At list price, monthly cash flow is $395 ($5k/yr) — positive.
- The deal already cash-flows at list — no discount required.
- Meets the 1% rule at list price ($2k rent vs $150k).
- Recommended offer: $145k (3.0% below list) — sets the bar for market timing.
- Cap rate 9.5% vs local median 3.0% in Spokane Valley — top-decile yield for the area; either an underpriced asset or a hidden risk that comps aren't pricing in. Stress-test before assuming the spread holds.
Location & tenants
- Location reads 85/100 on livability (#31 in WA, #512 nationally) — a professional / high-income tenant draw. Strengths: amenities A+, commute A+, housing A+; Watch: crime D+.
- East Valley School District (Spokane) (urban): math 40% / reading 56% proficiency, ranked #160 of 291 in WA (top 55%) — families likely to look elsewhere, expect single-tenant / working-renter base with shorter leases.
- Market conditions: 57 active listings in the ZIP; 3,608 units permitted in Spokane County in 2024 (1,792 in 5+ unit buildings).
Forward outlook
- Local home prices are declining (-3.0%/yr); year-one equity from $1k of loan paydown is wiped out by about $4k of value loss. Plan a longer hold.
- Spokane County population projected at +13% by 2050 — modest demand growth; plan on rents tracking national, not racing it.
- At projected returns (-3.0% appreciation + 3.0% rent growth), your $42k cash investment doubles in ~10 years — after that, you're playing with house money.
Negotiation context
- It's been on market 36 days — a 3% lower offer ($145k) is reasonable based on typical stale-listing flexibility.
Risks & watch-outs
- Climate carrying-cost: major wildfire risk — expect insurance premiums to compound above CPI over the hold.
Questions for the listing agent
- It's been on market 36 days. Have you received any prior offers? Is the seller open to a 3% concession, seller financing, or rate buy-down credit?
- Is there a deadline driving the sale (1031 exchange, divorce, estate, relocation)? That informs how much negotiation room exists.
- Schools are B-rated — typically a magnet for longer-tenancy family renters. What's the average tenant stay here, and is there a school-zone premium baked into asking?
- Crime grade is D in this area — have there been break-ins, vandalism, or insurance claims at this property in the last 3 years? What carrier currently insures it and at what premium?
- What's the average days-on-market for RENTAL listings here right now (not sales)? A rising rental-DOM trend means longer vacancies and softer asking-rent achievability than the comps imply.
- What's the recent tenant-quality profile in this submarket — average credit score on applications, eviction rate, late-payment / NSF rate, and stable-employment percentage? A property-management company in the area should have these aggregated.
- How much new for-sale + rental construction is in the pipeline within 1–3 miles? Heavy new supply typically softens prices + rents 12–24 months out; constrained supply supports both.
Investment metrics
- 1% rule
- 1.21% ✓
- Cap rate
- 9.46%
- Cash-on-cash
- 11.30%
- DSCR
- 1.50
- GRM
- 6.9
CMA / ARV
No comps found within radius.
Projected returns pro-forma
-3.0% appreciation · 3.0% rent growth · sell at horizon
- IRR
- 0.6%
- Equity multiple
- 1.02×
- Total profit
- $911
- Equity at exit
- $22,351
- IRR
- 10.2%
- Equity multiple
- 1.79×
- Total profit
- $33,320
- Equity at exit
- $12,961
Cash invested: $41,972 (down + closing). Projections, not guarantees.
Landlord ↔ Tenant lean methodology
- Overall (STATE)
- 28 Tenant-Leaning
- State Washington
- 28 Tenant-Leaning · D+8
- County
- — inherits STATE
- City
- — inherits STATE
ZIP-level market 99027
- Home prices YoY
- -20.5%
- Active inventory
- 57
- Price-to-rent
- 6.9×
Monthly cashflow live
- Estimated rent
- $1,812 medium interval (Pro) →
- Mortgage (P&I)
- −$786
- Tax est. 1.5%
- −$187 /mo · $2,248/yr
- Insurance
- −$62
- HOA
- −$0
- Vacancy / Maint / Mgmt
- −$380
- Net cashflow
- $395
Break-even live
UW: 25.0% down · 7.5% · 30yr · 1.5% tax · 5.0% vac · 8.0% maint · 8.0% mgmt
Financing live
Cash to close
- Down payment
- $37,475
- Closing costs
- $4,497
- Reserves months
- —
- Total cash needed
- —
Loan-product check · same deal, 3 products live
Conventional
25% down · 7.5% · 30yr
- Down + closing
- —
- Monthly P&I
- —
- Monthly cashflow
- —
- DSCR
- —
- Eligible?
- —
Personal DTI + credit; lowest rate.
DSCR
20% down · 8.5% · 30yr
- Down + closing
- —
- Monthly P&I
- —
- Monthly cashflow
- —
- DSCR
- —
- Eligible?
- —
No personal income docs; deal must DSCR.
Hard money
10% down · 12.0% · 12mo
- Down + closing
- —
- Monthly P&I
- —
- Monthly cashflow
- —
- DSCR
- —
- Eligible?
- —
Short-term bridge; refi at stabilization.
Listing history 2 events
-
2026-05-01status Pending
-
2026-03-26$149,900 Active
ⓘ Source: listings_history table (triggers on properties + properties_extension) + one-shot
backfill from property_details.listing_events for pre-trigger history.
Climate risk First Street
- Flood 1/10 Low FEMA zone X (unshaded) · 0% chance over 30 yrs
- Wildfire 7/10 Severe
- Heat 3/10 Moderate 7 d/yr ≥93°F today · 15 d/yr by 30 yrs out
- Wind 1/10 Low
- Air quality 9/10 Extreme 15 unhealthy d/yr today · 17 by 30 yrs out
Nearby sold comps map
Loading sold comps map…
Walkable amenities ~0.75 mi
Loading nearby amenities…
Taxation est. · year 1
- Rental income
- $21,739
- − Mortgage interest
- −$8,397
- − Property taxes
- −$2,248
- − Insurance
- −$750
- − Repairs & maintenance
- −$1,739
- − Management
- −$1,739
- − Depreciation
- −$4,361
- Taxable income
- $2,506
- Est. tax owed @ 24.0%
- −$601
- After-tax cash flow
- $4,142/yr
For passive investors: Depreciation is non-cash, so a rental often shows a tax loss while cash-flowing — sheltering income. Rental losses are passive: they offset passive income freely, and up to $25,000/yr can offset ordinary (W-2) income if you actively participate and your MAGI is under $100k (phasing out to $0 by $150k); unused losses carry forward. On sale, claimed depreciation is recaptured at up to 25%, and gains may owe capital-gains tax (a 1031 exchange can defer both). Figures are a year-1 estimate at your 24.0% rate — not tax advice; consult a CPA.
Schools (NCES district)
- District
- East Valley School District (Spokane)
- NCES district ID
- 5302280
- Math proficiency
- 40% ▼ -5.00%
- Reading proficiency
- 56% ▼ -4.00%
- Median HH income
- $49,557
- Composite
- 43.15/100
- National rank
- #6603
- State rank
- #160 of 291 in WA
Livability — Spokane Valley
- Score
- 85/100
- State rank
- #31
- US rank
- #512
Category grades
Schools grade is shown separately in the Schools card above.
Census & demographics
- City population
- 129,511
- Population (ZIP)
- 5,878
Population outlook (Spokane County) Hauer SSP2
- Today (2025)
- 531,314 people
- By 2030
- 549,278 · +3.4%
- By 2040
- 577,822 · +8.8%
- By 2050
- 598,188 · +12.6%
- By 2075
- 630,744 · +18.7%
- By 2100
- 622,360 · +17.1%
Race, ethnicity, and origin ACS 2023
- Neighborhood character
- Predominantly White (93%)
- Race & ethnicity
- White 93% Two or more races 3% Hispanic / Latino 3%
- Common ancestry
- Slovak 6% Portuguese 3% Lithuanian 2%
- Foreign-born
- 2%
Political lean MEDSL · Spokane
- 2024 margin
- Toss-up / Even · D 46.0% · R 51.0% · Other 3.0%
- 2008→2024 swing
- -3.8pp toward R · 2008: -1.1pp · 2024: -5.0pp
- All cycles
- 2024: R+5.0 2020: R+4.3 2016: R+8.3 2012: R+6.3 2008: R+1.1
Not yet ingested
- Civics
- —
Market trends
- HPI YoY
- ▼ -92.71%
- Current HPI
- 360.3438
- Rent YoY
- —
- Metro
- —
- State GDP YoY
- ▲ 4.65%
- F500 in state
- 22
Industry mix (Fortune 500 HQ in WA)
| Industry | F500 HQs | Revenue |
|---|---|---|
| Retail | 2 | $269B |
|
||
| Technology / Retail | 1 | $638B |
|
||
| Technology | 1 | $245B |
|
||
| Telecommunications | 1 | $38B |
|
||
| Food / Beverage | 1 | $36B |
|
||
| Automotive / Trucks | 1 | $34B |
|
||
Price history
2 events — show timeline
- 2026-05-01 Pending — SPOKANEMLS as Distributed by MLS Grid
- 2026-03-26 Listed $149,900 SPOKANEMLS as Distributed by MLS Grid
Property tax history
+5.1%/yrLatest (2023): $60 · +17.2% YoY. Source: county tax records.
Cash-flow waterfall
monthlySold comps — $/sqft
last 12 mo · ≤1 miLoading sold comps…