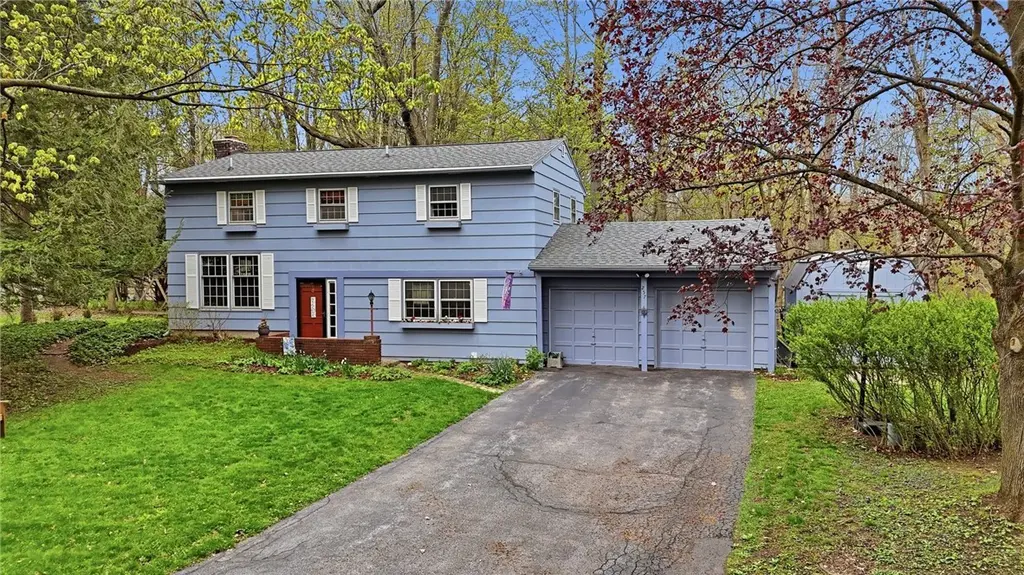
257 East St · Pittsford, NY
Flood risk 1/10 · Minimal
- FEMA flood zone
- X (unshaded)
- Chance of flooding over 30 yrs
- 0.0%
- Est. flood insurance / yr
- $473 – $860
Fire risk 2/10 · Minimal
- Est. fire insurance / yr
- $691 – $1,283
Heat risk 2/10 · Minimal
- Hot days now (above 95°F)
- 7 days/yr
- Hot days in 30 yrs
- 16 days/yr
Wind risk 1/10 · Minimal
- Chance of severe wind over 30 yrs
- —
Air-quality risk 2/10 · Minimal
- Unhealthy air days now
- 1 days/yr
- Unhealthy air days in 30 yrs
- 2 days/yr
Risk factors via First Street. Map © Google.
Why this score? — see what drove the D+ grade
The composite is a weighted blend of 9 inputs, each scored 0–100. Each bar is that input's sub-score; the figure is the points it added to the 100-point composite (weight × sub-score).
- ARV discount +15.0/15.0
- Cash flow +9.0/30.0
- Schools +7.5/10.0
- Livability +4.7/5.0
- 1% rule +3.6/10.0
- DSCR +2.5/10.0
- Rent growth +2.5/5.0
- Condition / age +2.5/5.0
- Appreciation +0.0/10.0
$339,900
🖨 Deal sheet 📄 Offer letter ✓ Due diligence
Listing remarks
Tucked at the end of a long, private driveway and surrounded by forever wild land, 257 East Street offers a rare sense of seclusion with breathtaking, treehouse-like views from nearly every room. This 4-bedroom, 2.5-bathroom home blends natural beauty with thoughtfully designed living spaces, creating a truly special retreat. A spacious foyer welcomes you inside, leading to an oversized living room with rich hardwood floors and a cozy wood burning fireplace—perfect for gathering and relaxing. The formal dining room offers an ideal setting for entertaining, while a charming nook just off the kitchen provides incredible flexibility as a home office, homework space, play area, or even fu
Key facts
- Formal dining room
- Four-season room
- Private driveway
Tags
Property features AI
Exterior
- Parking: Attached garage (2 spaces); Shared driveway
- Security: No specific security features listed
- Utilities: Electricity connected (circuit breakers); Public water connected; Sewer connected; High-speed internet available; Cable available
- Home design: Two-story home; Existing (previously built); Main thoroughfare frontage
- Construction: Wood siding; Asphalt roof; Block foundation
- Exterior features: Blacktop driveway; Play structure; Patio; Shed(s)/storage; See remarks
Interior
- Kitchen: Dishwasher; Electric oven; Electric range; Free-standing range; Oven; Refrigerator; Disposal
- Bedrooms: Bedrooms present (room-level details not provided)
- Flooring: Carpet; Hardwood; Luxury vinyl; Tile; Varies
- Bathrooms: Two full bathrooms; One half bathroom; One main-level bathroom
- Heating & cooling: Central air conditioning; Gas forced-air heating; Programmable thermostat
- Interior features: Den; Separate/formal dining room; Entrance foyer; Eat-in kitchen; Separate/formal living room; Home office; Kitchen/family room combo; Pantry; Sliding glass doors; Storage; Bath in primary bedroom; Programmable thermostat; Storm windows; Thermal windows; Sliding doors; Has fireplace (1)
- Laundry & utility: Washer; Dryer; Laundry located in basement
Neighborhood map
What this means for you Summary
Snapshot
- This is a 3-bed/2.5-bath single-family listed at $340k.
Deal economics
- At list price, monthly cash flow is $-266 ($-3k/yr) — negative.
- To cash-flow at today's rent, offer at most $293k (13.8% below list).
- To meet the 1% rule (rent ≥ 1% of price), the offer needs to be $292k (14.0% below list).
- Recommended offer: $292k (14.0% below list) — sets the bar for 1% rule.
- Cap rate 5.4% vs local median 2.5% in Pittsford — top-decile yield for the area; either an underpriced asset or a hidden risk that comps aren't pricing in. Stress-test before assuming the spread holds.
Location & tenants
- Location reads 94/100 on livability (#1 in NY, #10 nationally) — a professional / high-income tenant draw. Strengths: schools A+, crime A+, commute A+; Watch: cost of living D.
- Pittsford Central School District (suburban): math 80% / reading 84% proficiency, ranked #34 of 590 in NY (top 6%) — strong family-tenant draw, lease renewals of 3-5y typical; only 2% free/reduced lunch — higher-income household profile.
- Market conditions: 186 active listings in the ZIP; 3 comparable units currently listed for rent nearby; rentals at typical pace (median 24d on market — plan ~3-4 weeks tenant-placement turnaround); high-income renter base; 1,169 units permitted in Monroe County in 2024 (591 in 5+ unit buildings).
Forward outlook
- Local home prices are declining (-3.0%/yr); year-one equity from $2k of loan paydown is wiped out by about $10k of value loss. Plan a longer hold.
- Monroe County population projected to shrink 6% by 2050 — rents likely to lag national; underwrite the cash flow, not the appreciation.
Negotiation context
- Only 8 days on market — expect competitive offers; lowballing is unlikely to land.
- Current owner paid $125k; list at $340k implies a 172% gain — meaningful room to come down on a strong offer.
Questions for the listing agent
- What do current leases actually rent for vs. the listed asking? Can we see a recent rent roll and the last 12 months of T-12 income?
- Built in 1964 — when were the roof, HVAC, electrical panel, plumbing, and water heater last replaced?
- Is there a deadline driving the sale (1031 exchange, divorce, estate, relocation)? That informs how much negotiation room exists.
- Schools are A-rated — typically a magnet for longer-tenancy family renters. What's the average tenant stay here, and is there a school-zone premium baked into asking?
- The area grade is low — what's the realistic commute time and amenity access for the typical tenant pool here? Any planned neighborhood developments (good or bad) we should know about?
- What's the average days-on-market for RENTAL listings here right now (not sales)? A rising rental-DOM trend means longer vacancies and softer asking-rent achievability than the comps imply.
- What's the recent tenant-quality profile in this submarket — average credit score on applications, eviction rate, late-payment / NSF rate, and stable-employment percentage? A property-management company in the area should have these aggregated.
- How much new for-sale + rental construction is in the pipeline within 1–3 miles? Heavy new supply typically softens prices + rents 12–24 months out; constrained supply supports both.
Investment metrics
- 1% rule
- 0.86% ✗
- Cap rate
- 5.36%
- Cash-on-cash
- -3.35%
- DSCR
- 0.85
- GRM
- 9.7
CMA / ARV
- ARV (median comp)
- $460,675
- List price
- $339,900
- Delta
- -26.22%
- Verdict
- UNDERPRICED
- Comps
- 20 within 1.0 mi
Show comp detail 12 sales within ~0.75 mi
| Address | Dist | Beds/Ba | Sqft | Sold | Price | $/sf | Match |
|---|---|---|---|---|---|---|---|
| 288 East St | 0.16mi | 3/2.5 | 1,788 (-2%) | 7mo | $360,000 | $201 | 83 |
| 5 Sugarwood Dr | 0.42mi | 4/2.5 (+1) | 1,764 (-3%) | 2mo | $505,000 | $286 | 69 |
| 11 Laureldale Dr Dr | 0.21mi | 4/2.5 (+1) | 1,724 (-6%) | 10mo | $438,000 | $254 | 68 |
| 308 Thornell Rd | 0.38mi | 4/2.5 (+1) | 1,764 (-3%) | 9mo | $365,000 | $207 | 64 |
| 343 East St | 0.39mi | 4/2.0 (+1) | 1,936 (+6%) | 6mo | $435,000 | $225 | 59 |
| 67 Stuyvesant Rd | 0.62mi | 4/2.5 (+1) | 1,825 (+0%) | 10mo | $532,210 | $292 | 57 |
| 396 East St | 0.65mi | 4/2.5 (+1) | 1,824 (0%) | 11mo | $310,000 | $170 | 56 |
| 19 Sand Brook Rd | 0.45mi | 4/2.5 (+1) | 1,976 (+8%) | 10mo | $460,000 | $233 | 52 |
| 20 Round Trail Dr | 0.75mi | 4/2.0 (+1) | 1,872 (+3%) | 7mo | $375,000 | $200 | 48 |
| 2 Burr Oak Dr | 0.56mi | 4/2.5 (+1) | 2,040 (+12%) | 10mo | $518,000 | $254 | 40 |
| 19 Musket Ln | 0.64mi | 3/2.5 | 1,580 (-13%) | 11mo | $468,000 | $296 | 39 |
| 29 Rosewood Dr | 0.54mi | 4/1.5 (+1) | 2,069 (+13%) | 7mo | $484,000 | $234 | 38 |
Match score weights: distance 35% · size 25% · config 20% · recency 20%. Top-matched comps best support the ARV.
Projected returns pro-forma
-3.0% appreciation · 3.0% rent growth · sell at horizon
- IRR
- -21.8%
- Equity multiple
- 0.25×
- Total profit
- $-71,813
- Equity at exit
- $50,680
- IRR
- -15.5%
- Equity multiple
- 0.12×
- Total profit
- $-83,574
- Equity at exit
- $29,388
Cash invested: $95,172 (down + closing). Projections, not guarantees.
Landlord ↔ Tenant lean methodology
- Overall (STATE)
- 15 Strongly Tenant-Friendly
- State New York
- 15 Strongly Tenant-Friendly · D+10
- County
- — inherits STATE
- City
- — inherits STATE
ZIP-level market 14534
- Active inventory
- 186
- Price-to-rent
- 9.7×
Monthly cashflow live
- Estimated rent
- $2,923 medium interval (Pro) →
- Mortgage (P&I)
- −$1,782
- Tax from tax record
- −$651 /mo · $7,810/yr
- Insurance
- −$142
- HOA
- −$0
- Vacancy / Maint / Mgmt
- −$614
- Net cashflow
- $-266
Break-even live
UW: 25.0% down · 7.5% · 30yr · 1.5% tax · 5.0% vac · 8.0% maint · 8.0% mgmt
Financing live
Cash to close
- Down payment
- $84,975
- Closing costs
- $10,197
- Reserves months
- —
- Total cash needed
- —
Loan-product check · same deal, 3 products live
Conventional
25% down · 7.5% · 30yr
- Down + closing
- —
- Monthly P&I
- —
- Monthly cashflow
- —
- DSCR
- —
- Eligible?
- —
Personal DTI + credit; lowest rate.
DSCR
20% down · 8.5% · 30yr
- Down + closing
- —
- Monthly P&I
- —
- Monthly cashflow
- —
- DSCR
- —
- Eligible?
- —
No personal income docs; deal must DSCR.
Hard money
10% down · 12.0% · 12mo
- Down + closing
- —
- Monthly P&I
- —
- Monthly cashflow
- —
- DSCR
- —
- Eligible?
- —
Short-term bridge; refi at stabilization.
Rent comps 3 comps
| Address | Beds | Baths | Sqft | Rent | $/sqft | DOM | Units | Dist |
|---|---|---|---|---|---|---|---|---|
| 23 Musket Ln Unit NA Pittsford, NY | 4.0 | 2.5 | 2058 | $2,900 | $1.41 | 23d | 1 | 0.66mi |
| 1474 Marsh Rd Pittsford, NY | 2.0 | 1.5 | 1450 | $2,995 | $2.07 | 19d | 1 | 1.15mi |
| 6 Cullens Run Pittsford, NY | 4.0 | 2.0 | 1300 | $3,000 | $2.31 | 44d | 1 | 1.37mi |
Listing history 3 events
-
2026-05-14status Pending 2006-char remark
-
2026-05-06$339,900 Active 2006-char remark
-
1996-04-26soldstatus $125,000
ⓘ Source: listings_history table (triggers on properties + properties_extension) + one-shot
backfill from property_details.listing_events for pre-trigger history.
Tax reassessment forecast NY · Partial reset (capped growth)
- Current annual tax
- $7,810 · $651/mo
- Projected year-2 tax
- $7,810 · $651/mo
- Expected delta
- $0/yr ($0/mo · -0.0%)
ⓘ Screening estimate from a state-policy table — verify with the county assessor before closing.
Climate risk First Street
- Flood 1/10 Low FEMA zone X (unshaded) · 0% chance over 30 yrs
- Wildfire 2/10 Low
- Heat 2/10 Low 7 d/yr ≥95°F today · 16 d/yr by 30 yrs out
- Wind 1/10 Low
- Air quality 2/10 Low 1 unhealthy d/yr today · 2 by 30 yrs out
Nearby sold comps map
Loading sold comps map…
Walkable amenities ~0.75 mi
Loading nearby amenities…
Taxation est. · year 1
- Rental income
- $35,078
- − Mortgage interest
- −$19,040
- − Property taxes
- −$7,810
- − Insurance
- −$1,700
- − Repairs & maintenance
- −$2,806
- − Management
- −$2,806
- − Depreciation
- −$9,888
- Taxable loss
- −$8,972
- Est. tax savings @ 24.0%
- +$2,153
- After-tax cash flow
- $-1,034/yr
For passive investors: Depreciation is non-cash, so a rental often shows a tax loss while cash-flowing — sheltering income. Rental losses are passive: they offset passive income freely, and up to $25,000/yr can offset ordinary (W-2) income if you actively participate and your MAGI is under $100k (phasing out to $0 by $150k); unused losses carry forward. On sale, claimed depreciation is recaptured at up to 25%, and gains may owe capital-gains tax (a 1031 exchange can defer both). Figures are a year-1 estimate at your 24.0% rate — not tax advice; consult a CPA.
Schools (NCES district)
- District
- Pittsford Central School District
- NCES district ID
- 3623160
- Math proficiency
- 80% ▼ -4.00%
- Reading proficiency
- 84% ▲ 7.00%
- Median HH income
- $106,940
- Composite
- 74.75/100
- National rank
- #151
- State rank
- #34 of 590 in NY
Livability — Pittsford
- Score
- 94/100
- State rank
- #1
- US rank
- #10
Category grades
Schools grade is shown separately in the Schools card above.
Census & demographics
- County
- Monroe County · 674,131 people
- City population
- 33,230
- Metro
- Rochester, NY
- Population (ZIP)
- 33,230
- Household income
- $143,694
- Rent vs Own
- Severe rent burden
- 398.0
Population outlook (Monroe County) Hauer SSP2
- Today (2025)
- 759,460 people
- By 2030
- 757,154 · -0.3%
- By 2040
- 740,644 · -2.5%
- By 2050
- 714,443 · -5.9%
- By 2075
- 645,883 · -15.0%
- By 2100
- 547,084 · -28.0%
Race, ethnicity, and origin ACS 2023
- Neighborhood character
- Predominantly White (81%)
- Race & ethnicity
- White 81% Asian 8% Two or more races 6% Hispanic / Latino 4% Black 2%
- Common ancestry
- Romanian 5% Italian 4% Lithuanian 3%
- Foreign-born
- 12% · Canada, China, South Korea
- Languages at home
- 87% English-only · Other Indo-European 3% Chinese 2% Spanish 2%
Political lean MEDSL · Monroe
- 2024 margin
- D (+19.1) · D 59.5% · R 40.5%
- 2008→2024 swing
- +1.4pp toward D · 2008: 17.7pp · 2024: 19.1pp
- All cycles
- 2024: D+19.1 2020: D+21.0 2016: D+14.1 2012: D+17.4 2008: D+17.7
Not yet ingested
- Civics
- —
Market trends
- HPI YoY
- ▼ -232.40%
- Current HPI
- 258.0726
- Rent YoY
- —
- Metro
- Rochester, NY
- State GDP YoY
- ▲ 2.60%
- F500 in state
- 92
Industry mix (Fortune 500 HQ in NY)
| Industry | F500 HQs | Revenue |
|---|---|---|
| Financial Services | 10 | $950B |
|
||
| Consumer Goods | 9 | $162B |
|
||
| Insurance | 4 | $225B |
|
||
| Telecommunications | 2 | $144B |
|
||
| Pharmaceuticals | 2 | $112B |
|
||
| Media / Entertainment | 2 | $69B |
|
||
Price history
+171.9% since first listed3 events — show timeline
- 2026-05-14 Pending — UNYREIS
- 2026-05-06 Listed $339,900 UNYREIS
- 1996-04-26 Sold (Public Records) $125,000 Public Records
Property tax history
+2.7%/yrLatest (2025): $7,810 · +14.3% YoY. Source: county tax records.
Cash-flow waterfall
monthlySold comps — $/sqft
last 12 mo · ≤1 miLoading sold comps…