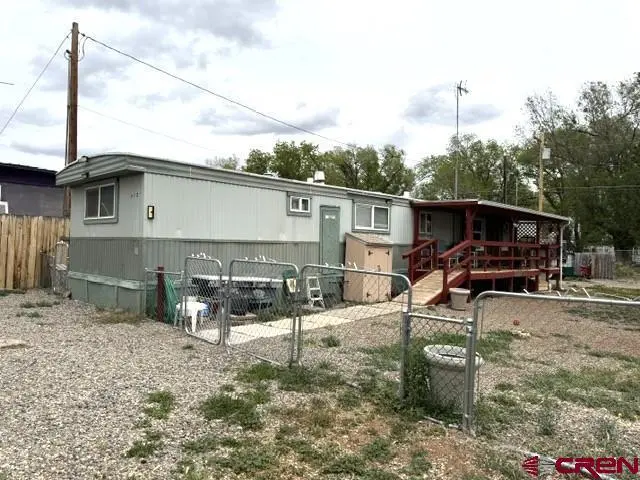
612 S Ash St · Cortez, CO
Flood risk 1/10 · Minimal
- FEMA flood zone
- X (unshaded)
- Chance of flooding over 30 yrs
- 0.0%
- Est. flood insurance / yr
- $507 – $1,088
Fire risk 6/10 · Moderate
- Est. fire insurance / yr
- $939 – $1,743
Heat risk 3/10 · Minor
- Hot days now (above 91°F)
- 7 days/yr
- Hot days in 30 yrs
- 18 days/yr
Wind risk 1/10 · Minimal
- Chance of severe wind over 30 yrs
- —
Air-quality risk 1/10 · Minimal
- Unhealthy air days now
- 0 days/yr
- Unhealthy air days in 30 yrs
- 0 days/yr
Risk factors via First Street. Map © Google.
Why this score? — see what drove the C- grade
The composite is a weighted blend of 9 inputs, each scored 0–100. Each bar is that input's sub-score; the figure is the points it added to the 100-point composite (weight × sub-score).
- Cash flow +20.4/30.0
- ARV discount +7.5/15.0
- DSCR +6.5/10.0
- 1% rule +5.4/10.0
- Livability +3.4/5.0
- Rent growth +2.5/5.0
- Condition / age +2.5/5.0
- Schools +2.1/10.0
- Appreciation +0.0/10.0
$165,000
🖨 Deal sheet 📄 Offer letter ✓ Due diligence
Listing remarks
Manufactured 816 sf. , Home with three bedrooms and two baths. Front and back covered porch, fenced yard, front and back-alley entrance. Lots of parking in front area before the fencing. Location is close to Wall Mart, General Shopping, Schools, Churches and Restaurant's.
Key facts
- 7,100 sq ft lot
- Built 1973
- Listed 42 days
Property features AI
Finance
- Financial info: Pets allowed: owner only
Exterior
- Parking: Paved road access
- Utilities: Electricity available; Propane; Public water; Public sewer; Cellular phone reception
- Home design: Single-wide mobile home; Single-story; Not a permanent foundation
- Construction: Aluminum siding; Modular/prefab construction; Not permanent foundation
- Exterior features: Covered porch; Deck; Shed(s); Leased propane tank; Chain link fence in front and backyard
Interior
- Kitchen: Oven; Range; Refrigerator
- Bedrooms: Primary bedroom on the main level
- Flooring: Linoleum; Partially carpeted
- Bathrooms: 1 full bathroom; 1 half bathroom
- Heating & cooling: Propane heating
- Interior features: Eat-in kitchen; Main-level primary bedroom; Unfurnished
- Laundry & utility: Washer hookup
Neighborhood map
What this means for you Summary
Snapshot
- This is a 3-bed/1.5-bath manufactured listed at $165k.
Deal economics
- At list price, monthly cash flow is $214 ($3k/yr) — positive.
- The deal already cash-flows at list — no discount required.
- Meets the 1% rule at list price ($2k rent vs $165k).
- Recommended offer: $160k (3.0% below list) — sets the bar for market timing.
- Cap rate 7.8% vs local median 3.3% in Cortez — top-decile yield for the area; either an underpriced asset or a hidden risk that comps aren't pricing in. Stress-test before assuming the spread holds.
Location & tenants
- Location reads 67/100 on livability (#125 in CO) — a middle-class / working-renter tenant base. Strengths: cost of living A+, health & safety A+, housing A; Watch: schools D-, crime F, amenities F.
- Montezuma-Cortez School District No. Re-1 (town): math 16% / reading 33% proficiency, ranked #70 of 86 in CO (top 81%) — low school quality limits family demand, transient renter base, plan for 1-2y turnover.
- Market conditions: 223 active listings in the ZIP; 3 comparable units currently listed for rent nearby; rentals leasing fast (median 3d on market — plan ~1-2 weeks tenant-placement turnaround); 24 units permitted in Montezuma County in 2024 (0 in 5+ unit buildings).
- This rent runs 35% of the median local income ($60k/yr) — at the standard rent-burdened threshold; future hikes will face affordability resistance.
Forward outlook
- Local home prices are declining (-3.0%/yr); year-one equity from $1k of loan paydown is wiped out by about $5k of value loss. Plan a longer hold.
Negotiation context
- It's been on market 42 days — a 3% lower offer ($160k) is reasonable based on typical stale-listing flexibility.
- 5 sale attempts since 11y ago with the ask held roughly flat each time — persistent listings suggest the price (not the market) is what's stuck; bring a comps-based counter.
- Current owner paid $39k; list at $165k implies a 323% gain — meaningful room to come down on a strong offer.
Risks & watch-outs
- Climate carrying-cost: major wildfire risk — expect insurance premiums to compound above CPI over the hold.
Questions for the listing agent
- It's been on market 42 days. Have you received any prior offers? Is the seller open to a 3% concession, seller financing, or rate buy-down credit?
- Built in 1973 — when were the roof, HVAC, electrical panel, plumbing, and water heater last replaced?
- Is there a deadline driving the sale (1031 exchange, divorce, estate, relocation)? That informs how much negotiation room exists.
- Schools are D-rated, which usually means shorter tenancies and higher turnover. Who's the typical renter profile here, and what's been the actual vacancy rate?
- Crime grade is F in this area — have there been break-ins, vandalism, or insurance claims at this property in the last 3 years? What carrier currently insures it and at what premium?
- What's the average days-on-market for RENTAL listings here right now (not sales)? A rising rental-DOM trend means longer vacancies and softer asking-rent achievability than the comps imply.
- What's the recent tenant-quality profile in this submarket — average credit score on applications, eviction rate, late-payment / NSF rate, and stable-employment percentage? A property-management company in the area should have these aggregated.
- How much new for-sale + rental construction is in the pipeline within 1–3 miles? Heavy new supply typically softens prices + rents 12–24 months out; constrained supply supports both.
Investment metrics
- 1% rule
- 1.04% ✓
- Cap rate
- 7.85%
- Cash-on-cash
- 5.55%
- DSCR
- 1.25
- GRM
- 8.0
CMA / ARV
No comps found within radius.
Projected returns pro-forma
-3.0% appreciation · 3.0% rent growth · sell at horizon
- IRR
- -7.7%
- Equity multiple
- 0.72×
- Total profit
- $-13,102
- Equity at exit
- $24,602
- IRR
- 1.9%
- Equity multiple
- 1.13×
- Total profit
- $6,220
- Equity at exit
- $14,266
Cash invested: $46,200 (down + closing). Projections, not guarantees.
Landlord ↔ Tenant lean methodology
- Overall (STATE)
- 38 Tenant-Leaning
- State Colorado
- 38 Tenant-Leaning · D+4
- County
- — inherits STATE
- City
- — inherits STATE
ZIP-level market 81321
- Active inventory
- 223
- Price-to-rent
- 8.0×
Monthly cashflow live
- Estimated rent
- $1,714 medium interval (Pro) →
- Mortgage (P&I)
- −$865
- Tax est. 1.5%
- −$206 /mo · $2,475/yr
- Insurance
- −$69
- HOA
- −$0
- Vacancy / Maint / Mgmt
- −$360
- Net cashflow
- $214
Break-even live
UW: 25.0% down · 7.5% · 30yr · 1.5% tax · 5.0% vac · 8.0% maint · 8.0% mgmt
Financing live
Cash to close
- Down payment
- $41,250
- Closing costs
- $4,950
- Reserves months
- —
- Total cash needed
- —
Loan-product check · same deal, 3 products live
Conventional
25% down · 7.5% · 30yr
- Down + closing
- —
- Monthly P&I
- —
- Monthly cashflow
- —
- DSCR
- —
- Eligible?
- —
Personal DTI + credit; lowest rate.
DSCR
20% down · 8.5% · 30yr
- Down + closing
- —
- Monthly P&I
- —
- Monthly cashflow
- —
- DSCR
- —
- Eligible?
- —
No personal income docs; deal must DSCR.
Hard money
10% down · 12.0% · 12mo
- Down + closing
- —
- Monthly P&I
- —
- Monthly cashflow
- —
- DSCR
- —
- Eligible?
- —
Short-term bridge; refi at stabilization.
Rent comps 3 comps
| Address | Beds | Baths | Sqft | Rent | $/sqft | DOM | Units | Dist |
|---|---|---|---|---|---|---|---|---|
| 446 S Linden St Cortez, CO | 2.0 | 1.0 | 1040 | $1,700 | $1.63 | 2d | 1 | 0.39mi |
| 469 W 2nd St Unit 2 Cortez, CO | 2.0 | 1.0 | 580 | $1,600 | $2.76 | 2d | 1 | 0.61mi |
| 417 S Cedar St Cortez, CO | 2.0 | 1.0 | 760 | $1,350 | $1.78 | 23d | 1 | 0.69mi |
Listing history 25 events
-
2026-06-18days on market $165,000 Active 42 DOM
-
2026-06-17days on market $165,000 Active 41 DOM
-
2026-06-16days on market $165,000 Active 40 DOM
-
2026-06-15days on market $165,000 Active 39 DOM
-
2026-06-14days on market $165,000 Active 37 DOM
-
2026-06-10days on market $165,000 Active 34 DOM
-
2026-06-09days on market $165,000 Active 33 DOM
-
2026-06-08days on market $165,000 Active 32 DOM
-
2026-06-07days on market $165,000 Active 31 DOM
-
2026-06-05days on market $165,000 Active 28 DOM
-
2026-06-03days on market $165,000 Active 27 DOM
-
2026-06-02days on market $165,000 Active 26 DOM
-
2026-06-01days on market $165,000 Active 25 DOM
-
2026-05-31days on market $165,000 Active 24 DOM
-
2026-05-31days on market $165,000 Active 23 DOM
-
2026-05-06$165,000 Active
-
2024-09-17historical
-
2024-07-03price $172,000
-
2024-06-21$175,000 Active
-
2018-10-03historical
-
2018-08-07$67,500
-
2018-02-06soldstatus $39,000
-
2017-12-29$42,000
-
2017-01-01historical
-
2015-12-14$49,500
ⓘ Source: listings_history table (triggers on properties + properties_extension) + one-shot
backfill from property_details.listing_events for pre-trigger history.
Climate risk First Street
- Flood 1/10 Low FEMA zone X (unshaded) · 0% chance over 30 yrs
- Wildfire 6/10 Major
- Heat 3/10 Moderate 7 d/yr ≥91°F today · 18 d/yr by 30 yrs out
- Wind 1/10 Low
- Air quality 1/10 Low 0 unhealthy d/yr today · 0 by 30 yrs out
Nearby sold comps map
Loading sold comps map…
Walkable amenities ~0.75 mi
Loading nearby amenities…
Taxation est. · year 1
- Rental income
- $20,566
- − Mortgage interest
- −$9,243
- − Property taxes
- −$2,475
- − Insurance
- −$825
- − Repairs & maintenance
- −$1,645
- − Management
- −$1,645
- − Depreciation
- −$4,800
- Taxable loss
- −$67
- Est. tax savings @ 24.0%
- +$16
- After-tax cash flow
- $2,580/yr
For passive investors: Depreciation is non-cash, so a rental often shows a tax loss while cash-flowing — sheltering income. Rental losses are passive: they offset passive income freely, and up to $25,000/yr can offset ordinary (W-2) income if you actively participate and your MAGI is under $100k (phasing out to $0 by $150k); unused losses carry forward. On sale, claimed depreciation is recaptured at up to 25%, and gains may owe capital-gains tax (a 1031 exchange can defer both). Figures are a year-1 estimate at your 24.0% rate — not tax advice; consult a CPA.
Schools (NCES district)
- District
- Montezuma-Cortez School District No. Re-1
- NCES district ID
- 0803090
- Math proficiency
- 16% ▼ -2.00%
- Reading proficiency
- 33% ▼ -1.00%
- Median HH income
- $42,394
- Composite
- 20.85/100
- National rank
- #8499
- State rank
- #70 of 86 in CO
Livability — Cortez
- Score
- 67/100
- State rank
- #125
- US rank
- #10641
Category grades
Schools grade is shown separately in the Schools card above.
Census & demographics
- Census place
- Cortez, CO
- County
- Montezuma County · 18,723 people
- City population
- 14,236
- Metro
- nan
- Population (ZIP)
- 14,236
- Household income
- $59,506
- Rent vs Own
- Severe rent burden
- 403.0
Population outlook (Montezuma County) Hauer SSP2
- Today (2025)
- 26,943 people
- By 2030
- 27,208 · +1.0%
- By 2040
- 27,372 · +1.6%
- By 2050
- 27,180 · +0.9%
- By 2075
- 26,493 · -1.7%
- By 2100
- 23,364 · -13.3%
Race, ethnicity, and origin ACS 2023
- Neighborhood character
- Predominantly White (69%)
- Race & ethnicity
- White 69% Hispanic / Latino 15% Two or more races 10% Native American 9% Asian 1% Black 1%
- Hispanic origin (detail)
- Mexican 9%
- Common ancestry
- Slovak 3% Iranian 3% Italian 2%
- Foreign-born
- 4% · Canada, China
- Languages at home
- 87% English-only · Spanish 6% Chinese 1% Russian/Polish/Slavic 1%
Political lean MEDSL · Montezuma
- 2024 margin
- Strong R (+21.0) · D 38.3% · R 59.3% · Other 2.5%
- 2008→2024 swing
- -1.6pp toward R · 2008: -19.4pp · 2024: -21.0pp
- All cycles
- 2024: R+21.0 2020: R+22.4 2016: R+30.3 2012: R+23.6 2008: R+19.4
Not yet ingested
- Civics
- —
Market trends
- HPI YoY
- ▼ -274.25%
- Current HPI
- 264.2281
- Rent YoY
- —
- Metro
- nan
- State GDP YoY
- ▲ 1.95%
- F500 in state
- 14
Industry mix (Fortune 500 HQ in CO)
| Industry | F500 HQs | Revenue |
|---|---|---|
| Technology Distribution | 1 | $31B |
|
||
| Food / Agriculture | 1 | $18B |
|
||
| Packaging | 1 | $14B |
|
||
| Healthcare | 1 | $13B |
|
||
| Energy | 1 | $10B |
|
||
| Technology | 1 | $4B |
|
||
Price history
+233.3% since first listed10 events — show timeline
- 2026-05-06 Listed $165,000 cren
- 2024-09-17 Listing Removed — cren
- 2024-07-03 Price Changed $172,000 cren
- 2024-06-21 Listed $175,000 cren
- 2018-10-03 Listing Removed — cren
- 2018-08-07 Listed $67,500 cren
- 2018-02-06 Sold (MLS) $39,000 cren
- 2017-12-29 Listed $42,000 cren
- 2017-01-01 Listing Removed — cren
- 2015-12-14 Listed $49,500 cren
Property tax history
-11.9%/yrLatest (2021): $15 · -49.0% YoY. Source: county tax records.
Cash-flow waterfall
monthlySold comps — $/sqft
last 12 mo · ≤1 miLoading sold comps…