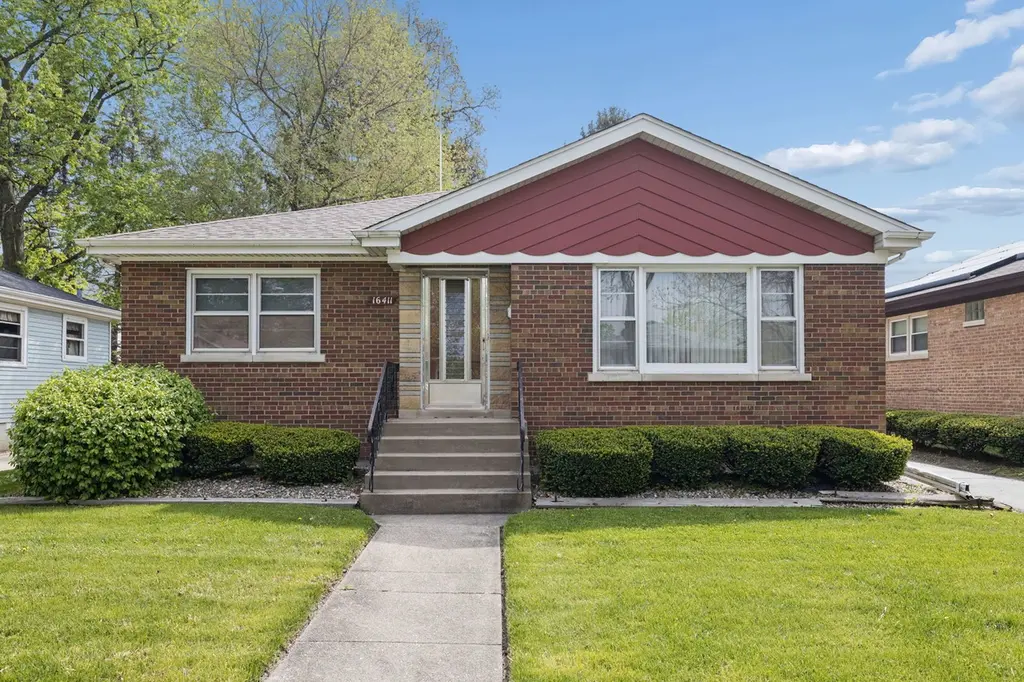
16411 Evans Ave · South Holland, IL
Flood risk 1/10 · Minimal
- FEMA flood zone
- X (unshaded)
- Chance of flooding over 30 yrs
- 0.0%
- Est. flood insurance / yr
- $473 – $860
Fire risk 1/10 · Minimal
- Est. fire insurance / yr
- $804 – $1,492
Heat risk 3/10 · Minor
- Hot days now (above 102°F)
- 7 days/yr
- Hot days in 30 yrs
- 15 days/yr
Wind risk 2/10 · Minimal
- Chance of severe wind over 30 yrs
- —
Air-quality risk 4/10 · Minor
- Unhealthy air days now
- 4 days/yr
- Unhealthy air days in 30 yrs
- 5 days/yr
Risk factors via First Street. Map © Google.
Why this score? — see what drove the B grade
The composite is a weighted blend of 9 inputs, each scored 0–100. Each bar is that input's sub-score; the figure is the points it added to the 100-point composite (weight × sub-score).
- Cash flow +30.0/30.0
- ARV discount +15.0/15.0
- 1% rule +10.0/10.0
- DSCR +10.0/10.0
- Livability +3.9/5.0
- Rent growth +2.5/5.0
- Condition / age +2.5/5.0
- Schools +0.7/10.0
- Appreciation +0.0/10.0
$159,900
🖨 Deal sheet 📄 Offer letter ✓ Due diligence
Listing remarks
First Time on the Market with this Family Estate Property - Opportunity Abounds in this 3 Bed All-Brick Ranch with Full-Basement on Oversized Lot tucked neatly into the heart of South Holland surrounded by homes with pride of ownership. A Traditional Floorplan, Real Hardwood Floors, a very recent Professionally Updated Bath, Great Condition Roof, Side-Drive, and the Full-Basement make this one perfect for a Rehab that won't break the bank. Being sold strictly AS-IS, the buyer will be responsible for any and all repairs. Contact your agent NOW to schedule a private tour!
Key facts
- All-brick ranch
- Side-drive
- Oversized lot
Tags
Property features AI
Finance
- Other: Property assessed using assessor's living area source; Property possession at closing
- HOA & community: No master association fee required
Exterior
- Parking: Detached garage with garage door opener (2 garage spaces, 2 total parking spaces)
- Utilities: Water from Lake Michigan/public supply; Public sewer
- Home design: Detached single-family home; One-story layout; Fee simple ownership; Built more than 60 years ago; Contains components built before 1978
- Construction: Brick construction
- Exterior features: Lot dimensions approximately 52 x 165 x 52 x 165; Lot under 0.25 acre
Interior
- Kitchen: Kitchen (18 x 10)
- Bedrooms: Three bedrooms (all on main level); Bedroom 2: 11 x 10, hardwood floors; Bedroom 3: 12 x 9, hardwood floors; Master bedroom: 10 x 12, hardwood floors
- Flooring: Hardwood floors in living room and bedrooms
- Bathrooms: One full bathroom
- Heating & cooling: Natural gas forced air heating; Central air conditioning
- Interior features: Partially finished full basement; Five total rooms
- Laundry & utility: Basement laundry room (10 x 13); Storage room in basement (9 x 21)
Neighborhood map
What this means for you Summary
Snapshot
- This is a 3-bed/1.0-bath single-family listed at $160k.
Deal economics
- At list price, monthly cash flow is $1k ($16k/yr) — positive.
- The deal already cash-flows at list — no discount required.
- Meets the 1% rule at list price ($3k rent vs $160k).
- Cap rate 16.5% vs local median 8.4% in South Holland — top-decile yield for the area; either an underpriced asset or a hidden risk that comps aren't pricing in. Stress-test before assuming the spread holds.
Location & tenants
- Location reads 77/100 on livability (#167 in IL, #3,071 nationally) — a middle-class / working-renter tenant base. Strengths: commute A+, housing A+, cost of living A; Watch: crime C-, amenities C-, schools D+.
- Thornton Twp Hsd 205 (suburban): math 7% / reading 8% proficiency, ranked #594 of 620 in IL (top 96%) — low school quality limits family demand, transient renter base, plan for 1-2y turnover.
- Market conditions: 135 active listings in the ZIP; 5 comparable units currently listed for rent nearby; rentals leasing fast (median 8d on market — plan ~1-2 weeks tenant-placement turnaround); 6,272 units permitted in Cook County in 2024 (4,658 in 5+ unit buildings).
Forward outlook
- Local home prices are declining (-3.0%/yr); year-one equity from $1k of loan paydown is wiped out by about $5k of value loss. Plan a longer hold.
- At projected returns (-3.0% appreciation + 3.0% rent growth), your $45k cash investment doubles in ~4 years — after that, you're playing with house money.
Negotiation context
- Only 5 days on market — expect competitive offers; lowballing is unlikely to land.
Risks & watch-outs
- Watch-outs: built in 1956 — expect roof / HVAC / electrical / plumbing capex.
Questions for the listing agent
- Built in 1956 — when were the roof, HVAC, electrical panel, plumbing, and water heater last replaced?
- Is there a deadline driving the sale (1031 exchange, divorce, estate, relocation)? That informs how much negotiation room exists.
- Schools are D-rated, which usually means shorter tenancies and higher turnover. Who's the typical renter profile here, and what's been the actual vacancy rate?
- What's the average days-on-market for RENTAL listings here right now (not sales)? A rising rental-DOM trend means longer vacancies and softer asking-rent achievability than the comps imply.
- What's the recent tenant-quality profile in this submarket — average credit score on applications, eviction rate, late-payment / NSF rate, and stable-employment percentage? A property-management company in the area should have these aggregated.
- How much new for-sale + rental construction is in the pipeline within 1–3 miles? Heavy new supply typically softens prices + rents 12–24 months out; constrained supply supports both.
Investment metrics
- 1% rule
- 1.95% ✓
- Cap rate
- 16.48%
- Cash-on-cash
- 36.38%
- DSCR
- 2.62
- GRM
- 4.3
CMA / ARV
- ARV (on-the-fly)
- $210,546
- Comps found
- 12
Show comp detail 12 sales within ~0.75 mi
| Address | Dist | Beds/Ba | Sqft | Sold | Price | $/sf | Match |
|---|---|---|---|---|---|---|---|
| 823 E 163rd St | 0.23mi | 3/1.0 | 1,184 (+6%) | 1mo | $197,500 | $167 | 78 |
| 16645 Cottage Grove Ave | 0.36mi | 3/2.0 | 1,120 (+0%) | 1mo | $211,894 | $189 | 77 |
| 16417 Claire Ln | 0.16mi | 3/2.5 | 1,209 (+8%) | 2mo | $254,995 | $211 | 71 |
| 16728 School St | 0.41mi | 3/1.5 | 1,170 (+5%) | 2mo | $196,000 | $168 | 69 |
| 16550 Elm Ct | 0.37mi | 4/2.5 (+1) | 1,144 (+3%) | 4mo | $252,000 | $220 | 64 |
| 944 E 163rd Pl | 0.37mi | 3/2.0 | 1,205 (+8%) | 2mo | $201,000 | $167 | 63 |
| 535 E 166th Pl | 0.35mi | 2/1.5 (-1) | 1,200 (+8%) | 2mo | $156,500 | $130 | 62 |
| 811 E 169th Pl | 0.65mi | 3/2.0 | 1,123 (+1%) | 3mo | $257,000 | $229 | 62 |
| 1006 E 163rd St | 0.42mi | 3/2.0 | 1,263 (+13%) | 1mo | $262,500 | $208 | 53 |
| 15944 School St | 0.54mi | 2/1.0 (-1) | 1,008 (-10%) | 4mo | $175,000 | $174 | 50 |
| 16914 Parkside Ave | 0.64mi | 4/2.0 (+1) | 1,187 (+7%) | 3mo | $224,700 | $189 | 48 |
| 16428 Greenwood Ave | 0.48mi | 4/2.0 (+1) | 1,260 (+13%) | 3mo | $215,000 | $171 | 44 |
Match score weights: distance 35% · size 25% · config 20% · recency 20%. Top-matched comps best support the ARV.
Projected returns pro-forma
-3.0% appreciation · 3.0% rent growth · sell at horizon
- IRR
- 32.2%
- Equity multiple
- 2.35×
- Total profit
- $60,586
- Equity at exit
- $23,842
- IRR
- 39.2%
- Equity multiple
- 4.67×
- Total profit
- $164,266
- Equity at exit
- $13,825
Cash invested: $44,772 (down + closing). Projections, not guarantees.
Landlord ↔ Tenant lean methodology
- Overall (STATE)
- 43 Moderately Tenant-Leaning
- State Illinois
- 43 Moderately Tenant-Leaning · D+7
- County
- — inherits STATE
- City
- — inherits STATE
ZIP-level market 60473
- Active inventory
- 135
- Price-to-rent
- 4.3×
Monthly cashflow live
- Estimated rent
- $3,117 high interval (Pro) →
- Mortgage (P&I)
- −$839
- Tax est. 1.5%
- −$200 /mo · $2,398/yr
- Insurance
- −$67
- HOA
- −$0
- Vacancy / Maint / Mgmt
- −$655
- Net cashflow
- $1,357
Break-even live
UW: 25.0% down · 7.5% · 30yr · 1.5% tax · 5.0% vac · 8.0% maint · 8.0% mgmt
Financing live
Cash to close
- Down payment
- $39,975
- Closing costs
- $4,797
- Reserves months
- —
- Total cash needed
- —
Loan-product check · same deal, 3 products live
Conventional
25% down · 7.5% · 30yr
- Down + closing
- —
- Monthly P&I
- —
- Monthly cashflow
- —
- DSCR
- —
- Eligible?
- —
Personal DTI + credit; lowest rate.
DSCR
20% down · 8.5% · 30yr
- Down + closing
- —
- Monthly P&I
- —
- Monthly cashflow
- —
- DSCR
- —
- Eligible?
- —
No personal income docs; deal must DSCR.
Hard money
10% down · 12.0% · 12mo
- Down + closing
- —
- Monthly P&I
- —
- Monthly cashflow
- —
- DSCR
- —
- Eligible?
- —
Short-term bridge; refi at stabilization.
Rent comps 5 comps
| Address | Beds | Baths | Sqft | Rent | $/sqft | DOM | Units | Dist |
|---|---|---|---|---|---|---|---|---|
| 16246 Dobson Ave South Holland, IL | 3.0 | 2.0 | 1250 | $3,170 | $2.54 | 2d | 1 | 0.48mi |
| 16001 Avalon Ave South Holland, IL | 3.0 | 2.0 | 1136 | $3,330 | $2.93 | 6d | 1 | 0.90mi |
| 15509 Park Ln South Holland, IL | 4.0 | 1.5 | 1200 | $3,400 | $2.83 | 7d | 1 | 1.14mi |
| 15509 Park Ln South Holland, IL | 4.0 | 1.5 | 1200 | $3,400 | $2.83 | 24d | 1 | 1.14mi |
| 15238 Doctor Martin Luther King Junior Dr Unit 2W Dolton, IL | 2.0 | 1.0 | 800 | $1,500 | $1.88 | 10d | 1 | 1.46mi |
Listing history 2 events
-
2026-05-05status Pending
-
2026-04-30$159,900 Active
ⓘ Source: listings_history table (triggers on properties + properties_extension) + one-shot
backfill from property_details.listing_events for pre-trigger history.
Climate risk First Street
- Flood 1/10 Low FEMA zone X (unshaded) · 0% chance over 30 yrs
- Wildfire 1/10 Low
- Heat 3/10 Moderate 7 d/yr ≥102°F today · 15 d/yr by 30 yrs out
- Wind 2/10 Low
- Air quality 4/10 Moderate 4 unhealthy d/yr today · 5 by 30 yrs out
Nearby sold comps map
Loading sold comps map…
Walkable amenities ~0.75 mi
Loading nearby amenities…
Taxation est. · year 1
- Rental income
- $37,403
- − Mortgage interest
- −$8,957
- − Property taxes
- −$2,398
- − Insurance
- −$800
- − Repairs & maintenance
- −$2,992
- − Management
- −$2,992
- − Depreciation
- −$4,652
- Taxable income
- $14,612
- Est. tax owed @ 24.0%
- −$3,507
- After-tax cash flow
- $12,781/yr
For passive investors: Depreciation is non-cash, so a rental often shows a tax loss while cash-flowing — sheltering income. Rental losses are passive: they offset passive income freely, and up to $25,000/yr can offset ordinary (W-2) income if you actively participate and your MAGI is under $100k (phasing out to $0 by $150k); unused losses carry forward. On sale, claimed depreciation is recaptured at up to 25%, and gains may owe capital-gains tax (a 1031 exchange can defer both). Figures are a year-1 estimate at your 24.0% rate — not tax advice; consult a CPA.
Schools (NCES district)
- District
- Thornton Twp Hsd 205
- NCES district ID
- 1738970
- Math proficiency
- 7% ▬ 0.00%
- Reading proficiency
- 8% ▼ -2.00%
- Median HH income
- $43,392
- Composite
- 6.92/100
- National rank
- #9976
- State rank
- #594 of 620 in IL
Livability — South Holland
- Score
- 77/100
- State rank
- #167
- US rank
- #3071
Category grades
Schools grade is shown separately in the Schools card above.
Census & demographics
- Census place
- South Holland, IL
- City population
- 21,407
- Population (ZIP)
- 21,407
Population outlook (Cook County) Hauer SSP2
- Today (2025)
- 5,347,519 people
- By 2030
- 5,357,703 · +0.2%
- By 2040
- 5,324,924 · -0.4%
- By 2050
- 5,230,762 · -2.2%
- By 2075
- 4,785,735 · -10.5%
- By 2100
- 4,188,836 · -21.7%
Race, ethnicity, and origin ACS 2023
- Neighborhood character
- Predominantly Black (75%)
- Race & ethnicity
- Black 75% White 10% Hispanic / Latino 10% Two or more races 3% Asian 1%
- Hispanic origin (detail)
- Mexican 9% Puerto Rican 1%
- Common ancestry
- Iranian 3% Romanian 2%
- Foreign-born
- 6% · Canada, China
- Languages at home
- 87% English-only · Spanish 8% Other Asian/Pacific 1% Russian/Polish/Slavic 1%
Political lean MEDSL · Cook
- 2024 margin
- Solid D (+42.0) · D 70.4% · R 28.4% · Other 1.2%
- 2008→2024 swing
- -11.4pp toward R · 2008: 53.4pp · 2024: 42.0pp
- All cycles
- 2024: D+42.0 2020: D+50.3 2016: D+53.0 2012: D+49.4 2008: D+53.4
Not yet ingested
- Civics
- —
Market trends
- HPI YoY
- ▼ -114.36%
- Current HPI
- 201.2479
- Rent YoY
- —
- Metro
- —
- State GDP YoY
- ▲ 1.59%
- F500 in state
- 60
Industry mix (Fortune 500 HQ in IL)
| Industry | F500 HQs | Revenue |
|---|---|---|
| Insurance | 4 | $201B |
|
||
| Consumer Goods | 4 | $87B |
|
||
| Industrial Machinery | 3 | $64B |
|
||
| Healthcare | 2 | $55B |
|
||
| Retail / Pharmacy | 1 | $148B |
|
||
| Agriculture / Food | 1 | $86B |
|
||
Price history
2 events — show timeline
- 2026-05-05 Pending — MRED as Distributed by MLS Grid
- 2026-04-30 Listed $159,900 MRED as Distributed by MLS Grid
Property tax history
+6.3%/yrLatest (2023): $8,131 · +73.7% YoY. Source: county tax records.
Cash-flow waterfall
monthlySold comps — $/sqft
last 12 mo · ≤1 miLoading sold comps…