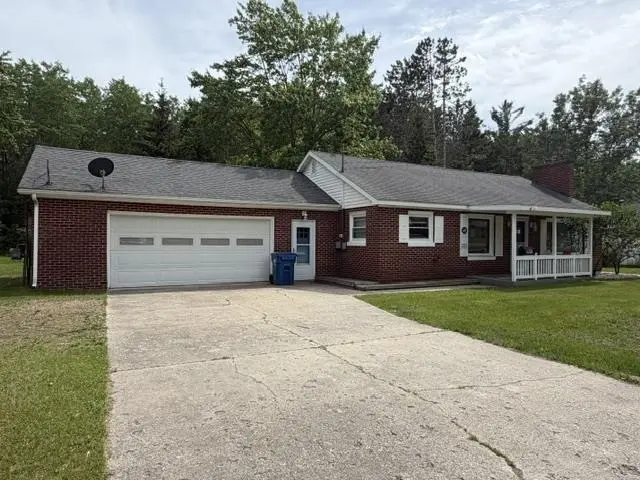
1693 Chestnut St · Cadillac, MI
Flood risk 6/10 · Moderate
- FEMA flood zone
- —
- Chance of flooding over 30 yrs
- 0.66%
- Est. flood insurance / yr
- —
Fire risk 1/10 · Minimal
- Est. fire insurance / yr
- $784 – $1,456
Heat risk 1/10 · Minimal
- Hot days now (above 91°F)
- 7 days/yr
- Hot days in 30 yrs
- 14 days/yr
Wind risk 1/10 · Minimal
- Chance of severe wind over 30 yrs
- —
Air-quality risk 2/10 · Minimal
- Unhealthy air days now
- 1 days/yr
- Unhealthy air days in 30 yrs
- 2 days/yr
Risk factors via First Street. Map © Google.
Why this score? — see what drove the B- grade
The composite is a weighted blend of 9 inputs, each scored 0–100. Each bar is that input's sub-score; the figure is the points it added to the 100-point composite (weight × sub-score).
- Cash flow +30.0/30.0
- DSCR +10.0/10.0
- 1% rule +8.9/10.0
- ARV discount +7.5/15.0
- Schools +4.1/10.0
- Livability +3.5/5.0
- Rent growth +2.5/5.0
- Condition / age +2.5/5.0
- Appreciation +0.0/10.0
$79,900
🖨 Deal sheet 📄 Offer letter ✓ Due diligence
Listing remarks MLS
Brick 3 bedroom ranch home on a large double lot. Walk to Kenwood Elementary, Cadillac Jr High or the high school. School playground directly across the street. Fireplace, main floor laundry, covered patio and a large 2 car garage. New roof Spring 2015, Furnace and water heater are less than a year old.
Key facts
- Covered front porch
- Great location
- Large yard
Tags
Property features AI
Exterior
- Parking: Attached garage with garage door opener; Two garage parking spaces
- Utilities: Public water; Community sewer; Cable available; DSL internet available; Natural gas for heat
- Home design: Single-story residential home; Built in 1954; Located in Cadillac
- Construction: Built 1954; Crawlspace foundation
- Exterior features: Porch; Crawl foundation; Property on approximately 0.68 acre lot; No water features
Interior
- Kitchen: Vinyl kitchen floor; Kitchen approximately 15 x 10
- Bedrooms: Three bedrooms on the main level (approx. 12 x 10; 12 x 9; 10 wide)
- Flooring: Vinyl flooring in the kitchen
- Bathrooms: One full bathroom (main level)
- Heating & cooling: Forced air heating; Natural gas
- Interior features: Fireplace; Formal dining room; Porch
- Laundry & utility: Laundry room on the main level
Neighborhood map
What this means for you Summary
Snapshot
- This is a 3-bed/1.0-bath single-family listed at $80k.
Deal economics
- At list price, monthly cash flow is $326 ($4k/yr) — positive.
- The deal already cash-flows at list — no discount required.
- Meets the 1% rule at list price ($1k rent vs $80k).
- Cap rate 11.2% vs local median 4.0% in Cadillac — top-decile yield for the area; either an underpriced asset or a hidden risk that comps aren't pricing in. Stress-test before assuming the spread holds.
Location & tenants
- Location reads 70/100 on livability (#312 in MI) — a middle-class / working-renter tenant base. Strengths: cost of living A+, housing A+, health & safety A+; Watch: crime F, amenities F, commute F.
- Cadillac Area Public Schools (town): math 45% / reading 53% proficiency, ranked #120 of 540 in MI (top 22%) — families likely to look elsewhere, expect single-tenant / working-renter base with shorter leases.
- Market conditions: 218 active listings in the ZIP; 2 comparable units currently listed for rent nearby; 130 units permitted in Wexford County in 2024 (50 in 5+ unit buildings).
Forward outlook
- Local home prices are declining (-3.0%/yr); year-one equity from $552 of loan paydown is wiped out by about $2k of value loss. Plan a longer hold.
- Wexford County population projected at -15% by 2050 — secular population decline; favor cash flow + early exit over multi-decade hold.
- At projected returns (-3.0% appreciation + 3.0% rent growth), your $22k cash investment doubles in ~7 years — after that, you're playing with house money.
Negotiation context
- Only 1 days on market — expect competitive offers; lowballing is unlikely to land.
Risks & watch-outs
- Watch-outs: built in 1954 — expect roof / HVAC / electrical / plumbing capex.
- Climate carrying-cost: major flood risk — expect insurance premiums to compound above CPI over the hold.
Questions for the listing agent
- Built in 1954 — when were the roof, HVAC, electrical panel, plumbing, and water heater last replaced?
- Is there a deadline driving the sale (1031 exchange, divorce, estate, relocation)? That informs how much negotiation room exists.
- Crime grade is F in this area — have there been break-ins, vandalism, or insurance claims at this property in the last 3 years? What carrier currently insures it and at what premium?
- What's the average days-on-market for RENTAL listings here right now (not sales)? A rising rental-DOM trend means longer vacancies and softer asking-rent achievability than the comps imply.
- What's the recent tenant-quality profile in this submarket — average credit score on applications, eviction rate, late-payment / NSF rate, and stable-employment percentage? A property-management company in the area should have these aggregated.
- How much new for-sale + rental construction is in the pipeline within 1–3 miles? Heavy new supply typically softens prices + rents 12–24 months out; constrained supply supports both.
Investment metrics
- 1% rule
- 1.39% ✓
- Cap rate
- 11.19%
- Cash-on-cash
- 17.50%
- DSCR
- 1.78
- GRM
- 6.0
CMA / ARV
- ARV (on-the-fly)
- $238,140
- Comps found
- 12
Show comp detail 12 sales within ~0.75 mi
| Address | Dist | Beds/Ba | Sqft | Sold | Price | $/sf | Match |
|---|---|---|---|---|---|---|---|
| 205 Alexander St | 0.27mi | 2/1.0 (-1) | 1,200 (-5%) | 7mo | $295,000 | $246 | 69 |
| 1705 Chestnut | 0.03mi | 4/1.0 (+1) | 1,113 (-12%) | 9mo | $210,000 | $189 | 67 |
| 302 Allen St | 0.32mi | 3/2.0 | 1,400 (+11%) | 1mo | $245,000 | $175 | 62 |
| 1875 W Division | 0.31mi | 2/1.0 (-1) | 1,126 (-11%) | 6mo | $192,500 | $171 | 58 |
| 825 Walnut St | 0.46mi | 2/1.0 (-1) | 1,128 (-10%) | 4mo | $152,500 | $135 | 52 |
| 2012 Kaylyn Dr | 0.31mi | 3/2.0 | 1,400 (+11%) | 14mo | $310,000 | $221 | 51 |
| 2012 Kaylyn Dr Lot : 11 | 0.31mi | 3/2.0 | 1,400 (+11%) | 14mo | $310,000 | $221 | 51 |
| 519 Boon St | 0.60mi | 3/2.0 | 1,410 (+12%) | 1mo | $45,000 | $32 | 47 |
| 142 Winona Pl | 0.46mi | 3/2.0 | 1,126 (-11%) | 13mo | $249,000 | $221 | 46 |
| 826 Elmer | 0.58mi | 4/1.0 (+1) | 1,162 (-8%) | 14mo | $216,000 | $186 | 43 |
| 706 Colfax St | 0.65mi | 3/2.0 | 1,152 (-9%) | 11mo | $228,000 | $198 | 42 |
| 715 Colfax St | 0.65mi | 2/1.0 (-1) | 1,108 (-12%) | 15mo | $165,000 | $149 | 32 |
Match score weights: distance 35% · size 25% · config 20% · recency 20%. Top-matched comps best support the ARV.
Projected returns pro-forma
-3.0% appreciation · 3.0% rent growth · sell at horizon
- IRR
- 8.9%
- Equity multiple
- 1.35×
- Total profit
- $7,848
- Equity at exit
- $11,913
- IRR
- 18.1%
- Equity multiple
- 2.50×
- Total profit
- $33,658
- Equity at exit
- $6,908
Cash invested: $22,372 (down + closing). Projections, not guarantees.
Landlord ↔ Tenant lean methodology
- Overall (STATE)
- 62 Landlord-Friendly
- State Michigan
- 62 Landlord-Friendly · EVEN
- County
- — inherits STATE
- City
- — inherits STATE
ZIP-level market 49601
- Home prices YoY
- -19.9%
- Active inventory
- 218
- Price-to-rent
- 6.0×
Monthly cashflow live
- Estimated rent
- $1,112 medium interval (Pro) →
- Mortgage (P&I)
- −$419
- Tax est. 1.5%
- −$100 /mo · $1,198/yr
- Insurance
- −$33
- HOA
- −$0
- Vacancy / Maint / Mgmt
- −$234
- Net cashflow
- $326
Break-even live
UW: 25.0% down · 7.5% · 30yr · 1.5% tax · 5.0% vac · 8.0% maint · 8.0% mgmt
Financing live
Cash to close
- Down payment
- $19,975
- Closing costs
- $2,397
- Reserves months
- —
- Total cash needed
- —
Loan-product check · same deal, 3 products live
Conventional
25% down · 7.5% · 30yr
- Down + closing
- —
- Monthly P&I
- —
- Monthly cashflow
- —
- DSCR
- —
- Eligible?
- —
Personal DTI + credit; lowest rate.
DSCR
20% down · 8.5% · 30yr
- Down + closing
- —
- Monthly P&I
- —
- Monthly cashflow
- —
- DSCR
- —
- Eligible?
- —
No personal income docs; deal must DSCR.
Hard money
10% down · 12.0% · 12mo
- Down + closing
- —
- Monthly P&I
- —
- Monthly cashflow
- —
- DSCR
- —
- Eligible?
- —
Short-term bridge; refi at stabilization.
Rent comps 2 comps
| Address | Beds | Baths | Sqft | Rent | $/sqft | DOM | Units | Dist |
|---|---|---|---|---|---|---|---|---|
| 300 Kristy Jo St Cadillac, MI | 2.0 | 2.0 | 896 | $1,099 | $1.23 | 43d | 1 | 0.49mi |
| 218 E River St Unit 2 Cadillac, MI | 3.0 | 1.0 | 920 | $1,150 | $1.25 | 43d | 1 | 1.49mi |
Listing history 4 events
-
2026-06-16statusdays on market $79,900 Pending 1 DOM
-
2026-06-15days on market $79,900 Active 3 DOM
-
2026-06-13remarks 427-char remark
-
2026-06-13$79,900 Active 1 DOM
ⓘ Source: listings_history table (triggers on properties + properties_extension) + one-shot
backfill from property_details.listing_events for pre-trigger history.
Climate risk First Street
- Flood 6/10 Major 66% chance over 30 yrs
- Wildfire 1/10 Low
- Heat 1/10 Low 7 d/yr ≥91°F today · 14 d/yr by 30 yrs out
- Wind 1/10 Low
- Air quality 2/10 Low 1 unhealthy d/yr today · 2 by 30 yrs out
Nearby sold comps map
Loading sold comps map…
Walkable amenities ~0.75 mi
Loading nearby amenities…
Taxation est. · year 1
- Rental income
- $13,343
- − Mortgage interest
- −$4,476
- − Property taxes
- −$1,198
- − Insurance
- −$400
- − Repairs & maintenance
- −$1,067
- − Management
- −$1,067
- − Depreciation
- −$2,324
- Taxable income
- $2,810
- Est. tax owed @ 24.0%
- −$674
- After-tax cash flow
- $3,241/yr
For passive investors: Depreciation is non-cash, so a rental often shows a tax loss while cash-flowing — sheltering income. Rental losses are passive: they offset passive income freely, and up to $25,000/yr can offset ordinary (W-2) income if you actively participate and your MAGI is under $100k (phasing out to $0 by $150k); unused losses carry forward. On sale, claimed depreciation is recaptured at up to 25%, and gains may owe capital-gains tax (a 1031 exchange can defer both). Figures are a year-1 estimate at your 24.0% rate — not tax advice; consult a CPA.
Schools (NCES district)
- District
- Cadillac Area Public Schools
- NCES district ID
- 2607590
- Math proficiency
- 45% ▼ -6.00%
- Reading proficiency
- 53% ▼ -4.00%
- Median HH income
- $41,543
- Composite
- 41.12/100
- National rank
- #3562
- State rank
- #120 of 540 in MI
Livability — Cadillac
- Score
- 70/100
- State rank
- #312
- US rank
- #7631
Category grades
Schools grade is shown separately in the Schools card above.
Census & demographics
- Census place
- Cadillac, MI
- Population (ZIP)
- 22,121
Population outlook (Wexford County) Hauer SSP2
- Today (2025)
- 32,399 people
- By 2030
- 31,692 · -2.2%
- By 2040
- 29,789 · -8.1%
- By 2050
- 27,473 · -15.2%
- By 2075
- 21,822 · -32.6%
- By 2100
- 15,237 · -53.0%
Race, ethnicity, and origin ACS 2023
- Neighborhood character
- Predominantly White (92%)
- Race & ethnicity
- White 92% Two or more races 5% Hispanic / Latino 2% Black 1%
- Common ancestry
- Iranian 7% Romanian 6% Lithuanian 4%
- Foreign-born
- 2% · Canada
- Languages at home
- 97% English-only · German/W. Germanic 1% Spanish 1%
Political lean MEDSL · Wexford
- 2024 margin
- Solid R (+34.6) · D 32.0% · R 66.6% · Other 1.5%
- 2008→2024 swing
- -30.4pp toward R · 2008: -4.2pp · 2024: -34.6pp
- All cycles
- 2024: R+34.6 2020: R+34.3 2016: R+36.4 2012: R+16.3 2008: R+4.2
Not yet ingested
- Civics
- —
Market trends
- HPI YoY
- ▼ -85.43%
- Current HPI
- 344.1577
- Rent YoY
- —
- Metro
- —
- State GDP YoY
- ▲ 1.37%
- F500 in state
- 28
Industry mix (Fortune 500 HQ in MI)
| Industry | F500 HQs | Revenue |
|---|---|---|
| Automotive Parts | 3 | $48B |
|
||
| Automotive | 2 | $372B |
|
||
| Chemicals | 1 | $45B |
|
||
| Automotive Retail | 1 | $29B |
|
||
| Healthcare / Medical Devices | 1 | $23B |
|
||
| Automotive Technology | 1 | $20B |
|
||
Price history
+6.5% since first listed3 events — show timeline
- 2026-06-12 Listed $79,900 MiRealSource-MiMLS
- 2015-09-23 Sold (Public Records) $75,000 Public Records
- 2015-09-23 Sold (MLS) $75,000 WWMLS
Cash-flow waterfall
monthlySold comps — $/sqft
last 12 mo · ≤1 miLoading sold comps…