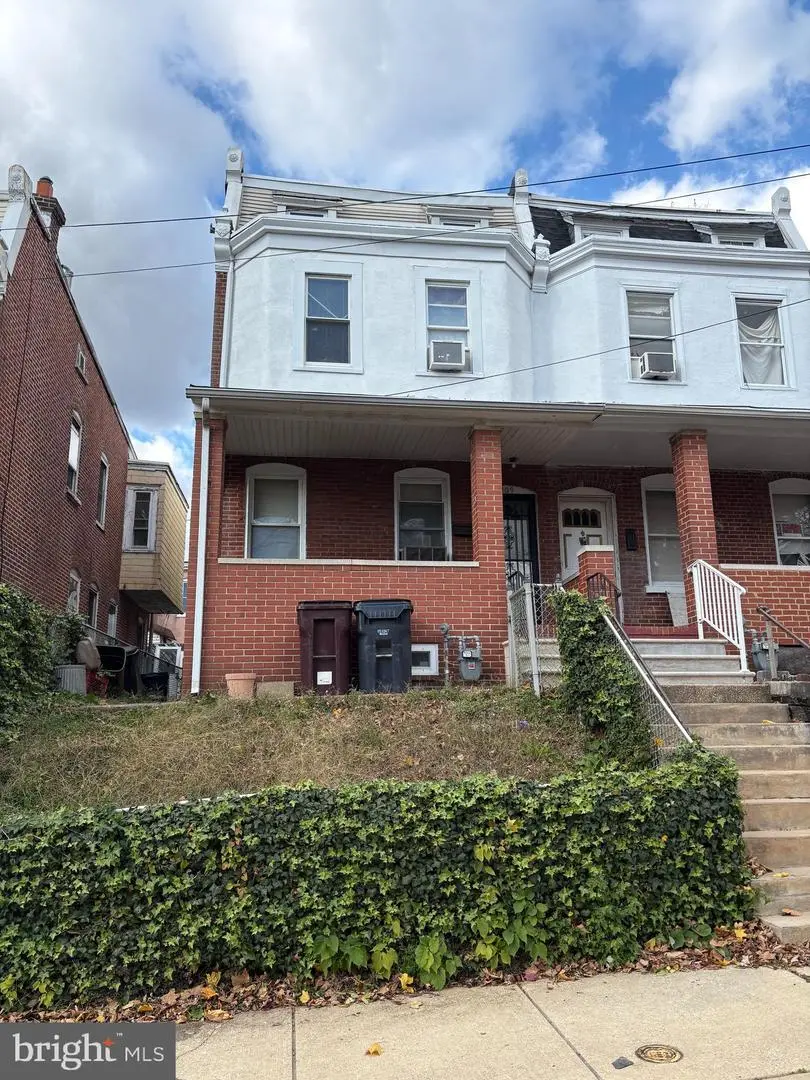
109 Fulton St · Wilmington, DE
Flood risk 1/10 · Minimal
- FEMA flood zone
- X (unshaded)
- Chance of flooding over 30 yrs
- 0.0%
- Est. flood insurance / yr
- $473 – $860
Fire risk 1/10 · Minimal
- Est. fire insurance / yr
- $476 – $884
Heat risk 8/10 · Major
- Hot days now (above 103°F)
- 7 days/yr
- Hot days in 30 yrs
- 16 days/yr
Wind risk 6/10 · Moderate
- Chance of severe wind over 30 yrs
- 27.0%
Air-quality risk 3/10 · Minor
- Unhealthy air days now
- 3 days/yr
- Unhealthy air days in 30 yrs
- 4 days/yr
Risk factors via First Street. Map © Google.
Why this score? — see what drove the B+ grade
The composite is a weighted blend of 9 inputs, each scored 0–100. Each bar is that input's sub-score; the figure is the points it added to the 100-point composite (weight × sub-score).
- Cash flow +30.0/30.0
- ARV discount +15.0/15.0
- 1% rule +10.0/10.0
- DSCR +10.0/10.0
- Rent growth +4.1/5.0
- Livability +3.2/5.0
- Schools +3.1/10.0
- Condition / age +2.5/5.0
- Appreciation +0.0/10.0
$125,000
🖨 Deal sheet 📄 Offer letter ✓ Due diligence
Listing remarks
INVESTOR ALERT! - Property being sold as is! Inspections for informational purposes only. Home has been taken care of but needs some TLC and it's ready to be that rental property to add to your investment portfolio or your home! The main level consists of living room, dining room, kitchen and bonus room that can be used for additional storage, office or upgrade it to a second bathroom or laundry room. The upper level consists of three spacious bedrooms and good closet space. Seller will be leaving some contents in the home and they will convey with the property. For homeowners, PNC offering $10K grant with no income limits providing it's the buyer's primary residence. Do not need to be a
Key facts
- Built 1914
- Listed 2 days
Property features AI
Exterior
- Parking: On-street parking
- Utilities: Public water; Public sewer; Natural gas service
- Home design: Semi-detached property; Above-grade finished area about 1,425 (source: assessor)
- Construction: Brick construction; Concrete perimeter foundation; Above-grade and below-grade structures
- Exterior features: Lot dimensions approximately 21.3 x 70.0; Not in a federal flood zone; Ground rent paid annually
Interior
- Bedrooms: Three bedrooms on the first upper level; Seven rooms total
- Bathrooms: One full bathroom (all upper levels)
- Heating & cooling: Hot water heating; Natural gas heating and hot water
- Interior features: Full basement; Chairlift (accessibility feature)
Neighborhood map
What this means for you Summary
Snapshot
- This is a 4-bed/1.0-bath townhouse listed at $125k.
Deal economics
- At list price, monthly cash flow is $737 ($9k/yr) — positive.
- The deal already cash-flows at list — no discount required.
- Meets the 1% rule at list price ($2k rent vs $125k).
- Cap rate 13.4% vs local median 5.6% in Wilmington — top-decile yield for the area; either an underpriced asset or a hidden risk that comps aren't pricing in. Stress-test before assuming the spread holds.
Location & tenants
- Location reads 64/100 on livability (#52 in DE) — a middle-class / working-renter tenant base. Strengths: cost of living A+, housing A; Watch: employment D+, schools D, commute D.
- Red Clay Consolidated School District (suburban): math 27% / reading 42% proficiency, ranked #12 of 26 in DE (top 46%) — families likely to look elsewhere, expect single-tenant / working-renter base with shorter leases.
- Market conditions: Rents rising fast (+6.3%/yr); 167 active listings in the ZIP; 37 comparable units currently listed for rent nearby; rentals at typical pace (median 19d on market — plan ~3-4 weeks tenant-placement turnaround); 1,367 units permitted in New Castle County in 2024 (201 in 5+ unit buildings).
- This rent runs 40% of the median local income ($60k/yr) — at the standard rent-burdened threshold; future hikes will face affordability resistance.
Forward outlook
- Local home prices are declining (-3.0%/yr); year-one equity from $864 of loan paydown is wiped out by about $4k of value loss. Plan a longer hold.
- New Castle County population projected at +9% by 2050 — modest demand growth; plan on rents tracking national, not racing it.
- At projected returns (-3.0% appreciation + 6.3% rent growth), your $35k cash investment doubles in ~5 years — after that, you're playing with house money.
Negotiation context
- Only 2 days on market — expect competitive offers; lowballing is unlikely to land.
- 3 sale attempts with the ask held roughly flat each time — persistent listings suggest the price (not the market) is what's stuck; bring a comps-based counter.
Risks & watch-outs
- Watch-outs: built in 1914 — expect roof / HVAC / electrical / plumbing capex.
- Climate carrying-cost: major wind risk, 27% chance of damaging wind over 30y; extreme-heat days projected 7→16/yr by 2055 (HVAC capex compounding) — expect insurance premiums to compound above CPI over the hold.
Questions for the listing agent
- Built in 1914 — when were the roof, HVAC, electrical panel, plumbing, and water heater last replaced?
- Is there a deadline driving the sale (1031 exchange, divorce, estate, relocation)? That informs how much negotiation room exists.
- Schools are D-rated, which usually means shorter tenancies and higher turnover. Who's the typical renter profile here, and what's been the actual vacancy rate?
- Crime grade is F in this area — have there been break-ins, vandalism, or insurance claims at this property in the last 3 years? What carrier currently insures it and at what premium?
- What's the average days-on-market for RENTAL listings here right now (not sales)? A rising rental-DOM trend means longer vacancies and softer asking-rent achievability than the comps imply.
- What's the recent tenant-quality profile in this submarket — average credit score on applications, eviction rate, late-payment / NSF rate, and stable-employment percentage? A property-management company in the area should have these aggregated.
- How much new for-sale + rental construction is in the pipeline within 1–3 miles? Heavy new supply typically softens prices + rents 12–24 months out; constrained supply supports both.
Investment metrics
- 1% rule
- 1.62% ✓
- Cap rate
- 13.37%
- Cash-on-cash
- 25.28%
- DSCR
- 2.13
- GRM
- 5.1
CMA / ARV
- ARV (on-the-fly)
- $247,950
- Comps found
- 12
Show comp detail 12 sales within ~0.75 mi
| Address | Dist | Beds/Ba | Sqft | Sold | Price | $/sf | Match |
|---|---|---|---|---|---|---|---|
| 422 S Broom St | 0.24mi | 3/2.0 (-1) | 1,400 (-2%) | 1mo | $299,900 | $214 | 76 |
| 315 S Jackson St | 0.37mi | 3/1.5 (-1) | 1,475 (+4%) | 1mo | $180,000 | $122 | 69 |
| 1302 W 6th St | 0.30mi | 4/2.5 | 1,525 (+7%) | 1mo | $265,000 | $174 | 68 |
| 1210 Elm St | 0.24mi | 3/2.0 (-1) | 1,300 (-9%) | 1mo | $200,000 | $154 | 64 |
| 1213 W 3rd St | 0.22mi | 3/1.5 (-1) | 1,250 (-12%) | 1mo | $215,000 | $172 | 62 |
| 1204 W 8th St | 0.43mi | 3/1.5 (-1) | 1,525 (+7%) | 0mo | $355,000 | $233 | 61 |
| 1715 Sycamore St | 0.37mi | 3/1.0 (-1) | 1,260 (-12%) | 1mo | $241,000 | $191 | 58 |
| 1911 W 9th St | 0.61mi | 3/1.0 (-1) | 1,325 (-7%) | 1mo | $275,000 | $208 | 54 |
| 1823 W 7th St | 0.47mi | 3/2.0 (-1) | 1,300 (-9%) | 1mo | $180,000 | $138 | 54 |
| 25 6th Ave | 0.65mi | 3/1.0 (-1) | 1,325 (-7%) | 1mo | $115,000 | $87 | 52 |
| 236 N Monroe St | 0.50mi | 3/1.5 (-1) | 1,250 (-12%) | 1mo | $180,000 | $144 | 48 |
| 400 Geddes St | 0.48mi | 3/1.5 (-1) | 1,225 (-14%) | 0mo | $337,500 | $276 | 47 |
Match score weights: distance 35% · size 25% · config 20% · recency 20%. Top-matched comps best support the ARV.
Projected returns pro-forma
-3.0% appreciation · 6.35% rent growth · sell at horizon
- IRR
- 22.6%
- Equity multiple
- 1.97×
- Total profit
- $33,806
- Equity at exit
- $18,638
- IRR
- 32.7%
- Equity multiple
- 4.46×
- Total profit
- $121,088
- Equity at exit
- $10,808
Cash invested: $35,000 (down + closing). Projections, not guarantees.
Landlord ↔ Tenant lean methodology
- Overall (STATE)
- 70 Landlord-Friendly
- State Delaware
- 70 Landlord-Friendly · D+7
- County
- — inherits STATE
- City
- — inherits STATE
ZIP-level market 19805
- Rents YoY
- 6.3%
- Active inventory
- 167
- Price-to-rent
- 5.1×
Monthly cashflow live
- Estimated rent
- $2,027 high interval (Pro) →
- Mortgage (P&I)
- −$656
- Tax est. 1.5%
- −$156 /mo · $1,875/yr
- Insurance
- −$52
- HOA
- −$0
- Vacancy / Maint / Mgmt
- −$426
- Net cashflow
- $737
Break-even live
UW: 25.0% down · 7.5% · 30yr · 1.5% tax · 5.0% vac · 8.0% maint · 8.0% mgmt
Financing live
Cash to close
- Down payment
- $31,250
- Closing costs
- $3,750
- Reserves months
- —
- Total cash needed
- —
Loan-product check · same deal, 3 products live
Conventional
25% down · 7.5% · 30yr
- Down + closing
- —
- Monthly P&I
- —
- Monthly cashflow
- —
- DSCR
- —
- Eligible?
- —
Personal DTI + credit; lowest rate.
DSCR
20% down · 8.5% · 30yr
- Down + closing
- —
- Monthly P&I
- —
- Monthly cashflow
- —
- DSCR
- —
- Eligible?
- —
No personal income docs; deal must DSCR.
Hard money
10% down · 12.0% · 12mo
- Down + closing
- —
- Monthly P&I
- —
- Monthly cashflow
- —
- DSCR
- —
- Eligible?
- —
Short-term bridge; refi at stabilization.
Rent comps 37 comps
| Address | Beds | Baths | Sqft | Rent | $/sqft | DOM | Units | Dist |
|---|---|---|---|---|---|---|---|---|
| 1301 Lancaster Ave Wilmington, DE | 4.0 | 2.0 | 1200 | $1,800 | $1.50 | 11d | 1 | 0.12mi |
| 115 N Clayton St Unit 115 Wilmington, DE | 3.0 | 1.5 | 1200 | $1,725 | $1.44 | 11d | 1 | 0.13mi |
| 307 N Rodney St Wilmington, DE | 3.0 | 1.5 | 1425 | $2,000 | $1.40 | 43d | 1 | 0.17mi |
| 232 N Franklin St Wilmington, DE | 3.0 | 2.0 | 1150 | $1,795 | $1.56 | 43d | 1 | 0.19mi |
| 1227 Linden St Wilmington, DE | 3.0 | 2.0 | 950 | $1,850 | $1.95 | 3d | 1 | 0.22mi |
| 414 S Franklin St Wilmington, DE | 3.0 | 2.0 | 1195 | $1,895 | $1.59 | 43d | 1 | 0.25mi |
| 1029 Lancaster Ave Wilmington, DE | 4.0 | 1.5 | 1375 | $1,900 | $1.38 | 24d | 1 | 0.28mi |
| 1525 Beech St Wilmington, DE | 3.0 | 2.5 | 1850 | $2,400 | $1.30 | 5d | 1 | 0.31mi |
| 521 N Franklin St Wilmington, DE | 3.0 | 2.0 | 1500 | $1,850 | $1.23 | 3d | 1 | 0.32mi |
| 1110 Maple St Wilmington, DE | 3.0 | 1.0 | 1525 | $1,600 | $1.05 | 43d | 1 | 0.32mi |
| 1802 Maple St Wilmington, DE | 3.0 | 1.5 | 1250 | $2,500 | $2.00 | 24d | 1 | 0.36mi |
| 1815 Maple St Wilmington, DE | 3.0 | 1.5 | 1100 | $1,995 | $1.81 | 18d | 1 | 0.37mi |
| 1913 W 2nd St Unit 1913 Wilmington, DE | 5.0 | 1.5 | 1675 | $2,050 | $1.22 | 43d | 1 | 0.38mi |
| 618 N Scott St Wilmington, DE | 3.0 | 1.5 | 1400 | $1,850 | $1.32 | 43d | 1 | 0.44mi |
| 1607 Howland St Wilmington, DE | 3.0 | 1.0 | 1075 | $1,900 | $1.77 | 3d | 1 | 0.51mi |
| 21 Stroud St Unit 1 Wilmington, DE | 3.0 | 1.5 | 1875 | $1,900 | $1.01 | 43d | 1 | 0.52mi |
| 25 Stroud St Wilmington, DE | 3.0 | 1.0 | 1200 | $1,795 | $1.50 | 3d | 1 | 0.53mi |
| 1624 W 9th St Wilmington, DE | 3.0 | 2.5 | 1780 | $2,500 | $1.40 | 18d | 1 | 0.55mi |
| 820 W 7th St Wilmington, DE | 3.0 | 1.0 | 1000 | $1,650 | $1.65 | 43d | 1 | 0.56mi |
| 1016 Clayton Rd Wilmington, DE | 3.0 | 1.0 | 1150 | $1,850 | $1.61 | 5d | 1 | 0.58mi |
| 7 6th Ave Wilmington, DE | 3.0 | 2.0 | 1325 | $1,800 | $1.36 | 43d | 1 | 0.59mi |
| 617 W 6th St Unit 617 B Wilmington, DE | 3.0 | 1.0 | 1000 | $1,600 | $1.60 | 5d | 1 | 0.64mi |
| 507 W 4th St Wilmington, DE | 3.0 | 1.5 | 1075 | $1,800 | $1.67 | 12d | 1 | 0.66mi |
| 1601 E Latimer Pl Wilmington, DE | 4.0 | 1.0 | 1450 | $2,195 | $1.51 | 18d | 1 | 0.66mi |
| 1508 Maryland Ave Wilmington, DE | 3.0 | 1.5 | 1450 | $1,975 | $1.36 | 14d | 1 | 0.67mi |
| 1122 Coyne Pl Wilmington, DE | 3.0 | 1.0 | 1350 | $1,950 | $1.44 | 43d | 1 | 0.67mi |
| 1010 Trenton Pl Wilmington, DE | 3.0 | 1.5 | 1475 | $2,350 | $1.59 | 16d | 1 | 0.76mi |
| 1936 Lakeview Rd Wilmington, DE | 3.0 | 1.0 | 1350 | $1,850 | $1.37 | 14d | 1 | 0.81mi |
| 801 N Orange St Wilmington, DE | 3.0 | 1.0–3.0 | 1118 | $3,991 | $3.57 | 2d | 117 | 0.93mi |
| 1601 Bonwood Rd Wilmington, DE | 3.0 | 1.5 | 1500 | $1,850 | $1.23 | 24d | 1 | 0.97mi |
| 107 W 13th St Wilmington, DE | 3.0 | 1.5 | 1325 | $1,895 | $1.43 | 43d | 1 | 1.14mi |
| 1217 N King St Wilmington, DE | 3.0 | 1.5 | 1300 | $2,145 | $1.65 | 18d | 1 | 1.22mi |
| 205 Western Ave Wilmington, DE | 4.0 | 2.5 | 1225 | $2,300 | $1.88 | 43d | 1 | 1.36mi |
| 605 E 10th St Wilmington, DE | 3.0 | 1.0 | 1200 | $1,850 | $1.54 | 24d | 1 | 1.42mi |
| 928 Kirkwood St Wilmington, DE | 3.0 | 1.5 | 1150 | $1,700 | $1.48 | 17d | 1 | 1.44mi |
| 27 Vilone Rd Wilmington, DE | 3.0 | 1.0 | 1225 | $2,000 | $1.63 | 5d | 1 | 1.46mi |
| 1004 N Spruce St Wilmington, DE | 3.0 | 1.5 | 1075 | $1,800 | $1.67 | 18d | 1 | 1.49mi |
Listing history 3 events
-
2026-06-18days on market $125,000 Active 2 DOM
-
2026-06-17remarks 699-char remark
-
2026-06-17$125,000 Active 1 DOM
ⓘ Source: listings_history table (triggers on properties + properties_extension) + one-shot
backfill from property_details.listing_events for pre-trigger history.
Climate risk First Street
- Flood 1/10 Low FEMA zone X (unshaded) · 0% chance over 30 yrs
- Wildfire 1/10 Low
- Heat 8/10 Severe 7 d/yr ≥103°F today · 16 d/yr by 30 yrs out
- Wind 6/10 Major 27% chance of damaging wind over 30 yrs
- Air quality 3/10 Moderate 3 unhealthy d/yr today · 4 by 30 yrs out
Nearby sold comps map
Loading sold comps map…
Walkable amenities ~0.75 mi
Loading nearby amenities…
Taxation est. · year 1
- Rental income
- $24,324
- − Mortgage interest
- −$7,002
- − Property taxes
- −$1,875
- − Insurance
- −$625
- − Repairs & maintenance
- −$1,946
- − Management
- −$1,946
- − Depreciation
- −$3,636
- Taxable income
- $7,294
- Est. tax owed @ 24.0%
- −$1,750
- After-tax cash flow
- $7,099/yr
For passive investors: Depreciation is non-cash, so a rental often shows a tax loss while cash-flowing — sheltering income. Rental losses are passive: they offset passive income freely, and up to $25,000/yr can offset ordinary (W-2) income if you actively participate and your MAGI is under $100k (phasing out to $0 by $150k); unused losses carry forward. On sale, claimed depreciation is recaptured at up to 25%, and gains may owe capital-gains tax (a 1031 exchange can defer both). Figures are a year-1 estimate at your 24.0% rate — not tax advice; consult a CPA.
Schools (NCES district)
- District
- Red Clay Consolidated School District
- NCES district ID
- 1001300
- Math proficiency
- 27% ▼ -11.00%
- Reading proficiency
- 42% ▼ -7.00%
- Median HH income
- $64,298
- Composite
- 31.25/100
- National rank
- #6027
- State rank
- #12 of 26 in DE
Livability — Wilmington
- Score
- 64/100
- State rank
- #52
- US rank
- #14251
Category grades
Schools grade is shown separately in the Schools card above.
Census & demographics
- Census place
- Wilmington, DE
- County
- New Castle County · 483,412 people
- City population
- 173,480
- Metro
- Philadelphia-Camden-Wilmington, PA-NJ-DE-MD
- Population (ZIP)
- 41,402
- Household income
- $60,221
- Rent vs Own
- Severe rent burden
- 1730.0
Population outlook (New Castle County) Hauer SSP2
- Today (2025)
- 594,686 people
- By 2030
- 609,164 · +2.4%
- By 2040
- 632,154 · +6.3%
- By 2050
- 649,068 · +9.1%
- By 2075
- 687,771 · +15.7%
- By 2100
- 694,961 · +16.9%
Race, ethnicity, and origin ACS 2023
- Neighborhood character
- Diverse neighborhood (Simpson 0.70)
- Race & ethnicity
- White 37% Black 32% Hispanic / Latino 25% Two or more races 10%
- Hispanic origin (detail)
- Mexican 10% Puerto Rican 10% Dominican 2%
- Common ancestry
- Romanian 4% Slovak 1% Italian 1%
- Foreign-born
- 9% · Canada
- Languages at home
- 79% English-only · Spanish 18% French/Haitian/Cajun 1% Arabic 1%
Political lean MEDSL · New Castle
- 2024 margin
- Solid D (+32.6) · D 65.5% · R 32.9% · Other 1.6%
- 2008→2024 swing
- -8.1pp toward R · 2008: 40.6pp · 2024: 32.6pp
- All cycles
- 2024: D+32.6 2020: D+37.1 2016: D+29.6 2012: D+34.1 2008: D+40.6
Not yet ingested
- Civics
- —
Market trends
- HPI YoY
- ▼ -291.16%
- Current HPI
- 259.1455
- Rent YoY
- ▲ 6.35%
- Metro
- Philadelphia-Camden-Wilmington, PA-NJ-DE-MD
- State GDP YoY
- —
- F500 in state
- 0
Price history
-16.7% since first listed8 events — show timeline
- 2026-06-16 Listed $125,000 BRIGHT MLS
- 2026-01-28 Listing Removed — BRIGHT MLS
- 2026-01-24 Price Changed $125,000 BRIGHT MLS
- 2026-01-23 Relisted — BRIGHT MLS
- 2025-11-25 Pending — BRIGHT MLS
- 2025-11-24 Listing Removed — BRIGHT MLS
- 2025-11-17 Listed $150,000 BRIGHT MLS
- 2025-11-14 Coming Soon — BRIGHT MLS
Property tax history
+2.0%/yrLatest (2024): $220 · +57.2% YoY. Source: county tax records.
Cash-flow waterfall
monthlySold comps — $/sqft
last 12 mo · ≤1 miLoading sold comps…