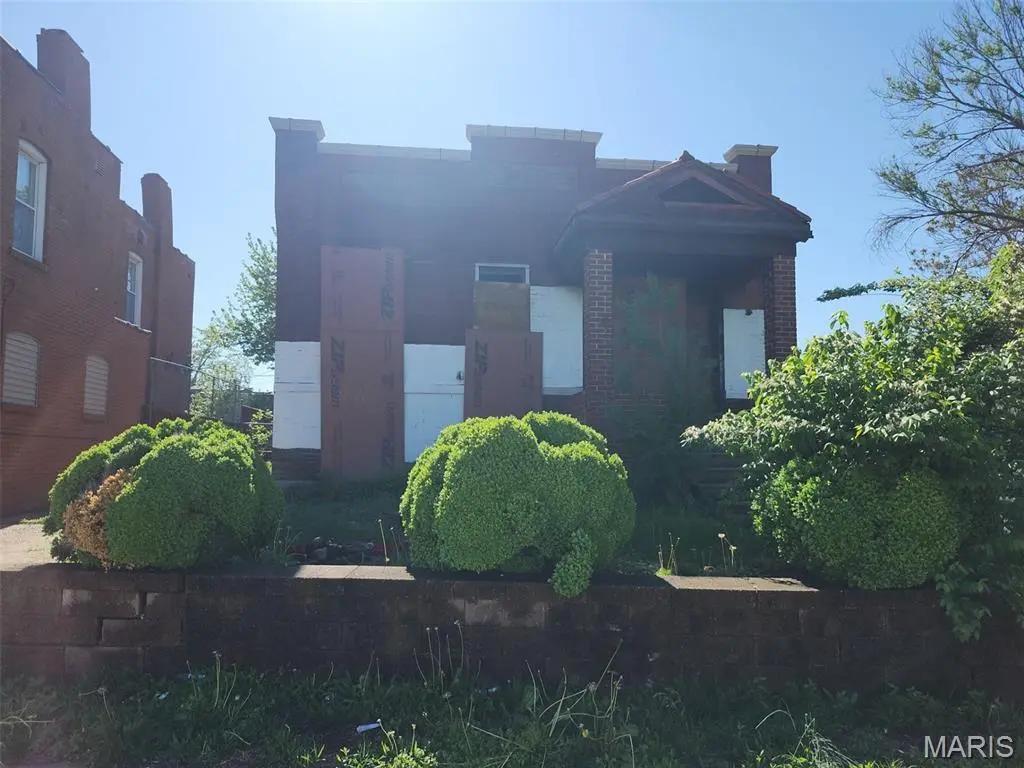
4712 Gravois Ave · St. Louis, MO
Flood risk 1/10 · Minimal
- FEMA flood zone
- X (unshaded)
- Chance of flooding over 30 yrs
- 0.0%
- Est. flood insurance / yr
- $473 – $860
Fire risk 1/10 · Minimal
- Est. fire insurance / yr
- $1,054 – $1,958
Heat risk 6/10 · Moderate
- Hot days now (above 108°F)
- 7 days/yr
- Hot days in 30 yrs
- 21 days/yr
Wind risk 2/10 · Minimal
- Chance of severe wind over 30 yrs
- 1.0%
Air-quality risk 3/10 · Minor
- Unhealthy air days now
- 3 days/yr
- Unhealthy air days in 30 yrs
- 4 days/yr
Risk factors via First Street. Map © Google.
Why this score? — see what drove the D grade
The composite is a weighted blend of 9 inputs, each scored 0–100. Each bar is that input's sub-score; the figure is the points it added to the 100-point composite (weight × sub-score).
- Cash flow +15.0/30.0
- ARV discount +7.5/15.0
- 1% rule +5.0/10.0
- DSCR +5.0/10.0
- Rent growth +3.2/5.0
- Livability +2.5/5.0
- Condition / age +2.5/5.0
- Schools +1.2/10.0
- Appreciation +0.0/10.0
$26,000
🖨 Deal sheet 📄 Offer letter ✓ Due diligence
Listing remarks
This 1,224-square-foot brick home in South City offers three-bedroom, one-bathroom layout perfect for any lifestyle. The property gives an opportunity for personalized living spaces. A full basement providing ample storage or potential for future customization. Situated on Gravois Avenue, this property combines classic Saint Louis character with everyday convenience.
Key facts
- Full basement
- 5,627 sq ft lot
- Built 1916
Tags
Property features AI
Exterior
- Utilities: Public water; Public sewer; Electric service by Ameren
- Home design: Single-family residence; One level
- Construction: Brick construction
- Exterior features: Front yard; Back yard
Interior
- Bedrooms: Three bedrooms on the main level
- Bathrooms: One full bathroom on the main level
- Heating & cooling: Forced air heating; Central air conditioning
- Interior features: Full basement
Neighborhood map
What this means for you Summary
Snapshot
- This is a 3-bed/1.0-bath single-family listed at $26k.
Deal economics
- At list price, monthly cash flow is $797 ($10k/yr) — positive.
- The deal already cash-flows at list — no discount required.
- Meets the 1% rule at list price ($1k rent vs $26k).
- Recommended offer: $25k (3.0% below list) — sets the bar for market timing.
- Cap rate 43.1% vs local median 5.0% in St. Louis — top-decile yield for the area; either an underpriced asset or a hidden risk that comps aren't pricing in. Stress-test before assuming the spread holds.
Location & tenants
- Location reads: area grade D — affects rentability + tenant quality, not the cash-flow math above.
- St. Louis City (urban): math 10% / reading 18% proficiency, ranked #312 of 324 in MO (top 96%) — low school quality limits family demand, transient renter base, plan for 1-2y turnover; 80% free/reduced lunch — lower-income household profile, screen leases tightly.
- Zoned schools: Woerner Elem. (math 8% / reading 17%, grade F, #1,007 of 1,115 statewide, top 91%, 362 students, 99% FRL); Roosevelt High (math 2% / reading 8%, grade F, #517 of 521 statewide, top 100%, 460 students, 99% FRL) — zoned schools average 99% FRL vs 80% district-wide (19 pts higher); higher-poverty schools than district average — tighter screening recommended.
- Market conditions: Rents rising (+2.6%/yr); 255 active listings in the ZIP; 40 comparable units currently listed for rent nearby; rentals at typical pace (median 24d on market — plan ~3-4 weeks tenant-placement turnaround); 40% of comp listings sitting > 30 days — soft ceiling on asking rent; 294 units permitted in St. Louis city in 2024 (227 in 5+ unit buildings).
Forward outlook
- Local home prices are declining (-3.0%/yr); year-one equity from $180 of loan paydown is wiped out by about $780 of value loss. Plan a longer hold.
- St. Louis County population projected to shrink 6% by 2050 — rents likely to lag national; underwrite the cash flow, not the appreciation.
- At projected returns (-3.0% appreciation + 2.6% rent growth), your $7k cash investment doubles in ~1 year — after that, you're playing with house money.
Negotiation context
- It's been on market 42 days — a 3% lower offer ($25k) is reasonable based on typical stale-listing flexibility.
Risks & watch-outs
- Watch-outs: built in 1916 — expect roof / HVAC / electrical / plumbing capex.
- Climate carrying-cost: extreme-heat days projected 7→21/yr by 2055 (HVAC capex compounding) — expect insurance premiums to compound above CPI over the hold.
Questions for the listing agent
- It's been on market 42 days. Have you received any prior offers? Is the seller open to a 3% concession, seller financing, or rate buy-down credit?
- Built in 1916 — when were the roof, HVAC, electrical panel, plumbing, and water heater last replaced?
- Is there a deadline driving the sale (1031 exchange, divorce, estate, relocation)? That informs how much negotiation room exists.
- The area grade is low — what's the realistic commute time and amenity access for the typical tenant pool here? Any planned neighborhood developments (good or bad) we should know about?
- What's the average days-on-market for RENTAL listings here right now (not sales)? A rising rental-DOM trend means longer vacancies and softer asking-rent achievability than the comps imply.
- What's the recent tenant-quality profile in this submarket — average credit score on applications, eviction rate, late-payment / NSF rate, and stable-employment percentage? A property-management company in the area should have these aggregated.
- How much new for-sale + rental construction is in the pipeline within 1–3 miles? Heavy new supply typically softens prices + rents 12–24 months out; constrained supply supports both.
Investment metrics
- 1% rule
- 4.75% ✓
- Cap rate
- 43.06%
- Cash-on-cash
- 131.31%
- DSCR
- 6.84
- GRM
- 1.8
CMA / ARV
- ARV (median comp)
- $164,584
- List price
- $26,000
- Delta
- -84.20%
- Verdict
- UNDERPRICED
- Comps
- 20 within 1.0 mi
Show comp detail 12 sales within ~0.75 mi
| Address | Dist | Beds/Ba | Sqft | Sold | Price | $/sf | Match |
|---|---|---|---|---|---|---|---|
| 4410 Wallace St | 0.25mi | 2/1.0 (-1) | 1,192 (-3%) | 1mo | $215,000 | $180 | 78 |
| 4448 Itaska St | 0.32mi | 3/2.0 | 1,200 (-2%) | 1mo | $195,000 | $163 | 77 |
| 4333 Ellenwood Ave | 0.29mi | 2/1.0 (-1) | 1,172 (-4%) | 1mo | $165,000 | $141 | 74 |
| 4417 Wallace St | 0.26mi | 3/1.5 | 1,129 (-8%) | 1mo | $183,000 | $162 | 72 |
| 4467 Wilcox Ave | 0.37mi | 2/1.0 (-1) | 1,172 (-4%) | 2mo | $109,900 | $94 | 69 |
| 4323 Bingham Ave | 0.51mi | 2/1.0 (-1) | 1,200 (-2%) | 0mo | $79,900 | $67 | 68 |
| 5015 Gerritt Ave | 0.53mi | 2/1.0 (-1) | 1,293 (+6%) | 1mo | $165,000 | $128 | 60 |
| 4044 Walsh St | 0.38mi | 3/2.0 | 1,384 (+13%) | 2mo | $244,900 | $177 | 55 |
| 4471 S Spring Ave | 0.71mi | 3/2.0 | 1,152 (-6%) | 1mo | $135,000 | $117 | 52 |
| 6065 Wanda Ave | 0.74mi | 2/1.0 (-1) | 1,118 (-9%) | 2mo | $185,000 | $165 | 44 |
| 4404 S 39th St | 0.73mi | 2/2.0 (-1) | 1,120 (-8%) | 2mo | $164,900 | $147 | 42 |
| 5920 Morganford Rd | 0.68mi | 2/1.5 (-1) | 1,058 (-14%) | 1mo | $194,900 | $184 | 38 |
Match score weights: distance 35% · size 25% · config 20% · recency 20%. Top-matched comps best support the ARV.
Projected returns pro-forma
-3.0% appreciation · 2.62% rent growth · sell at horizon
- IRR
- —
- Equity multiple
- 7.33×
- Total profit
- $46,072
- Equity at exit
- $3,877
- IRR
- —
- Equity multiple
- 15.23×
- Total profit
- $103,609
- Equity at exit
- $2,248
Cash invested: $7,280 (down + closing). Projections, not guarantees.
Landlord ↔ Tenant lean methodology
- Overall (STATE)
- 81 Strongly Landlord-Friendly
- State Missouri
- 81 Strongly Landlord-Friendly · R+10
- County
- — inherits STATE
- City
- — inherits STATE
ZIP-level market 63116
- Rents YoY
- 2.6%
- Active inventory
- 255
- Price-to-rent
- 1.8×
Monthly cashflow live
- Estimated rent
- $1,236 high interval (Pro) →
- Mortgage (P&I)
- −$136
- Tax est. 1.5%
- −$32 /mo · $390/yr
- Insurance
- −$11
- HOA
- −$0
- Vacancy / Maint / Mgmt
- −$260
- Net cashflow
- $797
Break-even live
UW: 25.0% down · 7.5% · 30yr · 1.5% tax · 5.0% vac · 8.0% maint · 8.0% mgmt
Financing live
Cash to close
- Down payment
- $6,500
- Closing costs
- $780
- Reserves months
- —
- Total cash needed
- —
Loan-product check · same deal, 3 products live
Conventional
25% down · 7.5% · 30yr
- Down + closing
- —
- Monthly P&I
- —
- Monthly cashflow
- —
- DSCR
- —
- Eligible?
- —
Personal DTI + credit; lowest rate.
DSCR
20% down · 8.5% · 30yr
- Down + closing
- —
- Monthly P&I
- —
- Monthly cashflow
- —
- DSCR
- —
- Eligible?
- —
No personal income docs; deal must DSCR.
Hard money
10% down · 12.0% · 12mo
- Down + closing
- —
- Monthly P&I
- —
- Monthly cashflow
- —
- DSCR
- —
- Eligible?
- —
Short-term bridge; refi at stabilization.
Rent comps 40 comps
| Address | Beds | Baths | Sqft | Rent | $/sqft | DOM | Units | Dist |
|---|---|---|---|---|---|---|---|---|
| 4215 Gannett St Unit 1F St. Louis, MO | 2.0 | 1.0 | 1148 | $1,025 | $0.89 | 10d | 1 | 0.12mi |
| 4215 Neosho St Unit 101 St. Louis, MO | 2.0 | 1.0 | 750 | $825 | $1.10 | 43d | 1 | 0.18mi |
| 4413 Delor St Unit 2F St. Louis, MO | 2.0 | 1.0 | 1010 | $1,125 | $1.11 | 23d | 1 | 0.24mi |
| 4274 Ellenwood Ave Unit 1E St. Louis, MO | 2.0 | 1.0 | 800 | $995 | $1.24 | 43d | 1 | 0.25mi |
| 4177 Schiller Pl Saint Louis, MO | 2.0 | 1.0 | 1200 | $1,150 | $0.96 | 23d | 1 | 0.31mi |
| 4428 Ellenwood Ave Saint Louis, MO | 2.0 | 1.0 | 900 | $1,225 | $1.36 | 43d | 1 | 0.36mi |
| 5111 Cologne Ave Saint Louis, MO | 2.0 | 1.0 | 800 | $1,050 | $1.31 | 43d | 1 | 0.43mi |
| 4645 Wilcox Ave Unit 1st Floor St. Louis, MO | 2.0 | 1.0 | 1150 | $1,375 | $1.20 | 21d | 1 | 0.46mi |
| 4028 Schiller Pl Saint Louis, MO | 2.0 | 1.0 | 802 | $1,440 | $1.80 | 43d | 1 | 0.49mi |
| 5415 Dresden Ave Saint Louis, MO | 2.0 | 1.5 | 935 | $1,200 | $1.28 | 23d | 1 | 0.51mi |
| 4000 Schiller Pl Saint Louis, MO | 2.0 | 2.5 | 1448 | $1,618 | $1.12 | 7d | 1 | 0.53mi |
| 5970 Wanda Ave Saint Louis, MO | 4.0 | 2.0 | 1282 | $1,995 | $1.56 | 17d | 1 | 0.56mi |
| 5006 Christy Blvd Unit 1st Fl St. Louis, MO | 3.0 | 1.0 | 1100 | $1,450 | $1.32 | 43d | 1 | 0.57mi |
| 4710 Eichelberger St Unit First St. Louis, MO | 2.0 | 1.0 | 888 | $900 | $1.01 | 43d | 1 | 0.58mi |
| 5033 Ulena Ave Saint Louis, MO | 2.0 | 1.0 | 960 | $1,575 | $1.64 | 43d | 1 | 0.61mi |
| 3741 Morgan Ford Rd St. Louis, MO | 2.0 | 1.0 | 800 | $895 | $1.12 | 23d | 1 | 0.63mi |
| 3737 Morgan Ford Rd Apt F St. Louis, MO | 2.0 | 1.0 | 800 | $895 | $1.12 | 19d | 1 | 0.63mi |
| 3729 Morgan Ford Rd Apt G St. Louis, MO | 2.0 | 1.0 | 800 | $895 | $1.12 | 23d | 1 | 0.64mi |
| 3729 Morgan Ford Rd St. Louis, MO | 2.0 | 1.0 | 800 | $895 | $1.12 | 19d | 1 | 0.64mi |
| 5836 Goener Ave Unit 2F St. Louis, MO | 3.0 | 1.0 | 1250 | $1,500 | $1.20 | 43d | 1 | 0.65mi |
| 4766 Dahlia Ave Saint Louis, MO | 2.0 | 1.0 | 1184 | $1,695 | $1.43 | 2d | 1 | 0.67mi |
| 4950 Sutherland Ave Unit 1F St. Louis, MO | 2.0 | 1.0 | 1056 | $1,295 | $1.23 | 10d | 1 | 0.76mi |
| 3824 Eiler St Saint Louis, MO | 2.0 | 1.0 | 1000 | $1,050 | $1.05 | 23d | 1 | 0.77mi |
| 4455 S 38th St Saint Louis, MO | 3.0 | 1.0 | 1000 | $1,000 | $1.00 | 23d | 1 | 0.80mi |
| 3765 Delor St Unit 37651-F St. Louis, MO | 2.0 | 1.5 | 900 | $1,225 | $1.36 | 23d | 1 | 0.81mi |
| 4945 Winona Ave Unit 4945A St. Louis, MO | 2.0 | 1.0 | 1150 | $1,200 | $1.04 | 23d | 1 | 0.81mi |
| 4075 Bowen St Saint Louis, MO | 2.0 | 1.0 | 1200 | $1,200 | $1.00 | 43d | 1 | 0.81mi |
| 3761 Delor St St. Louis, MO | 2.0 | 1.5 | 900 | $1,285 | $1.43 | 1d | 2 | 0.82mi |
| 6135 Newport Ave Saint Louis, MO | 2.0 | 1.0 | 960 | $1,976 | $2.06 | 1d | 1 | 0.82mi |
| 3647 Delor St Unit 3647-1F St. Louis, MO | 2.0 | 1.5 | 900 | $1,115 | $1.24 | 43d | 1 | 0.84mi |
| 3737 Delor St Unit 3737-1F St. Louis, MO | 2.0 | 1.5 | 900 | $1,115 | $1.24 | 23d | 1 | 0.84mi |
| 3737 Delor St Unit 3737-2F St. Louis, MO | 2.0 | 1.5 | 900 | $1,115 | $1.24 | 43d | 1 | 0.85mi |
| 3729 Delor St Unit 37292-F St. Louis, MO | 2.0 | 1.5 | 900 | $1,115 | $1.24 | 23d | 1 | 0.85mi |
| 3723 Delor St Unit 3723-1F St. Louis, MO | 2.0 | 1.5 | 900 | $1,225 | $1.36 | 43d | 1 | 0.86mi |
| 3719 Delor St Unit 3719-1F St. Louis, MO | 2.0 | 1.5 | 900 | $1,115 | $1.24 | 43d | 1 | 0.86mi |
| 5616 S Kingshighway Blvd Saint Louis, MO | 3.0 | 2.0 | 1400 | $1,830 | $1.31 | 1d | 1 | 0.86mi |
| 3717 Delor St Unit 37172-F St. Louis, MO | 2.0 | 1.5 | 900 | $1,115 | $1.24 | 23d | 1 | 0.86mi |
| 3711 Delor St Unit 3711-1F St. Louis, MO | 2.0 | 1.5 | 900 | $1,225 | $1.36 | 23d | 1 | 0.88mi |
| 3709 Delor St Unit 3709-1F St. Louis, MO | 2.0 | 1.5 | 900 | $1,225 | $1.36 | 43d | 1 | 0.89mi |
| 3707a Delor St Unit 3707-2F St. Louis, MO | 2.0 | 1.5 | 900 | $1,115 | $1.24 | 43d | 1 | 0.90mi |
Listing history 9 events
-
2026-06-05statusdays on market $26,000 Pending 42 DOM
-
2026-06-03days on market $26,000 Active 41 DOM
-
2026-06-02days on market $26,000 Active 40 DOM
-
2026-06-01days on market $26,000 Active 39 DOM
-
2026-05-31days on market $26,000 Active 38 DOM
-
2026-04-23$26,000 Active 369-char remark
-
1996-10-09soldstatus
-
1996-10-09soldstatus
-
1996-10-07soldstatus
ⓘ Source: listings_history table (triggers on properties + properties_extension) + one-shot
backfill from property_details.listing_events for pre-trigger history.
Climate risk First Street
- Flood 1/10 Low FEMA zone X (unshaded) · 0% chance over 30 yrs
- Wildfire 1/10 Low
- Heat 6/10 Major 7 d/yr ≥108°F today · 21 d/yr by 30 yrs out
- Wind 2/10 Low 100% chance of damaging wind over 30 yrs
- Air quality 3/10 Moderate 3 unhealthy d/yr today · 4 by 30 yrs out
Nearby sold comps map
Loading sold comps map…
Walkable amenities ~0.75 mi
Loading nearby amenities…
Taxation est. · year 1
- Rental income
- $14,830
- − Mortgage interest
- −$1,456
- − Property taxes
- −$390
- − Insurance
- −$130
- − Repairs & maintenance
- −$1,186
- − Management
- −$1,186
- − Depreciation
- −$756
- Taxable income
- $9,724
- Est. tax owed @ 24.0%
- −$2,334
- After-tax cash flow
- $7,226/yr
For passive investors: Depreciation is non-cash, so a rental often shows a tax loss while cash-flowing — sheltering income. Rental losses are passive: they offset passive income freely, and up to $25,000/yr can offset ordinary (W-2) income if you actively participate and your MAGI is under $100k (phasing out to $0 by $150k); unused losses carry forward. On sale, claimed depreciation is recaptured at up to 25%, and gains may owe capital-gains tax (a 1031 exchange can defer both). Figures are a year-1 estimate at your 24.0% rate — not tax advice; consult a CPA.
Schools (NCES district)
- District
- St. Louis City
- NCES district ID
- 2929280
- Math proficiency
- 10% ▼ -6.00%
- Reading proficiency
- 18% ▼ -3.00%
- Median HH income
- $35,685
- Composite
- 11.54/100
- National rank
- #9699
- State rank
- #312 of 324 in MO
Livability — St. Louis
No livability data for this city. (Only ~50 U.S. cities are tracked.)
Census & demographics
- Census place
- St. Louis, MO
- County
- Saint Louis City · 254,015 people
- City population
- 283,259
- Metro
- St. Louis, MO-IL
- Population (ZIP)
- 42,170
- Household income
- $61,433
- Rent vs Own
- Severe rent burden
- 1923.0
Population outlook (St. Louis County) Hauer SSP2
- Today (2025)
- 315,737 people
- By 2030
- 313,865 · -0.6%
- By 2040
- 305,439 · -3.3%
- By 2050
- 296,529 · -6.1%
- By 2075
- 271,028 · -14.2%
- By 2100
- 255,359 · -19.1%
Race, ethnicity, and origin ACS 2023
- Neighborhood character
- Diverse neighborhood (Simpson 0.63)
- Race & ethnicity
- White 54% Black 27% Hispanic / Latino 10% Two or more races 8% Asian 5%
- Hispanic origin (detail)
- Mexican 7%
- Common ancestry
- Lithuanian 4% Romanian 2% Italian 2%
- Foreign-born
- 11% · Canada, Vietnam, Philippines
- Languages at home
- 85% English-only · Spanish 6% Vietnamese 2% Arabic 2%
Political lean MEDSL · St. Louis
- 2024 margin
- Solid D (+64.7) · D 81.4% · R 16.7% · Other 2.0%
- 2008→2024 swing
- -3.5pp toward R · 2008: 68.2pp · 2024: 64.7pp
- All cycles
- 2024: D+64.7 2020: D+66.2 2016: D+63.7 2012: D+66.6 2008: D+68.2
Not yet ingested
- Civics
- —
Market trends
- HPI YoY
- ▼ -271.19%
- Current HPI
- 215.7108
- Rent YoY
- ▲ 2.62%
- Metro
- St. Louis, MO-IL
- State GDP YoY
- ▲ 1.84%
- F500 in state
- 20
Industry mix (Fortune 500 HQ in MO)
| Industry | F500 HQs | Revenue |
|---|---|---|
| Healthcare | 1 | $163B |
|
||
| Insurance | 1 | $21B |
|
||
| Industrial Technology | 1 | $17B |
|
||
| Retail | 1 | $16B |
|
||
| Industrial Distribution | 1 | $10B |
|
||
| Utilities | 1 | $9B |
|
||
Price history
5 events — show timeline
- 2026-06-04 Pending — MARIS as Distributed by MLS Grid
- 2026-04-23 Listed $26,000 MARIS as Distributed by MLS Grid
- 1996-10-09 Sold (Public Records) — Public Records
- 1996-10-09 Sold (Public Records) — Public Records
- 1996-10-07 Sold (Public Records) — Public Records
Property tax history
+5.5%/yrLatest (2024): $1,359 · +4.7% YoY. Source: county tax records.
Cash-flow waterfall
monthlySold comps — $/sqft
last 12 mo · ≤1 miLoading sold comps…