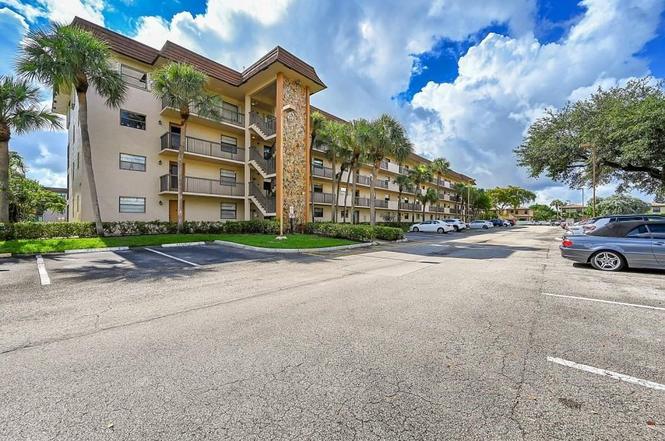
6095 N Sabal Palm Blvd #212 · Tamarac, FL
Flood risk No data
- FEMA flood zone
- —
- Chance of flooding over 30 yrs
- —
- Est. flood insurance / yr
- —
Fire risk No data
- Est. fire insurance / yr
- —
Heat risk No data
- Hot days now (above threshold)
- —
- Hot days in 30 yrs
- —
Wind risk No data
- Chance of severe wind over 30 yrs
- —
Air-quality risk No data
- Unhealthy air days now
- —
- Unhealthy air days in 30 yrs
- —
Risk factors via First Street. Map © Google.
Why this score? — see what drove the D grade
The composite is a weighted blend of 9 inputs, each scored 0–100. Each bar is that input's sub-score; the figure is the points it added to the 100-point composite (weight × sub-score).
- Cash flow +10.4/30.0
- 1% rule +10.0/10.0
- ARV discount +7.5/15.0
- Schools +4.1/10.0
- Livability +3.8/5.0
- DSCR +3.0/10.0
- Condition / age +2.5/5.0
- Rent growth +2.2/5.0
- Appreciation +0.0/10.0
$135,500
🖨 Deal sheet (PDF) 📄 Offer letter ✓ Due diligence
Listing remarks
MOTIVATED SELLER !! Beautiful condo in this 55+ community located in the heart of Tamarac! This centrally located gem is just minutes away from everything you need, from the beach to the shopping center and airports. Step inside, fall in love and enjoy the modern contemporary design. The spacious living and dining rooms, and a fully functional kitchen. Sip your morning coffee and enjoy the gorgeous garden view from your screened balcony in a private corner of this fully spacious 2/2 unit. With over 1,200 sq ft of living space, Spacious walk-in closet in the Master, and a stackable washer/dryer. plenty of storage. The convenience of an assigned parking spot. Amenities include 2 heater poo
Key facts
- Centrally located
- Screened balcony
- 2 heater pools
Tags
Property features AI
Finance
- Other: Building area approximately 1,000 (public records); Resale condition
- Financial info: No land lease; Pets not allowed
- HOA & community: Community is a senior community; Association amenities: Billiard room, Clubhouse, Fitness center, Game room, Parking, Pool, Shuffleboard court, Spa/Hot Tub, Storage, Tennis courts, Business center, Community room; Association includes internet and maintenance; Association fee paid monthly; Association fee includes cable TV, insurance, internet, sewer, trash, water, common areas, recreation facility, pool service
Exterior
- Parking: Assigned parking; Guest parking; 1 parking space
- Security: Other security features
- Utilities: Public water; Public sewer; Cable connected; Electricity connected; Sewer available
- Home design: Condominium; One level; Building faces north; 3 total stories; Entry level: 1
- Construction: CBS construction; Other roof
- Exterior features: First-floor entry
Interior
- Kitchen: Dishwasher; Electric range; Refrigerator
- Bedrooms: No main-level bedrooms
- Flooring: Carpet; Tile
- Bathrooms: 2 full bathrooms
- Heating & cooling: Central electric heating; Central electric cooling
- Interior features: Walk-in closet(s); Blinds
- Laundry & utility: Laundry room; Electric water heater
Neighborhood map
What this means for you Summary
Snapshot
- This is a 2-bed/2.0-bath condo listed at $136k.
Deal economics
- At list price, monthly cash flow is $-72 ($-866/yr) — negative.
- The deal already cash-flows at list — no discount required.
- Meets the 1% rule at list price ($2k rent vs $136k).
- Recommended offer: $123k (9.0% below list) — sets the bar for market timing.
- Cap rate 5.7% vs local median 3.9% in Tamarac — top-decile yield for the area; either an underpriced asset or a hidden risk that comps aren't pricing in. Stress-test before assuming the spread holds.
Location & tenants
- Location reads 76/100 on livability (#239 in FL, #3,785 nationally) — a middle-class / working-renter tenant base. Strengths: housing A+, health & safety A+, cost of living A-; Watch: employment C-, amenities F, commute F.
- Broward (suburban): math 42% / reading 53% proficiency, ranked #46 of 73 in FL (top 63%) — families likely to look elsewhere, expect single-tenant / working-renter base with shorter leases.
- Zoned schools: Nova Blanche Forman Elementary (math 35% / reading 55%, grade D-, #1,271 of 2,144 statewide, top 60%, 769 students, 72% FRL); Nova Middle School (math 44% / reading 53%, grade C-, #274 of 571 statewide, top 50%, 1,284 students, 68% FRL); Nova High School (math 22% / reading 56%, grade F, #312 of 667 statewide, top 48%, 2,227 students, 59% FRL) — zoned schools average 66% FRL vs 51% district-wide (15 pts higher); higher-poverty schools than district average — tighter screening recommended.
- Market conditions: Rents soft (-1.4%/yr); 827 active listings in the ZIP; 40 comparable units currently listed for rent nearby; rentals at typical pace (median 26d on market — plan ~3-4 weeks tenant-placement turnaround); 2,111 units permitted in Broward County in 2024 (1,265 in 5+ unit buildings).
- At $2,326/mo this rent would consume 48% of the median local household income ($58k/yr) (locally 2809% of renters already pay >50% of income on rent) — very limited rent-growth headroom before tenants either downsize or default.
Forward outlook
- Local home prices are declining (-3.0%/yr); year-one equity from $937 of loan paydown is wiped out by about $4k of value loss. Plan a longer hold.
- Broward County population projected at +34% by 2050 — long-run rental-demand tailwind backs the buy-and-hold thesis.
Negotiation context
- It's been on market 102 days — a 9% lower offer ($123k) is reasonable based on typical stale-listing flexibility.
- 2 sale attempts since 3y ago with the ask held roughly flat each time — persistent listings suggest the price (not the market) is what's stuck; bring a comps-based counter.
- Current owner paid $71k; list at $136k implies a 91% gain — meaningful room to come down on a strong offer.
Risks & watch-outs
- Watch-outs: property tax is 2.6% of price; HOA is 36% of rent.
Questions for the listing agent
- What do current leases actually rent for vs. the listed asking? Can we see a recent rent roll and the last 12 months of T-12 income?
- It's been on market 102 days. Have you received any prior offers? Is the seller open to a 9% concession, seller financing, or rate buy-down credit?
- Property tax is high relative to price — has the assessment been appealed recently, and will the sale trigger a re-assessment?
- What does the HOA fee cover, when was the last increase, and are there any pending special assessments or reserve-fund shortfalls?
- Any open or pending special assessments — roof, HVAC, plumbing, elevator, façade? What's the per-unit balance and payoff schedule, and is the seller paying it off at close or rolling it to the buyer?
- Why hasn't it sold? Are there any deal-killer items the seller is aware of (foundation, flood, title, zoning, code violations)?
- Is there a deadline driving the sale (1031 exchange, divorce, estate, relocation)? That informs how much negotiation room exists.
- Schools are B-rated — typically a magnet for longer-tenancy family renters. What's the average tenant stay here, and is there a school-zone premium baked into asking?
- The area grade is low — what's the realistic commute time and amenity access for the typical tenant pool here? Any planned neighborhood developments (good or bad) we should know about?
- What's the average days-on-market for RENTAL listings here right now (not sales)? A rising rental-DOM trend means longer vacancies and softer asking-rent achievability than the comps imply.
- What's the recent tenant-quality profile in this submarket — average credit score on applications, eviction rate, late-payment / NSF rate, and stable-employment percentage? A property-management company in the area should have these aggregated.
- How much new apartment / multifamily construction is in the pipeline within 1–3 miles? Heavy new supply (>2% of stock underway) typically softens rents 12–24 months out; light construction supports rent growth.
Investment metrics
- 1% rule
- 1.72% ✓
- Cap rate
- 5.65%
- Cash-on-cash
- -2.28%
- DSCR
- 0.90
- GRM
- 4.9
CMA / ARV
No comps found within radius.
Projected returns pro-forma
-3.0% appreciation · 0.0% rent growth · sell at horizon
- IRR
- -27.0%
- Equity multiple
- 0.14×
- Total profit
- $-32,740
- Equity at exit
- $20,203
- IRR
- -75.3%
- Equity multiple
- -0.53×
- Total profit
- $-58,205
- Equity at exit
- $11,716
Cash invested: $37,940 (down + closing). Projections, not guarantees.
Landlord ↔ Tenant lean methodology
- Overall (STATE)
- 87 Strongly Landlord-Friendly
- State Florida
- 87 Strongly Landlord-Friendly · R+3
- County
- — inherits STATE
- City
- — inherits STATE
ZIP-level market 33319
- Rents YoY
- -1.4%
- Active inventory
- 827
- Price-to-rent
- 4.9×
Monthly cashflow live
- Estimated rent
- $2,326 high interval (Pro) →
- Mortgage (P&I)
- −$711
- Tax from tax record
- −$295 /mo · $3,540/yr
- Insurance
- −$56
- HOA est. from 5 same-building comps
- −$848
- Vacancy / Maint / Mgmt
- −$489
- Net cashflow
- $-72
Break-even live
Sensitivity live
| Price | -10% $5 | -5% $-34 | +0% $-72 | +5% $-111 | +10% $-149 |
|---|---|---|---|---|---|
| Rent | -10% $-256 | -5% $-164 | +0% $-72 | +5% $20 | +10% $112 |
| Rate | -1.0pp $-4 | -0.5pp $-38 | base $-72 | +0.5pp $-107 | +1.0pp $-143 |
UW: 25.0% down · 7.5% · 30yr · 1.5% tax · 5.0% vac · 8.0% maint · 8.0% mgmt
Financing live
Cash to close
- Down payment
- $33,875
- Closing costs
- $4,065
- Reserves months
- —
- Total cash needed
- —
Loan-product check · same deal, 3 products live
Conventional
25% down · 7.5% · 30yr
- Down + closing
- —
- Monthly P&I
- —
- Monthly cashflow
- —
- DSCR
- —
- Eligible?
- —
Personal DTI + credit; lowest rate.
DSCR
20% down · 8.5% · 30yr
- Down + closing
- —
- Monthly P&I
- —
- Monthly cashflow
- —
- DSCR
- —
- Eligible?
- —
No personal income docs; deal must DSCR.
Hard money
10% down · 12.0% · 12mo
- Down + closing
- —
- Monthly P&I
- —
- Monthly cashflow
- —
- DSCR
- —
- Eligible?
- —
Short-term bridge; refi at stabilization.
Rent comps 40 comps
| Address | Beds | Baths | Sqft | Rent | $/sqft | DOM | Units | Dist |
|---|---|---|---|---|---|---|---|---|
| 6075 N Sabal Palm Blvd #210 Tamarac, FL | 2.0 | 2.0 | 970 | $1,900 | $1.96 | 22d | 1 | 0.12mi |
| 2024 Champions Way North Lauderdale, FL | 2.0 | 2.0 | 948 | $2,500 | $2.64 | 26d | 1 | 0.20mi |
| 1812 Adventure Pl #1812 North Lauderdale, FL | 2.0 | 1.0 | 955 | $2,200 | $2.30 | 26d | 1 | 0.23mi |
| 6963 SW 19th St Pompano Beach, FL | 2.0 | 1.0 | 1054 | $1,700 | $1.61 | 26d | 1 | 0.25mi |
| 5780 Rock Island Rd #362 Tamarac, FL | 2.0 | 2.0 | 1030 | $1,900 | $1.84 | 26d | 1 | 0.28mi |
| 1850 Adventure Pl North Lauderdale, FL | 3.0 | 2.0 | 1336 | $2,750 | $2.06 | 26d | 1 | 0.30mi |
| 5476 Gate Lake Rd #5476 Tamarac, FL | 3.0 | 2.5 | 1811 | $2,900 | $1.60 | 3d | 1 | 0.36mi |
| 1908 Players Pl North Lauderdale, FL | 3.0 | 2.0 | 1336 | $1,150 | $0.86 | 26d | 1 | 0.37mi |
| 5424 Gate Lake Rd #5424 Tamarac, FL | 3.0 | 2.5 | 1811 | $3,000 | $1.66 | 26d | 1 | 0.40mi |
| 1953 Players Pl #1953 North Lauderdale, FL | 3.0 | 2.0 | 1186 | $2,400 | $2.02 | 26d | 1 | 0.40mi |
| 7174 Sportsmans Dr North Lauderdale, FL | 2.0 | 2.0 | 1186 | $2,400 | $2.02 | 26d | 1 | 0.41mi |
| 5646 Rock Island Rd #198 Tamarac, FL | 2.0 | 2.0 | 1030 | $2,150 | $2.09 | 26d | 1 | 0.45mi |
| 5628 Rock Island Rd Tamarac, FL | 1.0–2.0 | 1.0–2.0 | 867 | $2,000 | $2.31 | 6d | 2 | 0.46mi |
| 4717 NW 58th St Tamarac, FL | 2.0 | 2.0 | 1354 | $2,600 | $1.92 | 9d | 1 | 0.47mi |
| 5584 NW 59th Pl Tamarac, FL | 3.0 | 2.5 | 1488 | $2,700 | $1.81 | 26d | 1 | 0.48mi |
| 5843 Woodlands Blvd Unit 5843 Tamarac, FL | 3.0 | 2.5 | 1373 | $2,900 | $2.11 | 26d | 1 | 0.50mi |
| 6872 SW 15th St Pompano Beach, FL | 2.0 | 1.0 | 919 | $2,400 | $2.61 | 15d | 1 | 0.51mi |
| 33 Spinning Wheel Ln Tamarac, FL | 3.0 | 2.5 | 1865 | $2,750 | $1.47 | 26d | 1 | 0.52mi |
| 1720 SW 64th Ter North Lauderdale, FL | 3.0 | 2.0 | 1248 | $3,600 | $2.88 | 13d | 1 | 0.54mi |
| 4945 NW 55th Ct Tamarac, FL | 2.0 | 2.0 | 1579 | $2,850 | $1.80 | 6d | 1 | 0.57mi |
| 4934 NW 55th Ct Tamarac, FL | 2.0 | 1.0 | 1059 | $1,895 | $1.79 | 16d | 1 | 0.60mi |
| 4941 NW 55th St Tamarac, FL | 2.0 | 2.0 | 1639 | $2,700 | $1.65 | 26d | 1 | 0.61mi |
| 6711 Boulevard of Champions North Lauderdale, FL | 1.0 | 1.0 | 1216 | $1,800 | $1.48 | 26d | 1 | 0.64mi |
| 5821 Swordfish Ct Unit B Tamarac, FL | 2.0 | 2.5 | 1380 | $2,250 | $1.63 | 26d | 1 | 0.68mi |
| 1937 SW 60th Ter #1937 North Lauderdale, FL | 3.0 | 2.5 | 1640 | $2,650 | $1.62 | 26d | 1 | 0.75mi |
| 6056 SW 19th Pl North Lauderdale, FL | 2.0 | 2.5 | 1161 | $2,350 | $2.02 | 26d | 1 | 0.77mi |
| 1956 SW 60th Ter Unit 1956 North Lauderdale, FL | 3.0 | 2.5 | 1640 | $2,600 | $1.59 | 14d | 1 | 0.77mi |
| 1958 SW 60th Ter Unit 1958 North Lauderdale, FL | 3.0 | 2.5 | 1640 | $2,450 | $1.49 | 0d | 1 | 0.77mi |
| 1958 SW 60th Ter Unit 1958 North Lauderdale, FL | 3.0 | 2.5 | 1640 | $2,600 | $1.59 | 26d | 1 | 0.77mi |
| 6060 SW 19th Ct North Lauderdale, FL | 2.0 | 3.0 | 1120 | $2,200 | $1.96 | 26d | 1 | 0.78mi |
| 6081 SW 19th St North Lauderdale, FL | 2.0 | 2.5 | 1161 | $2,499 | $2.15 | 26d | 1 | 0.78mi |
| 6081 SW 19th St North Lauderdale, FL | 2.0 | 2.5 | 1161 | $2,290 | $1.97 | 6d | 1 | 0.78mi |
| 129 San Remo Blvd #129 North Lauderdale, FL | 3.0 | 2.5 | 1403 | $2,600 | $1.85 | 26d | 1 | 0.79mi |
| 1400 Avon Ln North Lauderdale, FL | 1.0–3.0 | 1.0–2.0 | 1070 | $2,298 | $2.15 | 0d | 60 | 0.82mi |
| 6812 Rio Pinar Unit 1 North Lauderdale, FL | 3.0 | 2.0 | 1610 | $3,500 | $2.17 | 23d | 1 | 0.83mi |
| 6812 Rio Pinar Unit 1 North Lauderdale, FL | 3.0 | 2.0 | 1610 | $3,500 | $2.17 | 18d | 1 | 0.83mi |
| 6812 Rio Pinar North Lauderdale, FL | 3.0 | 2.0 | 1610 | $3,500 | $2.17 | 12d | 1 | 0.83mi |
| 6009 SW 19th St North Lauderdale, FL | 3.0 | 2.0 | 1600 | $2,900 | $1.81 | 19d | 1 | 0.85mi |
| 1962 SW 60th Ave North Lauderdale, FL | 3.0 | 3.0 | 1280 | $2,500 | $1.95 | 21d | 1 | 0.85mi |
| 1984 SW 60th Ave Unit 1984 North Lauderdale, FL | 3.0 | 2.5 | 1640 | $2,650 | $1.62 | 26d | 1 | 0.85mi |
HOA detail condo
- Monthly dues
- $0 · $0/yr
- Likely covers
- parking
- Assessments
- None detected in remarks — confirm with the listing agent.
Listing history 22 events
-
2026-06-21days on market $135,500 Active 102 DOM
-
2026-06-18days on market $135,500 Active 99 DOM
-
2026-06-17days on market $135,500 Active 98 DOM
-
2026-06-16days on market $135,500 Active 97 DOM
-
2026-06-15days on market $135,500 Active 96 DOM
-
2026-06-13days on market $135,500 Active 94 DOM
-
2026-06-09days on market $135,500 Active 90 DOM
-
2026-06-07days on market $135,500 Active 88 DOM
-
2026-06-04days on market $135,500 Active 85 DOM
-
2026-06-03days on market $135,500 Active 84 DOM
-
2026-06-02days on market $135,500 Active 83 DOM
-
2026-06-01days on market $135,500 Active 82 DOM
-
2026-05-31days on market $135,500 Active 81 DOM
-
2026-03-24price $135,500
-
2026-03-24price $135
-
2026-03-24price $135,500
-
2025-04-27$137,900 Active
-
2024-10-20historical
-
2024-04-10price $149,200
-
2023-10-17price $174,850
-
2023-05-01$192,500 Active
-
2004-05-25soldstatus $71,000
ⓘ Source: listings_history table (triggers on properties + properties_extension) + one-shot
backfill from property_details.listing_events for pre-trigger history.
Tax reassessment forecast FL · Resets to sale price
- Current annual tax
- $3,540 · $295/mo
- Projected year-2 tax
- $3,540 · $295/mo
- Expected delta
- $0/yr ($0/mo · 0.0%)
ⓘ Screening estimate from a state-policy table — verify with the county assessor before closing.
Nearby sold comps map
Loading sold comps map…
Walkable amenities ~0.75 mi
Loading nearby amenities…
Taxation est. · year 1
- Rental income
- $27,917
- − Mortgage interest
- −$7,590
- − Property taxes
- −$3,540
- − Insurance
- −$678
- − Repairs & maintenance
- −$2,233
- − Management
- −$2,233
- − HOA
- −$10,176
- − Depreciation
- −$3,942
- Taxable loss
- −$2,476
- Est. tax savings @ 24.0%
- +$594
- After-tax cash flow
- $-272/yr
For passive investors: Depreciation is non-cash, so a rental often shows a tax loss while cash-flowing — sheltering income. Rental losses are passive: they offset passive income freely, and up to $25,000/yr can offset ordinary (W-2) income if you actively participate and your MAGI is under $100k (phasing out to $0 by $150k); unused losses carry forward. On sale, claimed depreciation is recaptured at up to 25%, and gains may owe capital-gains tax (a 1031 exchange can defer both). Figures are a year-1 estimate at your 24.0% rate — not tax advice; consult a CPA.
Schools (NCES district)
- District
- Broward
- NCES district ID
- 1200180
- Math proficiency
- 42% ▼ -18.00%
- Reading proficiency
- 53% ▼ -5.00%
- Median HH income
- $52,139
- Composite
- 40.88/100
- National rank
- #3621
- State rank
- #46 of 73 in FL
Livability — Tamarac
- Score
- 76/100
- State rank
- #239
- US rank
- #3785
Category grades
Schools grade is shown separately in the Schools card above.
Census & demographics
- Census place
- Tamarac, FL
- County
- Broward County · 1,963,430 people
- City population
- 105,666
- Metro
- Miami-Fort Lauderdale-Pompano Beach, FL
- Population (ZIP)
- 54,450
- Household income
- $58,388
- Rent vs Own
- Severe rent burden
- 2809.0
Population outlook (Broward County) Hauer SSP2
- Today (2025)
- 2,207,033 people
- By 2030
- 2,360,704 · +7.0%
- By 2040
- 2,661,208 · +20.6%
- By 2050
- 2,946,698 · +33.5%
- By 2075
- 3,602,273 · +63.2%
- By 2100
- 3,970,984 · +79.9%
Race, ethnicity, and origin ACS 2023
- Neighborhood character
- Diverse neighborhood (Simpson 0.58)
- Race & ethnicity
- Black 61% Hispanic / Latino 17% White 15% Two or more races 11% Asian 4%
- Hispanic origin (detail)
- Puerto Rican 4% Cuban 2% Dominican 1%
- Common ancestry
- Hispanic 13% Romanian 1% Italian 1%
- Foreign-born
- 46% · Canada, Jamaica, Vietnam
- Languages at home
- 64% English-only · Spanish 15% French/Haitian/Cajun 15% Other Indo-European 2%
Political lean MEDSL · Broward
- 2024 margin
- D (+17.0) · D 58.0% · R 41.0%
- 2008→2024 swing
- -17.8pp toward R · 2008: 34.7pp · 2024: 17.0pp
- All cycles
- 2024: D+17.0 2020: D+29.8 2016: D+35.0 2012: D+34.9 2008: D+34.7
Not yet ingested
- Civics
- —
Market trends
- HPI YoY
- ▼ -202.84%
- Current HPI
- 328.4307
- Rent YoY
- ▼ -1.38%
- Metro
- Miami-Fort Lauderdale-Pompano Beach, FL
- State GDP YoY
- ▲ 3.28%
- F500 in state
- 36
Industry mix (Fortune 500 HQ in FL)
| Industry | F500 HQs | Revenue |
|---|---|---|
| Industrial Technology | 2 | $29B |
|
||
| Insurance | 2 | $17B |
|
||
| Retail | 1 | $60B |
|
||
| Technology Distribution | 1 | $58B |
|
||
| Homebuilding | 1 | $35B |
|
||
| Technology Manufacturing | 1 | $35B |
|
||
Price history
+90.8% since first listed9 events — show timeline
- 2026-03-24 Price Changed $135,500 Beaches MLS
- 2026-03-24 Price Changed $135 Beaches MLS
- 2026-03-24 Price Changed $135,500 Beaches MLS
- 2025-04-27 Listed $137,900 Beaches MLS
- 2024-10-20 Listing Removed — MARMLS
- 2024-04-10 Price Changed $149,200 MARMLS
- 2023-10-17 Price Changed $174,850 MARMLS
- 2023-05-01 Listed $192,500 MARMLS
- 2004-05-25 Sold (Public Records) $71,000 Public Records
Property tax history
+14.4%/yrLatest (2025): $3,540 · +14.4% YoY. Source: county tax records.
Cash-flow waterfall
monthlySold comps — $/sqft
last 12 mo · ≤1 miLoading sold comps…