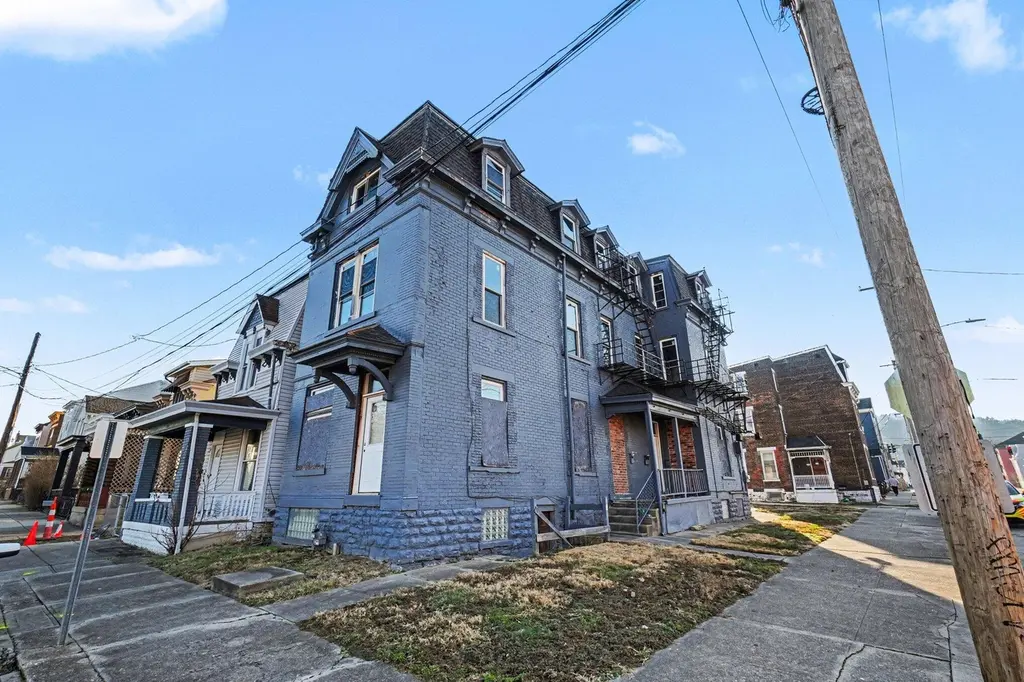
338 Hodge St · Newport, KY
Flood risk No data
- FEMA flood zone
- —
- Chance of flooding over 30 yrs
- —
- Est. flood insurance / yr
- —
Fire risk No data
- Est. fire insurance / yr
- —
Heat risk No data
- Hot days now (above threshold)
- —
- Hot days in 30 yrs
- —
Wind risk No data
- Chance of severe wind over 30 yrs
- —
Air-quality risk No data
- Unhealthy air days now
- —
- Unhealthy air days in 30 yrs
- —
Risk factors via First Street. Map © Google.
Why this score? — see what drove the B+ grade
The composite is a weighted blend of 9 inputs, each scored 0–100. Each bar is that input's sub-score; the figure is the points it added to the 100-point composite (weight × sub-score).
- Cash flow +30.0/30.0
- ARV discount +15.0/15.0
- 1% rule +10.0/10.0
- DSCR +10.0/10.0
- Livability +4.1/5.0
- Rent growth +3.7/5.0
- Schools +1.7/10.0
- Condition / age +1.0/5.0
- Appreciation +0.0/10.0
$187,000
🖨 Deal sheet (PDF) 📄 Offer letter ✓ Due diligence
Listing remarks MLS
Located in the historical district this property has a blank canvas ready to be reimagined! Possible luxury apartments, a multi-generational, a single family home, or commercial space . Offering two-separate existing entries. The architecture gem is three-levels and conveniently located near the city life. Amazing view of Downtown Cincinnati from the top floor of this property. Off street parking pad in the rear of property. Newer roof and windows. Property sold ''as is''
Key facts
- Newer roof
- Three-levels
- Newer windows
Tags
Neighborhood map
What this means for you Summary
Snapshot
- This is a ?-bed/2.0-bath other listed at $187k. Condition is rated poor.
Deal economics
- At list price, monthly cash flow is $1k ($14k/yr) — positive.
- The deal already cash-flows at list — no discount required.
- Meets the 1% rule at list price ($3k rent vs $187k).
- Recommended offer: $170k (9.0% below list) — sets the bar for market timing.
- Cap rate 13.6% vs local median 4.9% in Newport — top-decile yield for the area; either an underpriced asset or a hidden risk that comps aren't pricing in. Stress-test before assuming the spread holds.
Location & tenants
- Location reads 82/100 on livability (#58 in KY, #1,070 nationally) — a professional / high-income tenant draw. Strengths: amenities A+, commute A+, cost of living A+; Watch: crime F, employment D-.
- Newport Independent (suburban): math 14% / reading 26% proficiency, ranked #160 of 165 in KY (top 97%) — low school quality limits family demand, transient renter base, plan for 1-2y turnover; 79% free/reduced lunch — lower-income household profile, screen leases tightly.
- Zoned schools: Newport Intermediate School (math 12% / reading 22%, grade F, #607 of 676 statewide, top 91%, 387 students, 89% FRL); Newport High School (math 16% / reading 28%, grade F, #202 of 254 statewide, top 82%, 579 students, 84% FRL).
- Market conditions: Rents rising fast (+4.6%/yr); 239 active listings in the ZIP; 1 comparable units currently listed for rent nearby; 247 units permitted in Campbell County in 2024 (77 in 5+ unit buildings).
- At $2,860/mo this rent would consume 57% of the median local household income ($60k/yr) (locally 1136% of renters already pay >50% of income on rent) — very limited rent-growth headroom before tenants either downsize or default.
Forward outlook
- Local home prices are declining (-3.0%/yr); year-one equity from $1k of loan paydown is wiped out by about $6k of value loss. Plan a longer hold.
- At projected returns (-3.0% appreciation + 4.6% rent growth), your $52k cash investment doubles in ~5 years — after that, you're playing with house money.
Negotiation context
- It's been on market 110 days — a 9% lower offer ($170k) is reasonable based on typical stale-listing flexibility.
Risks & watch-outs
- Watch-outs: built in 1884 — expect roof / HVAC / electrical / plumbing capex.
Questions for the listing agent
- It's been on market 110 days. Have you received any prior offers? Is the seller open to a 9% concession, seller financing, or rate buy-down credit?
- Have any recent inspections been done? Can we get a copy of the seller's disclosures and any deferred-maintenance estimates?
- Built in 1884 — when were the roof, HVAC, electrical panel, plumbing, and water heater last replaced?
- Why hasn't it sold? Are there any deal-killer items the seller is aware of (foundation, flood, title, zoning, code violations)?
- Is there a deadline driving the sale (1031 exchange, divorce, estate, relocation)? That informs how much negotiation room exists.
- Schools are D-rated, which usually means shorter tenancies and higher turnover. Who's the typical renter profile here, and what's been the actual vacancy rate?
- Crime grade is F in this area — have there been break-ins, vandalism, or insurance claims at this property in the last 3 years? What carrier currently insures it and at what premium?
- What's the average days-on-market for RENTAL listings here right now (not sales)? A rising rental-DOM trend means longer vacancies and softer asking-rent achievability than the comps imply.
- What's the recent tenant-quality profile in this submarket — average credit score on applications, eviction rate, late-payment / NSF rate, and stable-employment percentage? A property-management company in the area should have these aggregated.
- How much new for-sale + rental construction is in the pipeline within 1–3 miles? Heavy new supply typically softens prices + rents 12–24 months out; constrained supply supports both.
Investment metrics
- 1% rule
- 1.53% ✓
- Cap rate
- 13.63%
- Cash-on-cash
- 26.20%
- DSCR
- 2.17
- GRM
- 5.4
CMA / ARV
- ARV (median comp)
- $285,876
- List price
- $187,000
- Delta
- -34.59%
- Verdict
- UNDERPRICED
- Comps
- 20 within 1.0 mi
Projected returns pro-forma
-3.0% appreciation · 4.64% rent growth · sell at horizon
- IRR
- 21.6%
- Equity multiple
- 1.90×
- Total profit
- $47,239
- Equity at exit
- $27,882
- IRR
- 30.7%
- Equity multiple
- 3.96×
- Total profit
- $154,977
- Equity at exit
- $16,168
Cash invested: $52,360 (down + closing). Projections, not guarantees.
Landlord ↔ Tenant lean methodology
- Overall (STATE)
- 83 Strongly Landlord-Friendly
- State Kentucky
- 83 Strongly Landlord-Friendly · R+16
- County
- — inherits STATE
- City
- — inherits STATE
ZIP-level market 41071
- Rents YoY
- 4.6%
- Active inventory
- 239
- Price-to-rent
- 5.4×
Monthly cashflow live
- Estimated rent
- $2,860 medium interval (Pro) →
- Mortgage (P&I)
- −$981
- Tax from tax record
- −$58 /mo · $692/yr
- Insurance
- −$78
- HOA
- −$0
- Vacancy / Maint / Mgmt
- −$601
- Net cashflow
- $1,143
Break-even live
Sensitivity live
| Price | -10% $1,249 | -5% $1,196 | +0% $1,143 | +5% $1,090 | +10% $1,037 |
|---|---|---|---|---|---|
| Rent | -10% $917 | -5% $1,030 | +0% $1,143 | +5% $1,256 | +10% $1,369 |
| Rate | -1.0pp $1,237 | -0.5pp $1,191 | base $1,143 | +0.5pp $1,095 | +1.0pp $1,045 |
UW: 25.0% down · 7.5% · 30yr · 1.5% tax · 5.0% vac · 8.0% maint · 8.0% mgmt
Financing live
Cash to close
- Down payment
- $46,750
- Closing costs
- $5,610
- Reserves months
- —
- Total cash needed
- —
Loan-product check · same deal, 3 products live
Conventional
25% down · 7.5% · 30yr
- Down + closing
- —
- Monthly P&I
- —
- Monthly cashflow
- —
- DSCR
- —
- Eligible?
- —
Personal DTI + credit; lowest rate.
DSCR
20% down · 8.5% · 30yr
- Down + closing
- —
- Monthly P&I
- —
- Monthly cashflow
- —
- DSCR
- —
- Eligible?
- —
No personal income docs; deal must DSCR.
Hard money
10% down · 12.0% · 12mo
- Down + closing
- —
- Monthly P&I
- —
- Monthly cashflow
- —
- DSCR
- —
- Eligible?
- —
Short-term bridge; refi at stabilization.
Rent comps 1 comps
| Address | Beds | Baths | Sqft | Rent | $/sqft | DOM | Units | Dist |
|---|---|---|---|---|---|---|---|---|
| 140 W 13th St Newport, KY | 3.0 | 3.5 | 2505 | $4,200 | $1.68 | 14d | 1 | 0.30mi |
Listing history 17 events
-
2026-06-21days on market $187,000 Active 110 DOM
-
2026-06-18days on market $187,000 Active 107 DOM
-
2026-06-17days on market $187,000 Active 106 DOM
-
2026-06-16days on market $187,000 Active 105 DOM
-
2026-06-15days on market $187,000 Active 104 DOM
-
2026-06-13days on market $187,000 Active 102 DOM
-
2026-06-09days on market $187,000 Active 98 DOM
-
2026-06-08days on market $187,000 Active 97 DOM
-
2026-06-07days on market $187,000 Active 96 DOM
-
2026-06-05days on market $187,000 Active 93 DOM
-
2026-06-03days on market $187,000 Active 92 DOM
-
2026-06-02days on market $187,000 Active 91 DOM
-
2026-06-01days on market $187,000 Active 90 DOM
-
2026-05-31days on market $187,000 Active 89 DOM
-
2026-05-18price $187,000 477-char remark
Show marketing remark (477 chars)
Located in the historical district this property has a blank canvas ready to be reimagined! Possible luxury apartments, a multi-generational, a single family home, or commercial space . Offering two-separate existing entries. The architecture gem is three-levels and conveniently located near the city life. Amazing view of Downtown Cincinnati from the top floor of this property. Off street parking pad in the rear of property. Newer roof and windows. Property sold ''as is''
-
2026-04-09price $195,000 477-char remark
Show marketing remark (477 chars)
Located in the historical district this property has a blank canvas ready to be reimagined! Possible luxury apartments, a multi-generational, a single family home, or commercial space . Offering two-separate existing entries. The architecture gem is three-levels and conveniently located near the city life. Amazing view of Downtown Cincinnati from the top floor of this property. Off street parking pad in the rear of property. Newer roof and windows. Property sold ''as is''
-
2026-03-03$199,000 Active 477-char remark
Show marketing remark (477 chars)
Located in the historical district this property has a blank canvas ready to be reimagined! Possible luxury apartments, a multi-generational, a single family home, or commercial space . Offering two-separate existing entries. The architecture gem is three-levels and conveniently located near the city life. Amazing view of Downtown Cincinnati from the top floor of this property. Off street parking pad in the rear of property. Newer roof and windows. Property sold ''as is''
ⓘ Source: listings_history table (triggers on properties + properties_extension) + one-shot
backfill from property_details.listing_events for pre-trigger history.
Tax reassessment forecast KY · Resets to sale price
- Current annual tax
- $692 · $58/mo
- Projected year-2 tax
- $1,608 · $134/mo
- Expected delta
- +$916/yr (+$76/mo · 132.5%)
ⓘ Screening estimate from a state-policy table — verify with the county assessor before closing.
Nearby sold comps map
Loading sold comps map…
Walkable amenities ~0.75 mi
Loading nearby amenities…
Taxation est. · year 1
- Rental income
- $34,320
- − Mortgage interest
- −$10,475
- − Property taxes
- −$692
- − Insurance
- −$935
- − Repairs & maintenance
- −$2,746
- − Management
- −$2,746
- − Depreciation
- −$5,440
- Taxable income
- $11,287
- Est. tax owed @ 24.0%
- −$2,709
- After-tax cash flow
- $11,009/yr
For passive investors: Depreciation is non-cash, so a rental often shows a tax loss while cash-flowing — sheltering income. Rental losses are passive: they offset passive income freely, and up to $25,000/yr can offset ordinary (W-2) income if you actively participate and your MAGI is under $100k (phasing out to $0 by $150k); unused losses carry forward. On sale, claimed depreciation is recaptured at up to 25%, and gains may owe capital-gains tax (a 1031 exchange can defer both). Figures are a year-1 estimate at your 24.0% rate — not tax advice; consult a CPA.
Condition & rehab AI · 11 photos
This property requires extensive repairs and updates to bring it up to a livable condition. Significant structural, exterior, and interior work is needed to improve its value and appeal.
Repairs flagged
- Major Exterior siding — Peeling and damaged in several areas.
- Major Roof — Appears to be in poor condition with visible damage.
- Major Windows — Boarded up and appear to be in poor condition.
- Major Foundation and structure — Signs of wear and potential structural issues.
- Major Landscaping — Minimal and unkempt.
- Major Exterior walls — Significant wear and tear.
- Major Exterior walls — Significant wear and tear.
- Major Exterior walls — Significant wear and tear.
- Major Exterior walls — Significant wear and tear.
- Major Exterior walls — Significant wear and tear.
Value-add opportunities
- Both New exterior siding — Improves curb appeal and structural integrity.
- Both New roof — Enhances safety and durability.
- Both New windows — Improves energy efficiency and security.
- Both Landscaping and curb appeal — Enhances overall aesthetic and property value.
- Both Foundation and structural repairs — Ensures safety and longevity of the property.
- Both Interior updates — Enhances living space and appeal for potential buyers/tenants.
- Both HVAC and mechanical updates — Ensures comfort and energy efficiency for occupants.
- Both Kitchen and bathroom updates — Modernizes spaces and improves functionality.
- Both Interior paint and finishes — Enhances the overall aesthetic and appeal of the property.
- Both Landscaping and curb appeal — Enhances overall aesthetic and property value.
Renovation cost estimate screening
| Repair item | Severity | Est. cost |
|---|---|---|
| Exterior siding · Peeling and damaged in several areas. | Major | $15,000–50,000 |
| Roof · Appears to be in poor condition with visible damage. | Major | $15,000–50,000 |
| Windows · Boarded up and appear to be in poor condition. | Major | $15,000–50,000 |
| Foundation and structure · Signs of wear and potential structural issues. | Major | $15,000–50,000 |
| Landscaping · Minimal and unkempt. | Major | $15,000–50,000 |
| Exterior walls · Significant wear and tear. | Major | $15,000–50,000 |
| Exterior walls · Significant wear and tear. | Major | $15,000–50,000 |
| Exterior walls · Significant wear and tear. | Major | $15,000–50,000 |
| Exterior walls · Significant wear and tear. | Major | $15,000–50,000 |
| Exterior walls · Significant wear and tear. | Major | $15,000–50,000 |
| Total estimated repair cost · 10 items | $150,000–500,000 |
Value-add ROI direction
- Both New exterior siding — Improves curb appeal and structural integrity. ↑
- Both New roof — Enhances safety and durability. ↑
- Both New windows — Improves energy efficiency and security. ↑
- Both Landscaping and curb appeal — Enhances overall aesthetic and property value. ↑
- Both Foundation and structural repairs — Ensures safety and longevity of the property. ↑
- Both Interior updates — Enhances living space and appeal for potential buyers/tenants. ↑
- Both HVAC and mechanical updates — Ensures comfort and energy efficiency for occupants. ↑
- Both Kitchen and bathroom updates — Modernizes spaces and improves functionality. ↑
- Both Interior paint and finishes — Enhances the overall aesthetic and appeal of the property. ↑
- Both Landscaping and curb appeal — Enhances overall aesthetic and property value. ↑
ⓘ Cost ranges are severity-bucket heuristics (US national rule-of-thumb). Get contractor quotes + a written scope before underwriting a rehab budget.
Schools (NCES district)
- District
- Newport Independent
- NCES district ID
- 2104440
- Math proficiency
- 14% ▼ -11.00%
- Reading proficiency
- 26% ▼ -6.00%
- Median HH income
- $35,783
- Composite
- 16.51/100
- National rank
- #9182
- State rank
- #160 of 165 in KY
Livability — Newport
- Score
- 82/100
- State rank
- #58
- US rank
- #1070
Category grades
Schools grade is shown separately in the Schools card above.
Census & demographics
- Census place
- Newport, KY
- County
- Campbell County · 84,793 people
- City population
- 19,680
- Metro
- Cincinnati, OH-KY-IN
- Population (ZIP)
- 19,680
- Household income
- $59,976
- Rent vs Own
- Severe rent burden
- 1136.0
Population outlook (Campbell County) Hauer SSP2
- Today (2025)
- 95,668 people
- By 2030
- 96,886 · +1.3%
- By 2040
- 97,734 · +2.2%
- By 2050
- 96,413 · +0.8%
- By 2075
- 90,211 · -5.7%
- By 2100
- 79,434 · -17.0%
Race, ethnicity, and origin ACS 2023
- Neighborhood character
- Predominantly White (84%)
- Race & ethnicity
- White 84% Black 7% Two or more races 6% Hispanic / Latino 5%
- Common ancestry
- Slovak 3% Lithuanian 2% Italian 2%
- Foreign-born
- 4% · Canada
- Languages at home
- 95% English-only · Spanish 3% Other Indo-European 1%
Political lean MEDSL · Campbell
- 2024 margin
- R (+19.7) · D 39.2% · R 58.9% · Other 1.9%
- 2008→2024 swing
- +1.2pp toward D · 2008: -20.9pp · 2024: -19.7pp
- All cycles
- 2024: R+19.7 2020: R+18.6 2016: R+24.5 2012: R+22.8 2008: R+20.9
Not yet ingested
- Civics
- —
Market trends
- HPI YoY
- ▼ -193.38%
- Current HPI
- 244.9069
- Rent YoY
- ▲ 4.64%
- Metro
- Cincinnati, OH-KY-IN
- State GDP YoY
- ▲ 1.81%
- F500 in state
- 4
Industry mix (Fortune 500 HQ in KY)
| Industry | F500 HQs | Revenue |
|---|---|---|
| Healthcare | 1 | $118B |
|
||
| Food / Beverage | 1 | $7B |
|
||
Price history
-6.0% since first listed3 events — show timeline
- 2026-05-18 Price Changed $187,000 NKMLS
- 2026-04-09 Price Changed $195,000 NKMLS
- 2026-03-03 Listed $199,000 NKMLS
Property tax history
+9.8%/yrLatest (2025): $692 · -3.3% YoY. Source: county tax records.
Cash-flow waterfall
monthlySold comps — $/sqft
last 12 mo · ≤1 miLoading sold comps…