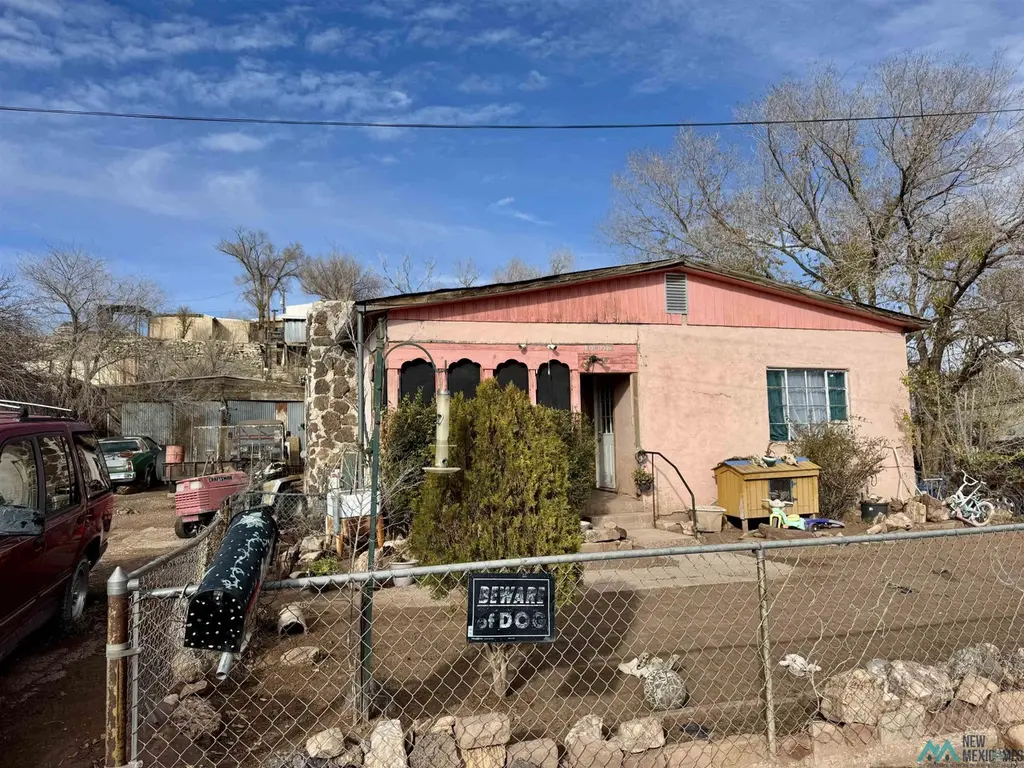
1318 Peel St · Grants, NM
Flood risk 1/10 · Minimal
- FEMA flood zone
- X (unshaded)
- Chance of flooding over 30 yrs
- 0.0%
- Est. flood insurance / yr
- $507 – $1,088
Fire risk 4/10 · Minor
- Est. fire insurance / yr
- $706 – $1,312
Heat risk 3/10 · Minor
- Hot days now (above 93°F)
- 7 days/yr
- Hot days in 30 yrs
- 18 days/yr
Wind risk 1/10 · Minimal
- Chance of severe wind over 30 yrs
- —
Air-quality risk 1/10 · Minimal
- Unhealthy air days now
- 0 days/yr
- Unhealthy air days in 30 yrs
- 0 days/yr
Risk factors via First Street. Map © Google.
Why this score? — see what drove the B- grade
The composite is a weighted blend of 9 inputs, each scored 0–100. Each bar is that input's sub-score; the figure is the points it added to the 100-point composite (weight × sub-score).
- Cash flow +30.0/30.0
- 1% rule +10.0/10.0
- DSCR +10.0/10.0
- ARV discount +7.5/15.0
- Livability +3.0/5.0
- Rent growth +2.5/5.0
- Condition / age +2.5/5.0
- Schools +1.8/10.0
- Appreciation +0.0/10.0
$79,000
🖨 Deal sheet 📄 Offer letter ✓ Due diligence
Listing remarks MLS
This well-sized family home offers over 1,600 square feet of comfortable living space in a convenient, central location. Enjoy a spacious living room plus an additional den, perfect for extra lounging or entertaining. The kitchen features abundant cabinet space and an open layout. All three bedrooms are generously sized, and the home includes a large full bathroom. Please note: This property does not offer mortgage or owner-financing options. Proof of funds is required prior to scheduling a showing.
Key facts
- Additional den
- Open layout
- Spacious living room
Tags
Neighborhood map
What this means for you Summary
Snapshot
- This is a 3-bed/1.0-bath other listed at $79k.
Deal economics
- At list price, monthly cash flow is $553 ($7k/yr) — positive.
- The deal already cash-flows at list — no discount required.
- Meets the 1% rule at list price ($1k rent vs $79k).
- Recommended offer: $70k (12.0% below list) — sets the bar for market timing.
Location & tenants
- Location reads 60/100 on livability (#115 in NM) — a middle-class / working-renter tenant base. Strengths: cost of living A+, housing A+; Watch: health & safety C-, crime D+, employment D.
- Grants-Cibola County Schools (town): math 14% / reading 22% proficiency, ranked #74 of 95 in NM (top 78%) — low school quality limits family demand, transient renter base, plan for 1-2y turnover; 70% free/reduced lunch — lower-income household profile, screen leases tightly.
- Market conditions: 76 active listings in the ZIP.
Forward outlook
- Local home prices are declining (-3.0%/yr); year-one equity from $546 of loan paydown is wiped out by about $2k of value loss. Plan a longer hold.
- Cibola County population projected at -14% by 2050 — secular population decline; favor cash flow + early exit over multi-decade hold.
- At projected returns (-3.0% appreciation + 3.0% rent growth), your $22k cash investment doubles in ~5 years — after that, you're playing with house money.
Negotiation context
- It's been on market 189 days — a 12% lower offer ($70k) is reasonable based on typical stale-listing flexibility.
Risks & watch-outs
- Watch-outs: built in 1949 — expect roof / HVAC / electrical / plumbing capex.
Questions for the listing agent
- It's been on market 189 days. Have you received any prior offers? Is the seller open to a 12% concession, seller financing, or rate buy-down credit?
- Built in 1949 — when were the roof, HVAC, electrical panel, plumbing, and water heater last replaced?
- Why hasn't it sold? Are there any deal-killer items the seller is aware of (foundation, flood, title, zoning, code violations)?
- Is there a deadline driving the sale (1031 exchange, divorce, estate, relocation)? That informs how much negotiation room exists.
- Schools are F-rated, which usually means shorter tenancies and higher turnover. Who's the typical renter profile here, and what's been the actual vacancy rate?
- Crime grade is D in this area — have there been break-ins, vandalism, or insurance claims at this property in the last 3 years? What carrier currently insures it and at what premium?
- What's the average days-on-market for RENTAL listings here right now (not sales)? A rising rental-DOM trend means longer vacancies and softer asking-rent achievability than the comps imply.
- What's the recent tenant-quality profile in this submarket — average credit score on applications, eviction rate, late-payment / NSF rate, and stable-employment percentage? A property-management company in the area should have these aggregated.
- How much new for-sale + rental construction is in the pipeline within 1–3 miles? Heavy new supply typically softens prices + rents 12–24 months out; constrained supply supports both.
Investment metrics
- 1% rule
- 1.69% ✓
- Cap rate
- 14.69%
- Cash-on-cash
- 30.00%
- DSCR
- 2.33
- GRM
- 4.9
CMA / ARV
- ARV (median comp)
- $225,000
- List price
- $79,000
- Delta
- -64.89%
- Verdict
- UNDERPRICED
- Comps
- 3 within 2.0 mi
Projected returns pro-forma
-3.0% appreciation · 3.0% rent growth · sell at horizon
- IRR
- 24.6%
- Equity multiple
- 2.01×
- Total profit
- $22,406
- Equity at exit
- $11,779
- IRR
- 32.4%
- Equity multiple
- 3.93×
- Total profit
- $64,824
- Equity at exit
- $6,830
Cash invested: $22,120 (down + closing). Projections, not guarantees.
Landlord ↔ Tenant lean methodology
- Overall (STATE)
- 55 Moderately Landlord-Leaning
- State New Mexico
- 55 Moderately Landlord-Leaning · D+3
- County
- — inherits STATE
- City
- — inherits STATE
ZIP-level market 87020
- Active inventory
- 76
- Price-to-rent
- 4.9×
Monthly cashflow live
- Estimated rent
- $1,333 medium interval (Pro) →
- Mortgage (P&I)
- −$414
- Tax from tax record
- −$53 /mo · $640/yr
- Insurance
- −$33
- HOA
- −$0
- Vacancy / Maint / Mgmt
- −$280
- Net cashflow
- $553
Break-even live
UW: 25.0% down · 7.5% · 30yr · 1.5% tax · 5.0% vac · 8.0% maint · 8.0% mgmt
Financing live
Cash to close
- Down payment
- $19,750
- Closing costs
- $2,370
- Reserves months
- —
- Total cash needed
- —
Loan-product check · same deal, 3 products live
Conventional
25% down · 7.5% · 30yr
- Down + closing
- —
- Monthly P&I
- —
- Monthly cashflow
- —
- DSCR
- —
- Eligible?
- —
Personal DTI + credit; lowest rate.
DSCR
20% down · 8.5% · 30yr
- Down + closing
- —
- Monthly P&I
- —
- Monthly cashflow
- —
- DSCR
- —
- Eligible?
- —
No personal income docs; deal must DSCR.
Hard money
10% down · 12.0% · 12mo
- Down + closing
- —
- Monthly P&I
- —
- Monthly cashflow
- —
- DSCR
- —
- Eligible?
- —
Short-term bridge; refi at stabilization.
Listing history 14 events
-
2026-06-18days on market $79,000 Active 189 DOM
-
2026-06-17days on market $79,000 Active 188 DOM
-
2026-06-16days on market $79,000 Active 187 DOM
-
2026-06-15days on market $79,000 Active 186 DOM
-
2026-06-13days on market $79,000 Active 184 DOM
-
2026-06-10days on market $79,000 Active 181 DOM
-
2026-06-09days on market $79,000 Active 180 DOM
-
2026-06-08days on market $79,000 Active 179 DOM
-
2026-06-07days on market $79,000 Active 178 DOM
-
2026-06-03days on market $79,000 Active 174 DOM
-
2026-06-02days on market $79,000 Active 173 DOM
-
2026-06-01days on market $79,000 Active 172 DOM
-
2026-05-31days on market $79,000 Active 171 DOM
-
2025-12-11$79,000 Active 504-char remark
Show marketing remark (504 chars)
This well-sized family home offers over 1,600 square feet of comfortable living space in a convenient, central location. Enjoy a spacious living room plus an additional den, perfect for extra lounging or entertaining. The kitchen features abundant cabinet space and an open layout. All three bedrooms are generously sized, and the home includes a large full bathroom. Please note: This property does not offer mortgage or owner-financing options. Proof of funds is required prior to scheduling a showing.
ⓘ Source: listings_history table (triggers on properties + properties_extension) + one-shot
backfill from property_details.listing_events for pre-trigger history.
Tax reassessment forecast NM · Resets to sale price
- Current annual tax
- $640 · $53/mo
- Projected year-2 tax
- $640 · $53/mo
- Expected delta
- $0/yr ($0/mo · 0.0%)
ⓘ Screening estimate from a state-policy table — verify with the county assessor before closing.
Climate risk First Street
- Flood 1/10 Low FEMA zone X (unshaded) · 0% chance over 30 yrs
- Wildfire 4/10 Moderate
- Heat 3/10 Moderate 7 d/yr ≥93°F today · 18 d/yr by 30 yrs out
- Wind 1/10 Low
- Air quality 1/10 Low 0 unhealthy d/yr today · 0 by 30 yrs out
Nearby sold comps map
Loading sold comps map…
Walkable amenities ~0.75 mi
Loading nearby amenities…
Taxation est. · year 1
- Rental income
- $16,001
- − Mortgage interest
- −$4,425
- − Property taxes
- −$640
- − Insurance
- −$395
- − Repairs & maintenance
- −$1,280
- − Management
- −$1,280
- − Depreciation
- −$2,298
- Taxable income
- $5,683
- Est. tax owed @ 24.0%
- −$1,364
- After-tax cash flow
- $5,271/yr
For passive investors: Depreciation is non-cash, so a rental often shows a tax loss while cash-flowing — sheltering income. Rental losses are passive: they offset passive income freely, and up to $25,000/yr can offset ordinary (W-2) income if you actively participate and your MAGI is under $100k (phasing out to $0 by $150k); unused losses carry forward. On sale, claimed depreciation is recaptured at up to 25%, and gains may owe capital-gains tax (a 1031 exchange can defer both). Figures are a year-1 estimate at your 24.0% rate — not tax advice; consult a CPA.
Schools (NCES district)
- District
- Grants-Cibola County Schools
- NCES district ID
- 3501170
- Math proficiency
- 14% —
- Reading proficiency
- 22% —
- Median HH income
- $35,996
- Composite
- 18.23/100
- National rank
- #14064
- State rank
- #74 of 95 in NM
Livability — Grants
- Score
- 60/100
- State rank
- #115
- US rank
- #19558
Category grades
Schools grade is shown separately in the Schools card above.
Census & demographics
- Census place
- Grants, NM
- Population (ZIP)
- 11,874
Population outlook (Cibola County) Hauer SSP2
- Today (2025)
- 26,324 people
- By 2030
- 25,594 · -2.8%
- By 2040
- 24,117 · -8.4%
- By 2050
- 22,568 · -14.3%
- By 2075
- 18,653 · -29.1%
- By 2100
- 12,719 · -51.7%
Race, ethnicity, and origin ACS 2023
- Neighborhood character
- Diverse neighborhood (Simpson 0.65)
- Race & ethnicity
- Hispanic / Latino 53% White 27% Two or more races 19% Native American 13% Black 4%
- Hispanic origin (detail)
- Mexican 22%
- Common ancestry
- Italian 5% Slovak 2% Lithuanian 1%
- Foreign-born
- 5% · Canada, Vietnam
- Languages at home
- 69% English-only · Spanish 24% Vietnamese 1%
Political lean MEDSL · Cibola
- 2024 margin
- Toss-up / Even · D 49.6% · R 48.0% · Other 2.4%
- 2008→2024 swing
- -28.1pp toward R · 2008: 29.6pp · 2024: 1.6pp
- All cycles
- 2024: D+1.6 2020: D+8.7 2016: D+6.8 2012: D+23.8 2008: D+29.6
Not yet ingested
- Civics
- —
Market trends
- HPI YoY
- ▼ -109.40%
- Current HPI
- 167.6417
- Rent YoY
- —
- Metro
- —
- State GDP YoY
- —
- F500 in state
- 0
Price history
1 event — show timeline
- 2025-12-11 Listed $79,000 NMMLS
Property tax history
+7.6%/yrLatest (2025): $640 · +3.6% YoY. Source: county tax records.
Cash-flow waterfall
monthlySold comps — $/sqft
last 12 mo · ≤1 miLoading sold comps…